


Report Overview
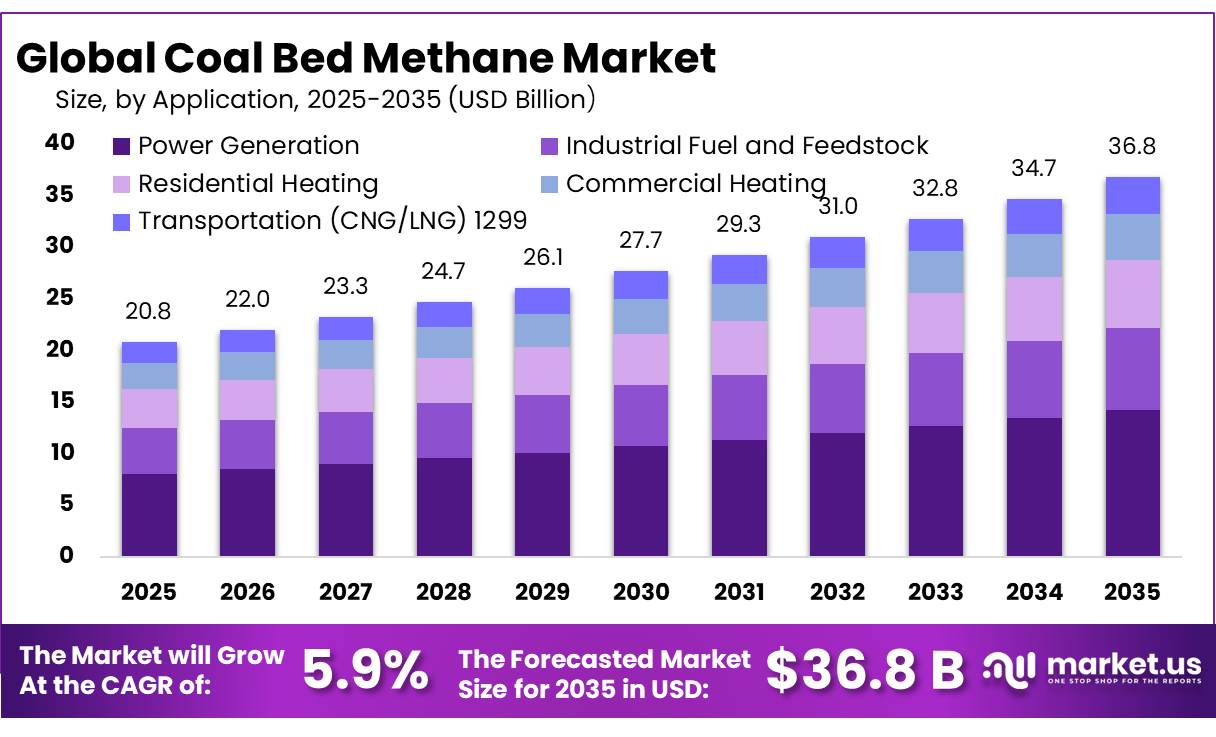
In 2025, the Global Coal Bed Methane Market valued at USD 20.8 billion, and between 2026 and 2035, this market is estimated to register a CAGR of 5.9%, reaching about USD 36.8 billion by 2035. Asia Pacific held a dominant market position, capturing more than a 36.40% share, holding USD 7.5 billion in revenue.
Coal bed methane (CBM), also called coal seam gas, is methane stored within coal formations and produced by lowering reservoir pressure. It has become an unconventional gas source because it can supplement pipeline gas, supply power and users, and create value from methane that might otherwise be vented during coal operations. The U.S. EIA recorded 685,591 million cubic feet of gross withdrawals from coalbed wells in 2024, including 233,616 million cubic feet in Colorado and 168,080 million cubic feet in New Mexico.
- Geoscience Australia reported 30,562 PJ, or 27.17 Tcf, of proven and probable coal seam gas reserves in 2023, alongside annual CSG production of 1,593 PJ, or 1.42 Tcf. China is scaling: Shanxi produced 13.43 billion cubic metres of CBM in 2024, representing about 80.6% of national output. These figures show the industry moving beyond mine-safety drainage toward energy production and integrated gas supply.
Key Takeaways
- Coal Bed Methane Market valued at USD 20.8 billion, to register a CAGR of 5.9%, reaching about USD 36.8 billion by 2035.
- Hydraulic Fracturing held a dominant market position, capturing more than a 51.20% share.
- Power Generation held a dominant market position, capturing more than a 38.70% share.
- Oil and Gas Companies held a dominant market position, capturing more than a 36.00% share.
- Asia Pacific held a dominant position in the Coal Bed Methane Market, capturing more than a 36.40% share and reaching USD 7.57 billion.
Demand fundamentals remain supportive. The IEA reported that global natural gas demand increased 1% in 2025, adding around 40 bcm, while the International Gas Union recorded global LNG trade of 436.98 million tonnes across 50 importing markets in the same year. CBM also has industrial relevance beyond power generation. The American Chemistry Council states that petroleum and natural gas provide 99% of chemical-industry hydrocarbon feedstocks in the United States, while natural gas and NGLs together account for more than half, supporting ammonia, methanol, carbon black and other chemical chains.
- In May 2025, the U.S. Department of Energy updated its 45ZCF-GREET model to recognize natural gas derived from coal-mine methane for transportation-fuel lifecycle assessment. Australia’s Future Gas Strategy also identifies captured coal-mine methane as an additional supply source; about 90,000 Queensland homes are powered by gas captured from underground coal mining. Such measures strengthen the commercial case for methane recovery, processing, compression and grid injection instead of direct release.
Future growth opportunities are likely to center on deeper coal seams, horizontal drilling, reservoir modelling, water-management technologies, methane capture at active and abandoned mines, and enhanced coalbed methane recovery. The IEA estimated that coal production emitted 39 Mt of methane in 2025 and that about half of coal-sector methane emissions could be abated with existing technology; across fossil fuels, more than 35 Mt could be avoided at no net cost under 2025 energy prices.
China’s latest coal-industry framework projects coalbed methane output reaching 26 billion cubic metres by 2030, signalling that methane recovery, emissions control and gas commercialization can expand together. For suppliers of drilling systems, compressors, separators, monitoring equipment and gas-treatment solutions, this creates an opportunity linked to energy security and methane reduction.
By Technology Analysis
Hydraulic Fracturing dominates the Coal Bed Methane Market with more than a 51.20% share
In 2025, “Hydraulic Fracturing” held a dominant market position, capturing more than a 51.20% share. The technology remains important in coal bed methane production because it creates and connects fractures within low-permeability coal formations, allowing trapped methane to move more easily toward the production well.
- The U.S. Geological Survey specifically identifies hydraulic fracturing as a well-stimulation method used in some coal beds to improve oil or gas flow. In its 2026 energy-resource publication, Geoscience Australia reported coal seam gas production of 1,665 PJ, equivalent to 1.48 Tcf, showing the substantial operating base where advanced well-completion technologies can support methane recovery.
Horizontal Drilling is increasingly important in coal bed methane development because it allows a longer section of the wellbore to remain in contact with the productive coal seam. This improves access to methane across a wider reservoir area and can make production more efficient in thin, laterally extensive coal formations.
Geoscience Australia’s 2026 assessment reported 28,955 PJ, or 25.75 Tcf, of proven and probable Australian coal seam gas reserves, highlighting a sizeable resource base that can support continued use of advanced drilling approaches.
By Application Analysis
Power Generation dominates the Coal Bed Methane Market with more than a 38.70% share
In 2025, “Power Generation” held a dominant market position, capturing more than a 38.70% share. Coal bed methane is well suited for electricity generation because recovered methane can be supplied to gas engines, turbines, and combined heat and power units near coal-producing locations. This approach can turn an available methane stream into useful electricity while reducing the need to release or flare the gas.
- The U.S. Energy Information Administration reported that the United States generated about 4.43 thousand TWh of electricity in 2025, while natural gas remained a major generation fuel. This large gas-fired power infrastructure creates a practical route for treated coal bed methane to enter electricity applications where suitable gas quality and infrastructure are available.
Industrial Fuel and Feedstock is an important application for coal bed methane because processed CBM has properties that allow it to serve many of the same industrial functions as conventional natural gas. Manufacturing facilities can use the gas for boilers, process heating, drying, steam production, and captive energy systems, while higher-quality methane can support chemical feedstock applications.
- According to the U.S. Energy Information Administration, industrial natural gas consumption reached a record 23.6 Bcf per day in 2025. In January 2026, industrial consumption averaged 26.1 Bcf per day. EIA also identifies the chemicals subsector as the largest industrial natural gas consumer, where gas is used for heat, electricity, and as a feedstock for methanol, fertilizer, and hydrogen production.
By End-User Analysis
Oil and Gas Companies dominate the Coal Bed Methane Market with more than a 36.00% share
In 2025, “Oil and Gas Companies” held a dominant market position, capturing more than a 36.00% share. These companies remain the main users of coal bed methane resources because they already operate drilling rigs, gas gathering networks, compression units, treatment facilities, and pipeline connections required to bring methane into commercial energy systems.
- In 2025, when U.S. marketed natural gas production reached a record 118.5 Bcf per day, according to the U.S. Energy Information Administration. In the first half of 2026, marketed production increased further to 121.3 Bcf per day, supporting continued investment in unconventional gas development and production infrastructure.
Electric Utilities represent an important end-user segment for coal bed methane because treated methane can be supplied to gas-fired turbines, engines, and combined-cycle power facilities. Utilities benefit from CBM where production fields are located close to gas pipelines or generating assets, reducing the infrastructure needed to move the fuel to power plants.
- In 2025, U.S. electric power-sector natural gas consumption averaged 35.8 Bcf per day, according to the U.S. Energy Information Administration. In May 2026, natural gas deliveries to the electric power sector reached 1,004 Bcf, equivalent to 32.4 Bcf per day. This large gas-consuming power base provides a practical outlet for commercially recovered coal bed methane after appropriate processing and quality control.
Key Market Segments
By Technology
- Hydraulic Fracturing
- Horizontal Drilling
- CO2 Sequestration
- De-watering
By Application
- Power Generation
- Industrial Fuel and Feedstock
- Residential Heating
- Commercial Heating
- Transportation (CNG/LNG) 1299
By End-User
- Oil and Gas Companies
- Electric Utilities
- Mining Operators
- Chemical and Fertilizer Producers
- Gas Distribution Utilities
Driver Analysis
China methane utilisation and basin build-out
China is the near-term volume anchor because methane utilisation has become aligned with both domestic-gas supply policy and coal-mine-emissions management. China’s National Methane Emissions Control Action Plan set a 2025 target to utilise 6 BCM per year of coal-mine gas, while Shanxi alone represents about 30% of national coal production and was estimated to account for nearly half of China’s coal-mine-methane emissions in one province-level assessment.
This concentration gives operators a scale advantage: gathering systems, compression, local distribution networks and power-generation projects can be deployed across dense mining and coal-seam corridors rather than built as isolated assets. National gas production was estimated at 263 BCM in 2025, up 16 BCM year on year, with growth in Shanxi and Shaanxi partly tied to CBM and tight gas; forward provincial planning has identified additional CBM/tight-gas increments of 2.4 BCM in Shanxi and 2.2 BCM in Shaanxi.
The estimated +1.2 percentage-point uplift arises from faster brownfield debottlenecking and state-supported infrastructure, although the ceiling is set by coal-seam heterogeneity, water disposal, methane concentration and whether recovered gas can achieve pipeline-grade specifications at economically sustainable compression costs.
Drivers Impact Analysis
| Driver | (~) % Impact on CAGR Forecast | Geographic Relevance | Impact Timeline |
|---|---|---|---|
| India licensing, pricing freedom and CBM blocks | +1.4 pp | India core; South Asia spill-over | Medium term (2–4 years) |
| China methane utilisation and basin build-out | +1.2 pp | China core; Northeast Asia | Short term (≤2 years) |
| Coal-mine methane capture and carbon value | +1.0 pp | EU, China, U.S., India | Medium term (2–4 years) |
| Gas import substitution and domestic offtake | +0.9 pp | India, China, Australia, SE Asia | Short term (≤2 years) |
| Horizontal drilling and water-management gains | +0.8 pp | China, India, Australia, U.S. | Medium term (2–4 years) |
| Pipeline, LNG and regional gas-market access | +0.6 pp | Australia, China, India, North America | Long term (≥4 years) |
Restraint Analysis
Produced-water burden
The operational exposure is especially material in Australia, where coal-seam-gas development has historically extracted more than 126,000 million litres of water annually, and in India and China, where surface-water scarcity and permitting scrutiny raise the cost of treatment, transport and disposal.
As a directional unit-cost reference, irrigation-grade membrane treatment in a major Australian development context has been estimated near A$1.24 per cubic metre when large dedicated treatment infrastructure is amortised; actual cost can rise substantially where water salinity is high, disposal wells are unavailable or trucking replaces pipeline handling.
The resulting capital is incurred before the highest-value gas volumes arrive, lowering project IRR, increasing debt-service risk and causing smaller operators to defer well pads; this supports an estimated -1.3 percentage-point CAGR drag through 2028, even where gas demand remains robust.
Restraint Impact Analysis
| Restraint | (~) % Impact on CAGR Forecast | Geographic Relevance | Impact Timeline |
|---|---|---|---|
| Produced-water burden | -1.3 pp | Australia, India, China, U.S. | Short term (≤2 years) |
| Low permeability, deep seams | -1.1 pp | China, India, Indonesia, South Africa | Medium term (2–4 years) |
| Coal–CBM tenure conflict | -0.9 pp | India core; China, Indonesia | Medium term (2–4 years) |
| LNG and pipeline-gas competition | -0.8 pp | Asia-Pacific, Europe, North America | Short term (≤2 years) |
| Methane MRV and venting rules | -0.7 pp | EU, Australia, China, U.S. | Medium term (2–4 years) |
| Gathering and offtake gaps | -0.6 pp | India, China, Africa, inland Australia | Long term (≥4 years) |
Opportunity Analysis
Abandoned-mine methane portfolios
The IEA estimates that abandoned coal mines released about 4.5 million tonnes of methane in 2025, within roughly 8 million tonnes from abandoned energy assets overall; using a 100-year global-warming-potential conversion of approximately 28 times carbon dioxide, this represents about 126 million tonnes of CO22-equivalent annual emissions and a large potential credit-and-energy pool.
Commercialisation can combine methane drainage, enclosed flaring, power generation, heat supply or pipeline upgrading, while established methodologies already support projects through California’s mine-methane protocol, the American Carbon Registry, Verra and legacy Clean Development Mechanism routes. Portfolio aggregation is the value-creation mechanism: a developer that bundles 15–30 small sites can centralise methane measurement, land-rights negotiation, engineering procurement, carbon-credit verification and power sales, potentially reducing site-level development overhead by 20–35% versus bespoke projects.
This is not automatic gas-supply growth—the gas flow may be variable and too dilute for pipelines—but focused acquisitions of liability-bearing mine closures can create a +1.5 percentage-point CAGR upside when carbon revenue, avoided-emissions value and distributed-energy offtake are contractually stacked.
Opportunity Impact Analysis
| Opportunity | (~) % Potential CAGR Upside | Geographic Relevance | Execution Window |
|---|---|---|---|
| Abandoned-mine methane portfolios | +1.5 pp | U.S., China, EU, Australia | Medium term (2–4 years) |
| Low-concentration VAM conversion | +1.2 pp | China, Australia, EU, India | Medium term (2–4 years) |
| India CBM acreage roll-up | +1.1 pp | India core; South Asia | Short term (≤2 years) |
| Methane-certified gas premiums | +0.9 pp | EU-linked, Australia, North America | Medium term (2–4 years) |
| Mine-to-grid energy hubs | +0.8 pp | China, India, Indonesia, Africa | Medium term (2–4 years) |
| Shared midstream platform model | +0.7 pp | India, China, Australia, Africa | Long term (≥4 years) |
Challenges Analysis
Reservoir-data uncertainty
CBM reservoir modelling remains probabilistic because gas content, permeability, cleat continuity, stress sensitivity, water saturation, coal thickness and faulting can vary substantially over distances shorter than a standard development pad spacing, so appraisal success does not automatically support full-field extrapolation. The technical challenge intensifies in deeper Chinese coal seams, where development increasingly targets intervals below 2,000 metres and higher in-situ stress can reduce fracture conductivity and restrict desorption pathways; in India, fractured reservoir architecture and incomplete seismic coverage similarly increase the probability that early pilots overstate later well productivity.
A practical development program may require 6–12 pilot wells, 12–24 months of pressure-transient and dewatering history, and 90–180 days of stabilised gas-flow data before a credible type curve can be established, extending the capital-at-risk period relative to conventional gas projects. The result is a 15–30% spread between low- and high-case estimated ultimate recovery in many immature areas, forcing lenders to discount reserve-backed borrowing bases and operators to use smaller pad phases; mitigating the estimated -1.0 percentage-point growth friction requires integrated 3D seismic, core desorption, microseismic fracture mapping, production surveillance and continuously updated geostatistical models rather than one-time resource certification.
Challenges Impact Analysis
| Challenge | (~) % CAGR Friction Drag | Geographic Relevance | Mitigation Horizon |
|---|---|---|---|
| Reservoir-data uncertainty | -1.0 pp | China, India, Indonesia, Africa | Medium term (2–4 years) |
| Dewatering production decline | -0.9 pp | Australia, China, India, U.S. | Long term (≥4 years) |
| Specialist-service scarcity | -0.7 pp | India, China, Mongolia, Africa | Medium term (2–4 years) |
| Methane-data reconciliation | -0.6 pp | EU, Australia, China, North America | Medium term (2–4 years) |
| Midstream utilisation mismatch | -0.6 pp | India, China, Australia, Africa | Long term (≥4 years) |
| Gas-price volatility exposure | -0.5 pp | Asia-Pacific, Europe, North America | Short term (≤2 years) |
Geopolitical Impact Analysis
The ongoing Russia-Ukraine war and the 2026 Middle East conflict are reshaping natural gas security and indirectly supporting interest in coal bed methane as a domestic gas source. The IEA reported that the de facto closure of the Strait of Hormuz after the Middle East war began in February 2026 disrupted LNG flows representing almost 20% of global LNG supply. This shock increased gas-price volatility and strengthened the case for locally produced unconventional gas, including CBM, in countries with commercial coal resources. The European Union is also reducing reliance on Russian energy; the EU Council stated that Russian gas represented about 13% of EU gas imports in 2025, worth more than €15 billion annually.
For the Coal Bed Methane market, these disruptions improve the strategic value of gas produced close to domestic industrial and power users. CBM can help diversify supply, reduce exposure to LNG shipping routes, and support power generation, industrial heating, and gas-network resilience. At the same time, war-related fuel costs, equipment delays, financing uncertainty, and volatile commodity prices can slow drilling projects. The overall geopolitical environment creates a mixed outlook, but energy-security concerns are likely to keep CBM development relevant where infrastructure and geology support economical production.
Regional Insights
In 2025, Asia Pacific held a dominant position in the Coal Bed Methane Market, capturing more than a 36.40% share and reaching USD 7.57 billion. The region benefits from large coal-bearing basins, established gas infrastructure, rising industrial gas use, and stronger methane-recovery programs. China remains a major production centre. In the first quarter of 2025, Shanxi Province produced 3.53 billion cubic metres of coalbed methane, rising 14.5% year over year, according to official provincial statistics reported by the State Council Information Office.
Australia also provides a strong commercial base. Geoscience Australia’s 2026 assessment reported coal seam gas production of 1,665 PJ, equal to 1.48 Tcf, with proven and probable reserves of 28,955 PJ, or 25.75 Tcf. These resources support power generation, domestic gas supply, industrial fuel use, and LNG-linked infrastructure, reinforcing Asia Pacific’s leading market position.
Asia Pacific is also positioned as the fastest-growing regional opportunity as governments place greater emphasis on domestic gas security and methane utilization. China’s updated coalbed-gas emission framework requires utilization of gas containing more than 8% methane and set a target for the coal-mining sector to collect 6 billion cubic metres of coalbed gas for utilization by 2025. This policy direction encourages investment in gas capture, treatment, compression, monitoring, and pipeline connectivity.
Growth is also supported by wider natural-gas demand. China produced 109.6 billion cubic metres of natural gas during the first five months of 2025, increasing 6.0% year over year, while May output reached 22.1 billion cubic metres, up 9.1%. Continued adoption of horizontal drilling, dewatering systems, reservoir analytics, and methane-control equipment is expected to improve CBM recovery and strengthen commercial development across the region.
Key Regions and Countries Insights
- North America
- US
- Canada
- Europe
- Germany
- France
- The UK
- Spain
- Italy
- Rest of Europe
- Asia Pacific
- China
- Japan
- South Korea
- India
- Australia
- Rest of APAC
- Latin America
- Brazil
- Mexico
- Rest of Latin America
- Middle East & Africa
- GCC
- South Africa
- Rest of MEA
Key Players Analysis
PetroChina Company Limited remains an important coal bed methane participant through its unconventional gas exploration, production, and technology capabilities in China. The company has conducted large-scale CBM exploration and development since 2006, building expertise for complex coal reservoirs. During the first nine months of 2025, PetroChina produced 3.98 trillion cubic feet of marketable natural gas, up 4.6% year over year, while domestic output reached 3.86 trillion cubic feet.
Arrow Energy Pty Ltd. is strongly positioned in coal seam gas through its Surat Gas Project in Queensland. The project is designed to deliver up to 700 terajoules of natural gas per day when fully operational, supporting a long-term gas supply base. In April 2025, Arrow began construction on more than 30 kilometres of pipeline for its northern development, while drilling of up to 450 new gas wells was planned, with first gas targeted for 2026, strengthening its production outlook.
Top Key Players Outlook
- PetroChina Company Limited
- Arrow Energy Pty Ltd.
- Santos Limited
- Origin Energy Limited
- Shell plc (QGC)
- ConocoPhillips Company
- BP plc
- Halliburton Company
- Baker Hughes Company
- Reliance Industries Limited
- Essar Oil and Gas E&P Limited
- China United Coalbed Methane Corp.
- ExxonMobil (XTO Energy)
- Great Eastern Energy Corp. Ltd. (GEECL)
- PETRONAS
Recent Developments
- In August 2026, Shell and PetroChina’s 50:50 Arrow Energy joint venture approved the next Surat Gas Project phase with 143 backfill wells, designed to deliver around 79 million standard cubic feet per day, or 84 TJ per day, at peak production.
- In August 2026, BP agreed to acquire Woodside Energy’s 70% interest in the Calypso gas project in Trinidad and Tobago, increasing its ownership to 100% and expanding its future gas-resource base.
Report Scope
| Report Features | Description |
|---|---|
| Market Value (2025) | USD 20.8 Bn |
| Forecast Revenue (2035) | USD 36.8 Bn |
| CAGR (2026-2035) | 5.9% |
| Base Year for Estimation | 2025 |
| Historic Period | 2020-2024 |
| Forecast Period | 2026-2035 |
| Report Coverage | Revenue Forecast, Market Dynamics, Competitive Landscape, Recent Developments |
| Segments Covered | By Technology (Hydraulic Fracturing, Horizontal Drilling, CO2 Sequestration, De-watering), By Application (Power Generation, Industrial Fuel and Feedstock, Residential Heating, Commercial Heating, Transportation (CNG/LNG) 1299), By End-User (Oil and Gas Companies, Electric Utilities, Mining Operators, Chemical and Fertilizer Producers, Gas Distribution Utilities) |
| Regional Analysis | North America – US, Canada; Europe – Germany, France, The UK, Spain, Italy, Rest of Europe; Asia Pacific – China, Japan, South Korea, India, Australia, Singapore, Rest of APAC; Latin America – Brazil, Mexico, Rest of Latin America; Middle East & Africa – GCC, South Africa, Rest of MEA |
| Competitive Landscape | PetroChina Company Limited, Arrow Energy Pty Ltd., Santos Limited, Origin Energy Limited, Shell plc (QGC), ConocoPhillips Company, BP plc, Halliburton Company, Baker Hughes Company, Reliance Industries Limited, Essar Oil and Gas E&P Limited, China United Coalbed Methane Corp., ExxonMobil (XTO Energy), Great Eastern Energy Corp. Ltd. (GEECL), PETRONAS |
| Customization Scope | Customization for segments, region/country-level will be provided. Moreover, additional customization can be done based on the requirements. |
| Purchase Options | We have three licenses to opt for: Single User License, Multi-User License (Up to 5 Users), Corporate Use License (Unlimited User and Printable PDF) |





































