


Report Overview
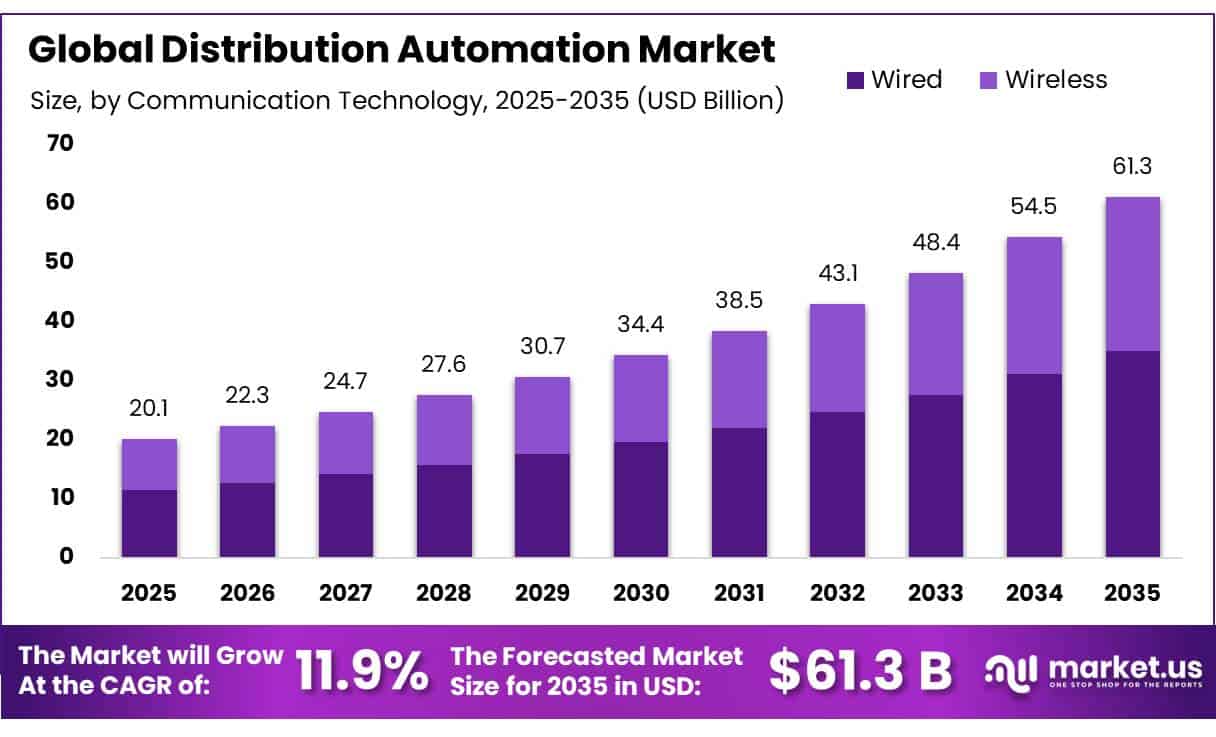
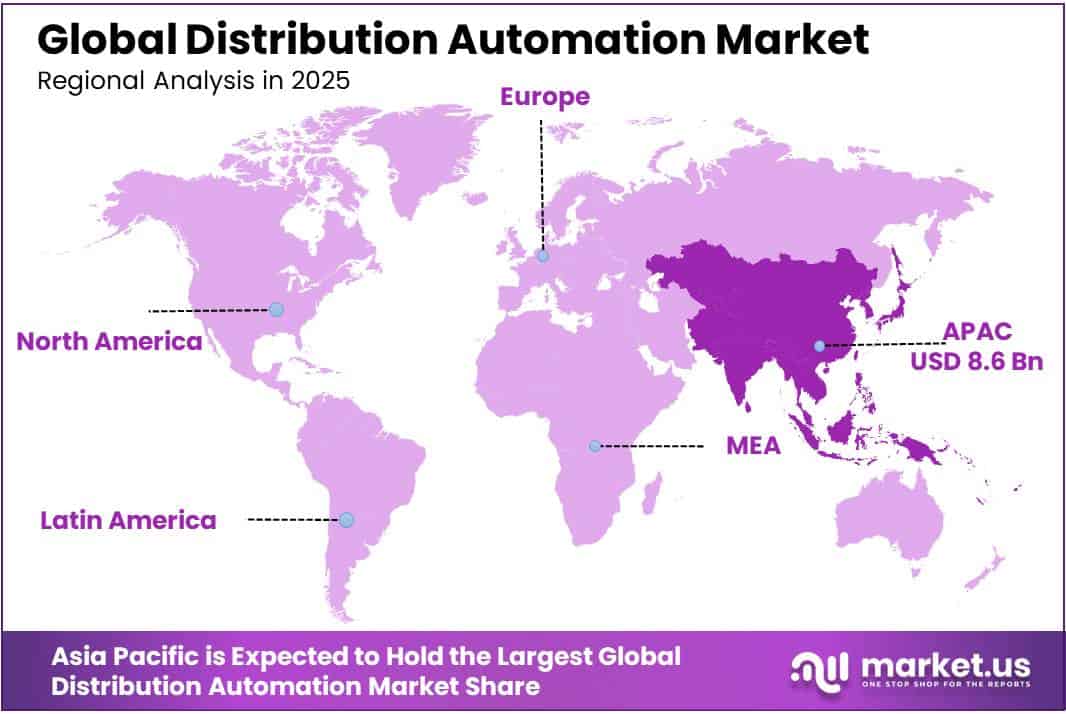
In 2025, the Global Distribution Automation Market valued at USD 20.1 billion, and between 2026 and 2035, this market is estimated to register a CAGR of 11.9%, reaching about USD 61.3 billion by 2035. Asia Pacific held a dominant market position, capturing more than a 43.2% share, holding USD 8.6 billion in revenue.
Distribution automation is becoming a core part of modern electric-grid operations as utilities shift from manual switching toward sensor-based, remotely controlled and self-healing networks. The International Energy Agency expects global electricity consumption to rise from 28,200 TWh in 2025 to 33,600 TWh by 2030, with average annual demand growth of 3.6% during 2026-2030. Higher load is increasing the need for automated feeder monitoring, voltage control, fault detection, outage management and real-time network visibility.
- The IEA reports that more than 2,500 GW of renewable, storage and large-load projects are stalled in connection queues, while annual grid investment is around USD 400 billion. Meeting electricity needs through 2030 would require annual grid spending to increase by roughly 50%. Distribution automation can help utilities use existing infrastructure more efficiently while network expansion moves through planning and construction.
Key Takeaways
- Distribution Automation Market valued at USD 20.1 billion, and between 2026 and 2035, this market is estimated to register a CAGR of 11.9%, reaching about USD 61.3 billion by 2035.
- Field Devices held a dominant market position, capturing more than a 52.80% share.
- Wired held a dominant market position, capturing more than a 57.20% share.
- Feeder Automation held a dominant market position, capturing more than a 42.00% share.
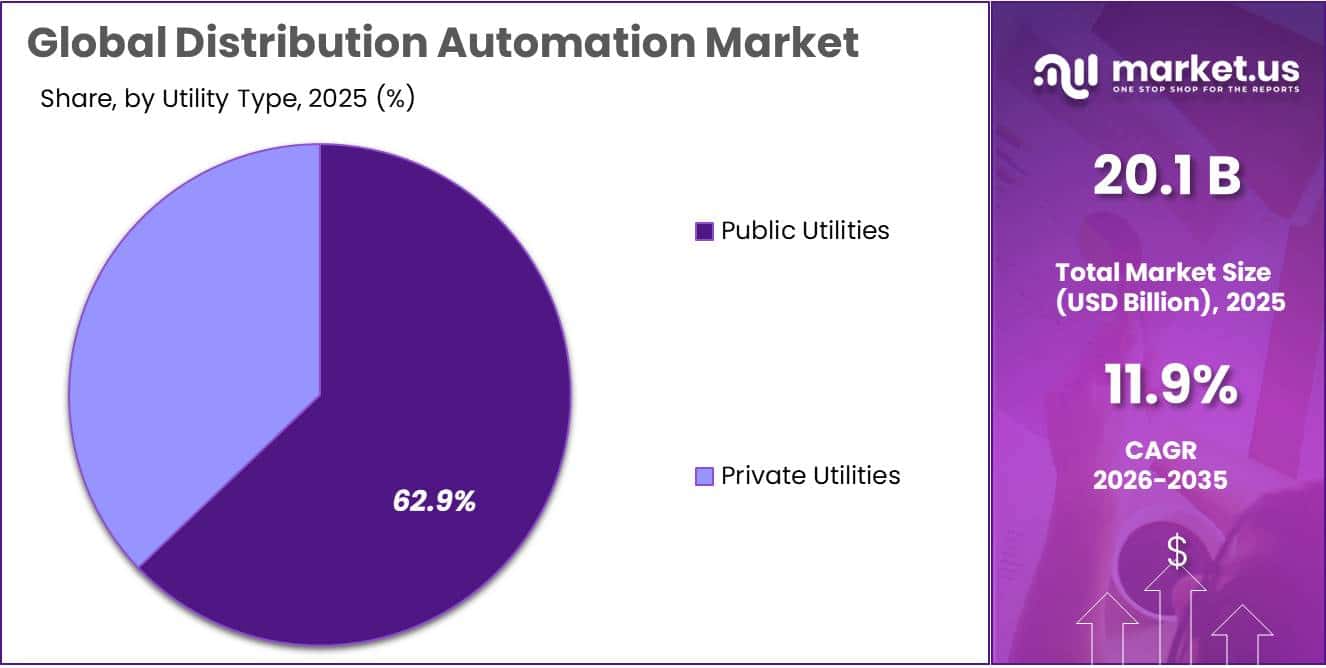
- Public Utilities held a dominant market position, capturing more than a 62.90% share.
- Asia Pacific held a dominant market position, capturing more than a 43.20% share and generating about USD 8.67 billion.
Reliability is another major driver. U.S. Energy Information Administration data show that the average U.S. electricity customer experienced about 11 hours of interruptions in 2024, with major events accounting for 80% of outage hours. Interruptions linked to major events averaged nearly 9 hours. These conditions support wider deployment of fault location, isolation and service restoration, automated reclosers, intelligent electronic devices, SCADA and advanced distribution management systems that can identify faults and restore unaffected sections faster.
- Government programs are strengthening the investment environment. In March 2026, the U.S. Department of Energy announced approximately USD 1.9 billion for critical grid upgrades under the SPARK opportunity. The program builds on the GRIP framework, which provided up to USD 10.5 billion over five years for resilience and grid innovation. In Europe, the European Commission estimates around EUR 730 billion of distribution-grid development will be needed by 2040, supporting digital monitoring, automation and control technologies.
Renewable integration is further expanding the role of distribution automation. The IEA expects variable renewable generation in the European Union to rise from 30% of electricity generation in 2025 to 46% by 2030. It also projects more than 400 GW of net renewable capacity additions during 2026-2030, with 70% coming from solar PV. Higher penetration of variable resources increases the need for automated voltage regulation, DER management, bidirectional power-flow visibility and coordinated protection.
Future growth opportunities are moving toward software-led, data-rich distribution networks. IEA analysis indicates that non-firm connections and grid-enhancing measures could unlock around 1,200-1,600 GW of advanced-stage projects waiting for grid access. Flexible connection agreements could enable about 750-900 GW, while technology upgrades could unlock another 450-700 GW. This creates long-term opportunity for ADMS, DERMS, AI-based forecasting, predictive maintenance, digital substations, cybersecurity, edge analytics and automated switching as utilities seek higher capacity, resilience and operational flexibility.
By Offering Analysis
Field Devices lead the Distribution Automation Market with a 52.80% share as utilities expand real-time monitoring and automated grid control.
In 2025, “Field Devices” held a dominant market position, capturing more than a 52.80% share. Field devices remain central to distribution automation because utilities depend on automated switches, reclosers, intelligent electronic devices, sensors, remote terminal units and voltage-control equipment to collect grid data and respond quickly to faults. Their strong position is supported by continued spending on physical grid upgrades and operational automation.
- In March 2026, the U.S. Department of Energy announced approximately USD 1.9 billion for critical power-grid upgrades under its SPARK funding opportunity, with projects aimed at improving grid capacity, operational efficiency, reliability and security. This investment environment supports continued installation of intelligent field equipment that connects physical distribution assets with utility control centers.
Software is becoming an important part of distribution automation as power utilities require better control over increasingly complex networks. Advanced distribution management systems, outage management software, grid analytics, DER management platforms and AI-based applications help operators combine data collected from field equipment and make faster operating decisions. In 2026, the European Commission stated that its Horizon Europe 2026–2027 programme provides approximately EUR 100 million for advanced smart-grid solutions and EUR 75 million for AI applications in the energy sector.
- The Commission also estimated that digitalisation of the EU energy system could generate around EUR 71 billion per year in direct consumer savings and more than EUR 300 billion in broader system benefits. These developments provide a strong base for wider adoption of distribution automation software for forecasting, fault management, network optimisation and real-time grid control.
By Communication Technology Analysis
Wired communication dominates the Distribution Automation Market with a 57.20% share, supported by stable and secure data transmission across critical grid assets.
In 2025, “Wired” held a dominant market position, capturing more than a 57.20% share. Wired communication remains widely used in distribution automation because fiber-optic, Ethernet and power-line communication can provide stable connections between substations, control centers and field equipment. These networks are particularly important for protection, feeder monitoring and automated switching, where dependable communication is essential.
- In 2026, the U.S. Department of Energy’s Smart Grid Grants program continued within a framework providing up to USD 600 million per year for smart-grid resilience technologies through fiscal 2026. DOE identifies communication and control capabilities as important elements for improving grid flexibility, reliability and integration of grid-edge devices.
Wireless communication is becoming increasingly important in distribution automation because it allows utilities to connect field devices without extending physical communication cables to every location. Private LTE, radio-frequency networks and other wireless technologies can support remote monitoring, fault detection and control across geographically spread distribution assets.
- In February 2026, the U.S. Federal Communications Commission adopted rules expanding broadband opportunities across all 10 MHz of the 900 MHz band, specifically supporting utilities, critical infrastructure operators and enterprises deploying private broadband networks. The action covers spectrum at 896-901 MHz and 935-940 MHz, creating more room for secure private wireless communication that can support digital utility operations and future distribution automation deployments.
By Application Analysis
Feeder Automation dominates the Distribution Automation Market with a 42.00% share, supported by growing deployment of intelligent devices across distribution grids.
In 2025, “Feeder Automation” held a dominant market position, capturing more than a 42.00% share. Feeder automation remains important because utilities use automated switches, reclosers, sensors and fault-management systems to identify network problems and restore electricity with less manual intervention.
- U.S. Department of Energy data published in January 2025 identified a USD 60 million project designed to deploy hundreds of wireless-connected smart-grid devices across the distribution grid and upgrade operating software. The DOE also identifies Smart Grid Grants as a USD 3 billion program area supporting grid flexibility and renewable-energy integration at the distribution level.
Load & Voltage Management is becoming increasingly important as utilities face stronger and more variable electricity demand across distribution networks. Automated voltage regulators, capacitor controls, smart inverters and distribution-management platforms help utilities maintain acceptable voltage levels while balancing changing loads.
- In July 2026, U.S. Energy Information Administration data showed that ERCOT electricity demand reached a record 91.1 GW, while the Southwest Power Pool reached 57.9 GW later in the same month. The ERCOT peak was 6% above its previous record, highlighting growing pressure on grid operators to manage peak loads and maintain stable operating conditions. These trends support wider adoption of automated load balancing, Volt/VAR optimisation and real-time voltage-management technologies.
By Utility Type Analysis
Public Utilities lead the Distribution Automation Market with a 62.90% share, supported by large-scale grid modernization and reliability programs.
In 2025, “Public Utilities” held a dominant market position, capturing more than a 62.90% share. Public utilities remain major adopters of distribution automation because they are responsible for maintaining reliable electricity networks while upgrading aging infrastructure. Automated feeder controls, smart meters, fault detection systems and digital substations help these utilities improve outage response and manage growing electricity demand.
- In March 2026, the U.S. Department of Energy announced approximately USD 1.9 billion for critical power-grid upgrades. The program builds on the GRIP framework, which provided up to USD 10.5 billion in competitive funding to states, tribes, electric utilities and other eligible participants. Such public funding creates a strong environment for wider deployment of automated distribution technologies.
Private Utilities are steadily expanding the use of distribution automation to reduce operating costs, improve asset visibility and manage outages more efficiently. Investor-owned utilities generally operate large customer networks, making automated switching, intelligent sensors, advanced metering and distribution-management software useful for improving day-to-day grid performance.
- U.S. Energy Information Administration data published in 2025 show that investor-owned utilities supplied 56% of U.S. retail electricity sales in the latest annual dataset. The EIA also projected electricity consumption to increase through 2026, with commercial-sector consumption growing at an average 2.6% annually and industrial consumption increasing 2.1% annually from 2020 through 2026. This growing load supports continued investment by private utilities in automated and digitally controlled distribution infrastructure.
Key Market Segments
By Offering
- Field Devices
- Software
- Services
By Communication Technology
- Wired
- Wireless
By Application
- Feeder Automation
- Load & Voltage Management
- Asset Monitoring
- Others
By Utility Type
- Public Utilities
- Private Utilities
Driver Analysis
Grid-resilience capex and outage automation
Grid resilience is the most immediate volume catalyst because utilities can convert reliability spending into deployable feeder-level packages: fault indicators, automated reclosers, sectionalizers, capacitor controls, remote terminal units, communications gateways and feeder-automation software. In the United States, the Department of Energy’s Grid Resilience and Innovation Partnerships program totals $10.5 billion, while the October 2024 funding round announced approximately $4.2 billion for grid protection, capacity and resilience initiatives; these programs materially lower the financing barrier for automated fault isolation and service restoration investments.
The commercial effect is a migration from periodic, labour-intensive patrol-and-repair operations to fault-location, isolation and service-restoration workflows that can restore unaffected feeder sections without waiting for truck rolls. Suppliers therefore gain a larger recurring software, maintenance and communications revenue pool alongside switchgear sales.
Europe reinforces the same thesis: the European Investment Bank committed €11 billion in energy-grid financing in 2025, almost three times its 2023 level, with digitalisation, automation and cybersecurity explicitly tied to grid capacity and resilience. This driver should disproportionately benefit vendors able to package hardware, SCADA/ADMS integration, protection studies and long-term lifecycle support rather than sell isolated field devices.
Drivers Impact Analysis
| Driver | (~) % Impact on CAGR | Geographic Relevance | Impact Timeline |
|---|---|---|---|
| Grid-resilience capex and outage automation | +2.3 pp | North America core, EU, Japan, Australia | Short term (≤2 years) |
| DER, storage and VPP orchestration | +2.0 pp | EU, California/Texas, Australia, China, India | Medium term (2–4 years) |
| AI data centres and electrified-load growth | +1.8 pp | US, Canada, Nordics, India, Gulf, APAC hubs | Short term (≤2 years) |
| Smart-meter-to-ADMS digital stack expansion | +1.6 pp | India, China, Southeast Asia, Latin America | Medium term (2–4 years) |
| Performance-based regulation and grid funding | +1.5 pp | US, EU, India, UK, Australia | Short term (≤2 years) |
| OT cybersecurity and interoperable edge control | +1.1 pp | North America, EU, Japan, South Korea, GCC | Long term (≥4 years) |
Restraint Analysis
Transformer and switchgear shortages
U.S. distribution-transformer lead times reportedly improved to roughly 30 weeks by the second quarter of 2025 after approaching two years in 2024, yet large power transformers still averaged about 128 weeks and generator step-up transformers approximately 144 weeks, keeping upstream substation expansion on a two-to-three-year critical path. In Europe, large-power-transformer lead times have been cited at 48–60 months for some orders, while specialised equipment procurement can extend to 36–48 months.
The market consequence is not simply deferred hardware revenue: utilities sequence scarce equipment toward capacity-critical connections and replacement emergencies, which crowds out discretionary feeder-automation upgrades; vendors then carry longer working-capital cycles, reserve manufacturing slots years in advance and face cancellation or scope-change risk if a utility’s network plan changes before delivery.
This restraint is estimated to remove 2.4 percentage points from baseline CAGR through 2028, particularly where automation installations depend on new substations, high-voltage interfaces or integrated switchgear packages rather than retrofit-ready field devices.
Restraint Impact Analysis
| Restraint | (~) % Impact on CAGR | Geographic Relevance | Impact Timeline |
|---|---|---|---|
| Transformer and switchgear shortages | -2.4 pp | North America core, EU, India, APAC | Medium term (2–4 years) |
| Tariffs and input-cost volatility | -1.7 pp | US, Canada, Mexico, EU import markets | Short term (≤2 years) |
| Permitting and utility procurement drag | -1.6 pp | EU, US states, India, Latin America | Medium term (2–4 years) |
| Legacy-system integration risk | -1.5 pp | North America, EU, Japan, Australia | Medium term (2–4 years) |
| Skilled-labour and OT talent gap | -1.2 pp | North America, EU, Australia, GCC | Long term (≥4 years) |
| Utility balance-sheet constraints | -1.0 pp | India, Latin America, Africa, US co-ops | Short term (≤2 years) |
Opportunity Analysis
Flexibility-market orchestration
In the United States, FERC Order 2222 allows distributed-energy-resource aggregations to participate in wholesale energy, capacity and ancillary-service markets, with minimum aggregation thresholds capped at 100 kW, yet distribution-system coordination, market-grade telemetry and local operating rules remain unevenly implemented. The white space is therefore an independent software layer that combines DERMS controls, feeder constraints, customer enrolment, settlement, forecasting and utility dispatch permissions; an operator controlling 100 MW of flexible load can earn revenue from avoided peak capacity, congestion management and ancillary services without owning generation assets.
In Europe, four emerging flexibility routes—rules-based participation, network tariffs, flexible connection agreements and market-based procurement—create multiple go-to-market channels beyond a traditional utility capital budget. Vendors that shift from a one-time $500–$2,000 per-device automation value chain into a recurring platform fee plus 5–15% share of verified flexibility proceeds could raise revenue per connected endpoint several-fold, justifying a potential 2.2-percentage-point CAGR upside if they establish utility and aggregator partnerships before local flexibility markets standardise.
Opportunity Impact Analysis
| Opportunity | (~) % Potential CAGR | Geographic Relevance | Execution Window |
|---|---|---|---|
| Flexibility-market orchestration | +2.2 pp | US RTOs, EU, Australia, Japan | Medium term (2–4 years) |
| Grid digital twins as SaaS | +1.9 pp | EU, North America, GCC, APAC | Medium term (2–4 years) |
| Resilience microgrid platforms | +1.7 pp | US, Canada, Australia, islands, India | Short term (≤2 years) |
| AMI-data monetisation stack | +1.6 pp | India, Southeast Asia, Latin America, Africa | Medium term (2–4 years) |
| Wildfire-risk automation | +1.3 pp | Western US, Canada, Australia, Southern EU | Short term (≤2 years) |
| Utility software M&A roll-ups | +1.1 pp | North America, EU, Japan, India | Long term (≥4 years) |
Challenges Analysis
Multi-vendor data interoperability
Distribution automation must function across layered technology estates—IEC 61850 for substation systems, IEEE 2030.5 for customer-side DER and EV communications, DNP3 and IEC 60870 variants for legacy telemetry, proprietary AMI head ends, GIS, SCADA, outage management, ADMS and cloud APIs—so the challenge is not absence of standards but costly semantic mapping, version control and operational validation between standards that were designed for different grid domains.
IEC 61850 and IEEE 2030.5 are recognised foundational interoperability references, yet utilities still face protocol proliferation, regional mandates and repeated software requalification as standards evolve. In a typical multi-vendor automation programme, 15–30% of systems-integration effort can be absorbed by interface engineering, data-tag normalisation, point-to-point testing and exception handling; a 10,000-device rollout can therefore generate hundreds of device templates, firmware combinations and data-quality rules.
The ongoing penalty is delayed commissioning and lower software gross margin when vendors carry bespoke connectors, while utilities face operational risk if control commands map incorrectly across device types; mitigation requires an open canonical data model, conformance-testing labs, reusable integration adapters, contractually enforced interface specifications and product roadmaps aligned with both feeder-edge and substation protocols, supporting the estimated 1.4-percentage-point friction drag through the medium term.
Challenges Impact Analysis
| Challenge | (~) % CAGR Friction Drag | Geographic Relevance | Mitigation Horizon |
|---|---|---|---|
| Multi-vendor data interoperability | -1.4 pp | North America, EU, Japan, Australia | Medium term (2–4 years) |
| Cyber-physical attack surface | -1.3 pp | North America, EU, Korea, GCC | Long term (≥4 years) |
| Grid-model data degradation | -1.2 pp | North America, EU, APAC mature grids | Medium term (2–4 years) |
| Engineering talent pipeline | -1.1 pp | North America, EU, Australia, India | Long term (≥4 years) |
| Capacity-planning forecast volatility | -1.0 pp | US, Canada, EU, India, APAC hubs | Medium term (2–4 years) |
| Component qualification complexity | -0.8 pp | North America, EU, India, APAC | Medium term (2–4 years) |
Geopolitical Impact Analysis
Geopolitical Impact of the Russia–Ukraine War on Distribution Automation
The ongoing Russia Ukraine war is increasing the strategic importance of distribution automation as utilities focus more strongly on grid resilience, decentralisation and faster outage recovery. Repeated attacks on substations, transmission assets and generation facilities have shown how vulnerable conventional power networks can be during conflict.
The Council of the European Union reports that around 50% of Ukraine’s energy infrastructure has been destroyed, with 24.5 GW of generation capacity lost, equal to roughly 70% of its pre-war capacity. These disruptions are encouraging greater use of automated switching, remote monitoring, fault isolation, distributed energy resources and digital control systems that can keep local networks operating when central infrastructure is damaged.
The war is also affecting equipment availability and procurement strategies. Utilities are placing greater attention on secure supplies of transformers, sensors, communication hardware and grid-control electronics. In 2026, the U.S. Department of Energy continued to identify distribution transformers as a critical grid supply-chain constraint, citing long lead times and component shortages.
Regional Insights
Asia Pacific Leads the Distribution Automation Market with a 43.20% Share, Valued at USD 8.67 Billion
In 2025, Asia Pacific held a dominant market position, capturing more than a 43.20% share and generating about USD 8.67 billion. The region benefits from rising electricity use, renewable integration, urban expansion, and modernization of distribution networks. China’s net electricity demand exceeded 9,500 TWh in 2025, increasing 5.1% year over year. The IEA expects China’s electricity demand growth to accelerate to 5.5% in 2026.
North America is expected to remain the fastest-growing regional market as utilities invest in reliability, capacity expansion, and digital grid control. In March 2026, the U.S. Department of Energy announced approximately USD 1.9 billion for critical power-grid upgrades through its SPARK funding opportunity. Electricity demand in the United States is expected to grow at close to 2% in 2026.
Key Regions and Countries Insights
- North America
- US
- Canada
- Europe
- Germany
- France
- The UK
- Spain
- Italy
- Rest of Europe
- Asia Pacific
- China
- Japan
- South Korea
- India
- Australia
- Rest of APAC
- Latin America
- Brazil
- Mexico
- Rest of Latin America
- Middle East & Africa
- GCC
- South Africa
- Rest of MEA
Key Players Analysis
ABB Ltd. maintains a strong position in distribution automation through its electrification, digital control, protection and grid-management technologies. In 2025, ABB generated USD 33.2 billion in revenue, while total orders reached USD 36.8 billion. The company invested USD 1.318 billion in research and development, supporting new automation, sensing and digital-energy solutions. Its portfolio of intelligent switchgear, protection devices and distribution-control technologies helps utilities improve grid reliability, fault response and renewable-energy integration.
Schneider Electric SE strengthens its distribution automation business through EcoStruxure, grid-control software, intelligent switchgear and energy-management systems. In 2025, the company recorded EUR 40.2 billion in revenue, representing 8.9% organic growth. Its Energy Management business generated EUR 7.235 billion in adjusted EBITA with a 21.8% margin. Growing demand for digital power distribution, connected devices and automated network management supports Schneider Electric’s role in helping utilities build more flexible, efficient and resilient distribution grids.
Top Key Players Outlook
- ABB Ltd.
- Schneider Electric SE
- Siemens AG
- Eaton Corporation plc
- GE Vernova Inc.
- Hitachi Energy Ltd.
- Schweitzer Engineering Laboratories, Inc.
- S&C Electric Company
- G&W Electric Company
- Itron, Inc.
- Landis+Gyr Group AG
- Toshiba Energy Systems & Solutions Corporation
- Mitsubishi Electric Corporation
- Hubbell Incorporated
- Cisco Systems, Inc.
Recent Developments
- February 2026, GE Vernova completed its USD 5.275 billion acquisition of the remaining 50% of Prolec GE, expanding its transformer and grid-equipment capabilities.
- In August 2026, Hitachi Energy added another USD 300 million investment in China to increase transformer and component manufacturing capacity.
Report Scope
| Report Features | Description |
|---|---|
| Market Value (2025) | USD 20.1 Bn |
| Forecast Revenue (2035) | USD 61.3 Bn |
| CAGR (2026-2035) | 11.9% |
| Base Year for Estimation | 2025 |
| Historic Period | 2020-2024 |
| Forecast Period | 2026-2035 |
| Report Coverage | Revenue Forecast, Market Dynamics, Competitive Landscape, Recent Developments |
| Segments Covered | By Offering (Field Devices, Software, Services), By Communication Technology (Wired, Wireless), By Application ( Feeder Automation, Load & Voltage Management, Asset Monitoring, Others), By Utility Type (Public Utilities, Private Utilities) |
| Regional Analysis | North America – US, Canada; Europe – Germany, France, The UK, Spain, Italy, Rest of Europe; Asia Pacific – China, Japan, South Korea, India, Australia, Singapore, Rest of APAC; Latin America – Brazil, Mexico, Rest of Latin America; Middle East & Africa – GCC, South Africa, Rest of MEA |
| Competitive Landscape | ABB Ltd., Schneider Electric SE, Siemens AG, Eaton Corporation plc, GE Vernova Inc., Hitachi Energy Ltd., Schweitzer Engineering Laboratories, Inc., S&C Electric Company, G&W Electric Company, Itron, Inc., Landis+Gyr Group AG, Toshiba Energy Systems & Solutions Corporation, Mitsubishi Electric Corporation, Hubbell Incorporated, Cisco Systems, Inc. |
| Customization Scope | Customization for segments, region/country-level will be provided. Moreover, additional customization can be done based on the requirements. |
| Purchase Options | We have three licenses to opt for: Single User License, Multi-User License (Up to 5 Users), Corporate Use License (Unlimited User and Printable PDF) |





































