


Report Overview
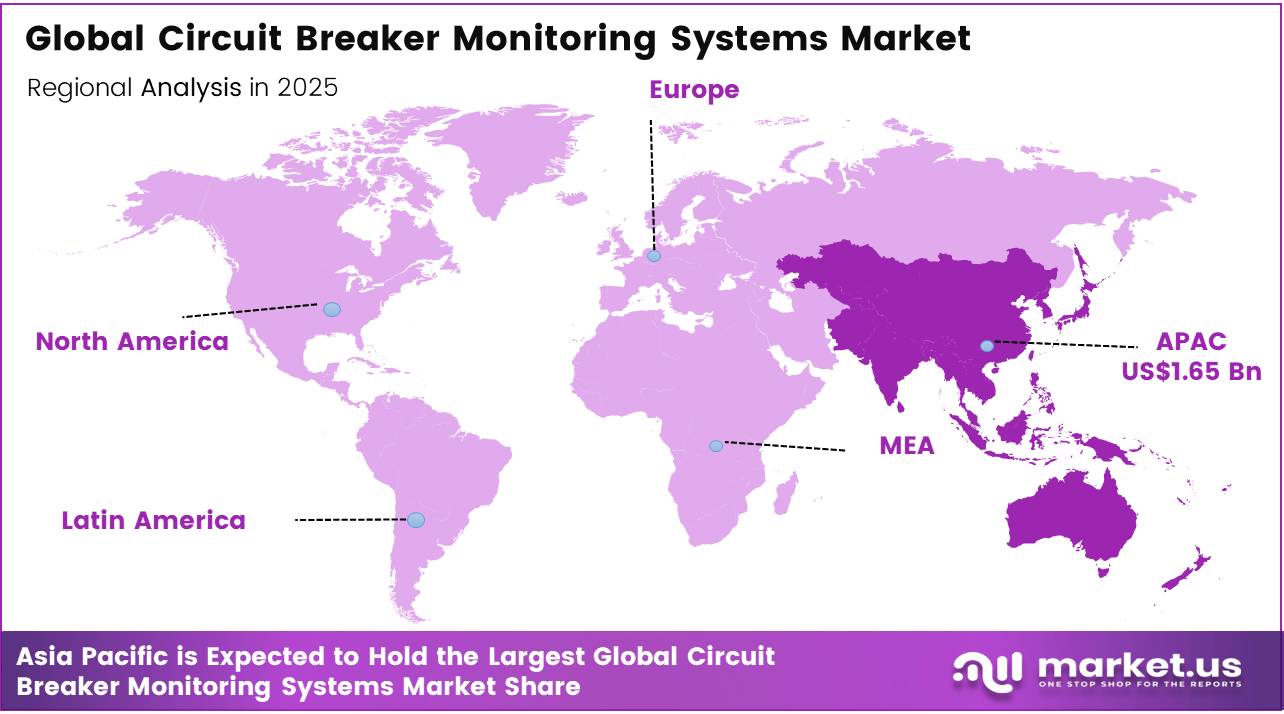
In 2025, the Global Circuit Breaker Monitoring Systems Market was valued at USD 4.5 billion, and between 2026 and 2035, this market is estimated to register a CAGR of 9.5%, reaching about USD 11.2 billion by 2035. In 2025, Asia Pacific held a dominant market position, capturing more than a 36.4% share, holding USD 1.65 Billion revenue
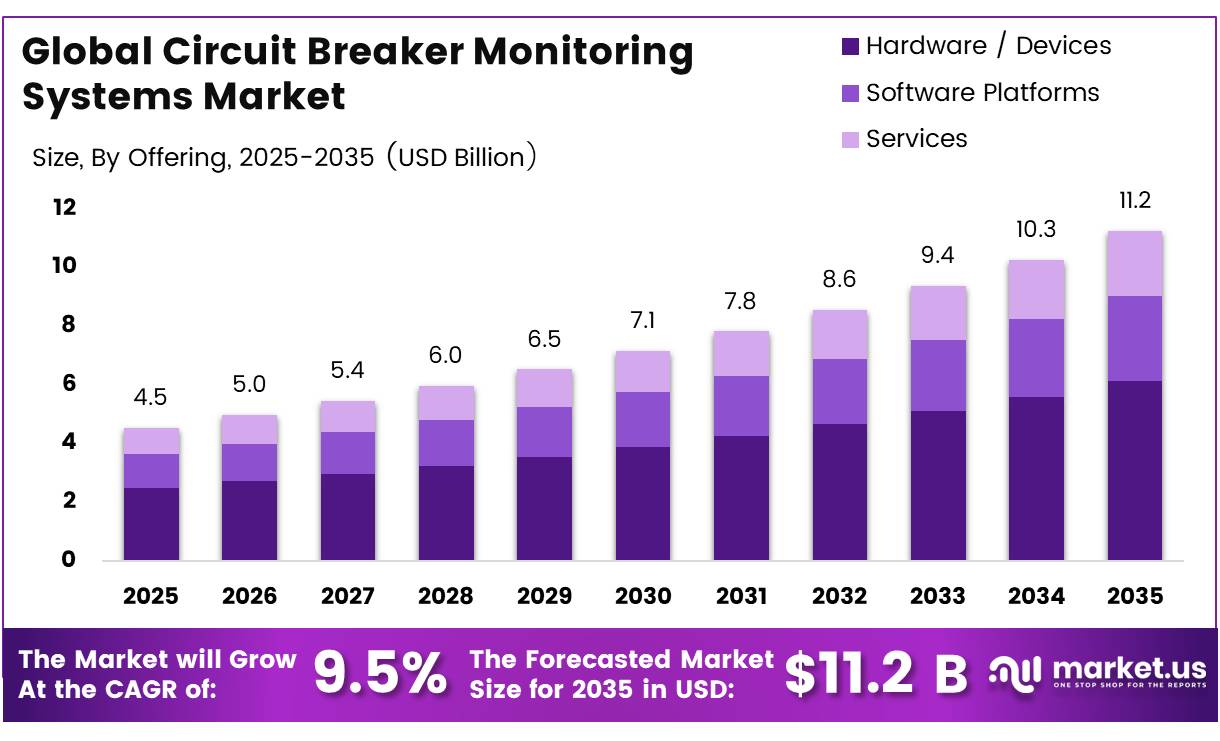
Circuit breaker monitoring systems are becoming part of digital substations because they track contact wear, operating time, coil current, gas pressure, temperature, and mechanical condition. The industrial scenario is strengthening as utilities modernize aging networks and add renewable generation. The International Energy Agency reported that global grid spending reached about USD 400 billion in 2025, while electricity-sector investment approached USD 1.5 trillion, creating an equipment-upgrade base.
Industrial demand is reinforced by outage exposure and aging switching assets. In 2024, U.S. customers experienced an average of 662.6 interruption minutes, 1.531 interruptions, and 432.7 minutes per interruption when major events were included. Continuous monitoring helps utilities identify slow operation, contact wear, coil abnormalities, and insulation deterioration before failures occur.
- IRENA reported that global renewable capacity reached 4,448 GW in 2024 after adding 585 GW, equal to 5% of worldwide power-capacity expansion. Higher variable generation increases switching frequency and requires visibility across breakers, substations, and feeder networks.
Future opportunities will develop through retrofit sensors, digital twins, predictive analytics, and remote maintenance. More than 2,500 GW of generation, storage, and large-load projects remain in global grid queues. Europe also requires EUR 730 billion for distribution and EUR 477 billion for transmission networks by 2040.
Key Takeaways
- The global Circuit Breaker Monitoring Systems market was valued at USD 4.5 billion in 2025.
- The global market is projected to grow at a CAGR of 9.5% and is estimated to reach USD 11.2 billion by 2035.
- On the basis of Monitoring Mode, the Online (Continuous) Monitoring Systems dominated the market, constituting 56.6% of the total market share.
- Based on the offering, the Hardware / Devices dominated the Circuit Breaker Monitoring Systems market, with a substantial market share of around 54.4%.
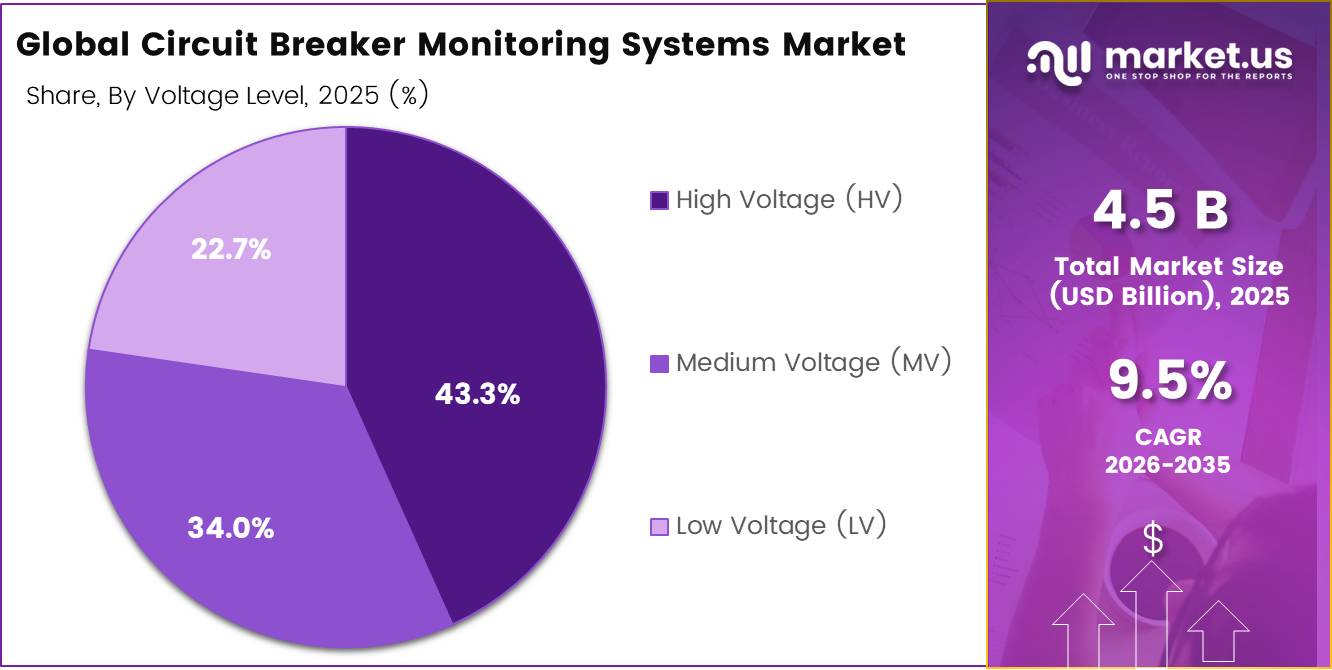
- Based on the Voltage Level, High Voltage (HV) led the market, comprising 43.3% of the total market.
- Among the Application, the Electric Power Transmission held a major share in the Circuit Breaker Monitoring Systems market, 37.6% of the market share.
- Among the end user, the Utilities is the most considerable within the market, accounting for around 64.3% of the revenue.
- In 2025, the Asia Pacific was the most dominant region in the Circuit Breaker Monitoring Systems market, accounting for 36.4% of the total global consumption
Monitoring Mode Analysis
Online (Continuous) Monitoring Systems represents dominant Segment in the Market.
Online continuous monitoring systems held the leading position, capturing a 56.6% market share. Their dominance is supported by the need to track breaker timing, coil current, contact condition, temperature, and insulation performance without interrupting electricity supply.
- The U.S. Energy Information Administration reported that customers experienced an average of 11 hours of power interruptions, with major events responsible for 80% of total outage duration. Continuous monitoring helps utilities detect developing faults early, schedule maintenance more effectively, and reduce the risk of unexpected breaker failure.
Hybrid monitoring systems are emerging as the fastest-growing segment because they combine continuous sensor data with scheduled diagnostic testing. This approach is suitable for utilities upgrading older substations without replacing complete breaker fleets. A U.S. Department of Energy grid-modernization project includes 84 electric reclosers across 13 substations and 28 distribution circuits, reflecting increasing investment in combined monitoring and control infrastructure.
Offering Analysis
Hardware/devices a significant Offering.
Hardware/devices held the leading position in the circuit breaker monitoring systems market, accounting for 54.4% of the total share. Utilities continue to invest in sensors, communication modules, trip-coil monitors, temperature detectors, and intelligent electronic devices that provide real-time information on breaker health.
- In March 2026, the U.S. Department of Energy announced approximately USD 1.9 billion for rapid transmission infrastructure and advanced technology upgrades, strengthening the deployment environment for physical monitoring equipment across substations.
Software platforms are emerging as the fastest-growing offering as utilities seek to combine field-device data into centralized dashboards, predictive-maintenance tools, and remote diagnostic systems. The U.S. Department of Energy’s Smart Grid Grants program provides up to USD 3 billion, including USD 600 million annually through fiscal year 2026, for technologies such as grid sensors, control devices, and software. This support is encouraging utilities to adopt platforms that identify abnormal breaker behaviour and improve maintenance planning.
Voltage Level Analysis
High Voltage Monitoring Are the Most Widely Used Voltage Level.
High-voltage monitoring systems held the leading position, accounting for a 43.3% market share. Their dominance reflects the importance of continuously tracking breaker timing, contact wear, insulation condition, operating mechanisms, and control circuits across transmission substations.
- FERC states that the ERCOT network alone includes more than 46,000 miles of transmission lines connected to approximately 550 generating units, highlighting the scale of equipment requiring reliable protection and condition monitoring. High-voltage breakers also carry greater operational risk because a single failure can interrupt large power flows and affect multiple network areas.
Medium-voltage monitoring is the fastest-growing segment as utilities automate distribution substations, industrial feeders, campuses, and renewable-energy connections. One U.S. Department of Energy-supported campus project includes 5 automatic transfer switches, 45 protective-relay upgrades, and 1 new duct bank. Such projects create demand for affordable sensors, remote breaker diagnostics, fault alerts, and monitoring platforms that can be added to existing distribution infrastructure without complete equipment replacement.
Application Analysis
Electric Power Transmission Held a Major Share of the Circuit Breaker Monitoring Systems Market.
Electric power transmission held the leading position, capturing a 37.6% market share. Transmission networks depend on high-voltage circuit breakers to isolate faults and protect transformers, lines, and substations carrying large power volumes.
- The U.S. Department of Energy plans to expand long-distance transmission capacity by 16% by 2030, including the construction of 7,500 miles of new lines.
Renewable energy plants and substations are emerging as the fastest-growing application as variable generation requires frequent switching and closer equipment supervision. The U.S. Energy Information Administration reported that developers planned 86 GW of new generating capacity for 2026, including 43.4 GW of solar and 24 GW of battery storage. These additions create opportunities for monitoring systems that improve breaker reliability across renewable interconnections and energy-storage substations
End-user Analysis
Circuit Breaker Monitoring Systems Are Mostly Utilized in the Utilities.
Utilities held the leading position, capturing a 64.3% market share, because they operate large transmission and distribution networks where circuit breaker failures can affect thousands of customers.
The U.S. Energy Information Administration recorded approximately 164.5 million electricity customers and total power-sector generation of about 4,260 billion kilowatthours. This operating scale encourages utilities to adopt continuous condition monitoring, remote alarms, predictive maintenance, and centralized asset-management systems that improve breaker availability and reduce unplanned field inspections.
Renewable energy developers and independent power producers are the fastest-growing end users as new solar and wind facilities require reliable switching at grid-interconnection substations. Government data show that wind and utility-scale solar supplied 17% of U.S. electricity, generating 760,000 gigawatthours, while utility-scale solar output increased by 34%. This expansion supports monitoring systems that track breaker operation under fluctuating power flows and frequent switching conditions.
Key Market Segments
By Monitoring Mode
- Online (Continuous) Monitoring Systems
- Hybrid Monitoring Systems
- Diagnostic / Event-Based Monitoring Systems
- Portable
By Offering
- Hardware / Devices
- Software Platforms
- Services
By Voltage Level
- High Voltage (HV)
- Medium Voltage (MV)
- Low Voltage (LV)
By Application
- Electric Power Transmission
- Electric Power Distribution
- Industrial Facilities and Process Plants
- Renewable Energy Plants and Substations
By End-user
- Utilities
- Industrial Manufacturing and Process Industries
- Renewable Energy Developers and IPPs
- Data Centers and Railways
Driver Analysis
Grid digitalization mandates and IEC 61850-based substation upgrades
The strongest structural driver in 2026 is the migration from isolated breaker diagnostics to interoperable, substation-wide digital condition architectures. In Europe, the Commission’s grid agenda explicitly frames networks as needing to become more digitalised, decentralised, and flexible, while EU electricity consumption is expected to rise by about 60% by 2030, which increases the commercial case for utility spending on intelligent primary equipment and real-time asset visibility.
In parallel, IEC 61850 has become the preferred interoperability layer for multi-vendor IEDs and monitoring devices, reducing custom integration cost and making breaker-monitoring nodes easier to standardize across bay, feeder, and substation retrofits.
Drivers Impact Analysis
| Driver | (~) % Impact on CAGR | Geographic Relevance | Impact Timeline |
|---|---|---|---|
| Grid digitalization mandates and IEC 61850-based substation upgrades | +2.1% | North America core, EU, China, India, GCC utilities | Medium term (2-4 years) |
| Renewable integration, congestion visibility, and curtailment reduction needs | +1.8% | EU, India, North America, Australia, LATAM spill-over | Short term (≤ 2 years) |
| Asset-life extension under capex pressure and outage-cost avoidance | +1.6% | North America core, EU, Japan, mature APAC utilities | Short term (≤ 2 years) |
| Cybersecure remote monitoring and compliance-led OT modernization | +1.3% | U.S. bulk power system, EU, UK, high-voltage utility corridors | Short term (≤ 2 years) |
| SF6 phase-down and replacement of aging switchgear fleets | +1.2% | EU core, UK alignment markets, advanced APAC adopters | Medium term (2-4 years) |
| Distribution modernization and feeder-level intelligence expansion | +1.5% | India core, Southeast Asia, Middle East, Africa, LATAM | Medium term (2-4 years) |
Restraint Analysis
Utility capex crowd-out
The third restraint is capital crowd-out: utilities broadly support digital monitoring, but in 2026 much of their available spend is being absorbed by grid expansion, transformer replacement, interconnection upgrades, and resilience hardening before condition-monitoring layers are funded. U.S. utility capex alone is tracking near $259.1 billion in 2026 after roughly $200 billion in 2025, a jump of about 29%, while wildfire mitigation programs are absorbing hundreds of millions at the utility level and hardening costs can run roughly $1.05 million per mile for traditional system hardening, $1.21 million for covered conductor, and $2.66 million for strategic undergrounding.
That capex mix matters because breaker monitoring usually competes poorly against mandatory reliability or fire-risk projects in rate cases and internal portfolio ranking, so even where the ROI is positive, monitoring is often shifted into later phases, bundled only into new builds, or stripped from substation scopes to protect headline project budgets, which lowers near-term attach rates and elongates procurement cycles.
Restraint Impact Analysis
| Restraint | (~) % Impact on CAGR | Geographic Relevance | Impact Timeline |
|---|---|---|---|
| Switchgear backlog | -2.0% | North America core, EU, APAC industrial corridors | Short term (≤ 2 years) |
| Metals inflation and tariffs | -1.5% | U.S. core, North America supply chain, import-reliant markets | Short term (≤ 2 years) |
| Utility capex crowd-out | -1.3% | North America core, EU wildfire belts, selected APAC utilities | Medium term (2-4 years) |
| Cyber compliance burden | -1.0% | U.S. bulk power, EU, UK | Short term (≤ 2 years) |
| Skilled labor shortage | -1.2% | EU, North America core, advanced APAC utilities | Medium term (2-4 years) |
| SF6 transition friction | -0.9% | EU core, UK alignment markets | Medium term (2-4 years) |
Opportunity Analysis
Monitoring-as-a-service
This is an opportunity rather than a current driver because most breaker monitoring still monetizes as capex hardware plus commissioning, whereas the white space is the conversion of installed-base diagnostics into recurring service contracts with uptime guarantees, analytics subscriptions, and outsourced fleet triage; substation digitalization is scaling in 2026 and AI-based predictive analytics is moving from pilot to control-room relevance, but many utilities still lack the internal data science or maintenance-process maturity to operationalize continuous breaker data at fleet level, creating room for vendors to shift from one-time gross margins of roughly 25%–35% on hardware-heavy projects toward blended software-service margins that can exceed 55%–65% once installed base density crosses a few thousand monitored bays.
The economic upside comes from lowering customer adoption friction through monthly or annual service pricing, cutting upfront utility approval hurdles by 20%–40% versus full capex requests, improving renewal visibility, and expanding lifetime revenue per site by 1.7x–2.4x through alarm management, condition scoring, digital twins, and maintenance recommendation layers that utilities increasingly want but have not yet widely budgeted as standalone programs.
Opportunity Impact Analysis
| Opportunity | (~) % Potential CAGR | Geographic Relevance | Execution Window |
|---|---|---|---|
| Monitoring-as-a-service | +2.0% | North America core, EU, advanced APAC utilities | Short term (≤ 2 years) |
| DERMS and VPP integration | +1.7% | U.S., EU, Australia, India urban grids | Medium term (2-4 years) |
| Data-center substation niche | +1.5% | U.S. core, Nordics, Ireland, Middle East hubs | Short term (≤ 2 years) |
| RDSS secondary grid scale-up | +1.8% | India core, South Asia, Africa follow-on markets | Medium term (2-4 years) |
| SF6-free retrofit aftermarket | +1.3% | EU core, UK alignment markets, Japan selective utilities | Medium term (2-4 years) |
| Cyber-hardened remote service stack | +1.4% | U.S. bulk power, Canada, UK, EU | Short term (≤ 2 years) |
Challenges Analysis
Legacy integration complexity
The deepest ongoing challenge is that circuit breaker monitoring systems rarely enter greenfield environments; they are usually inserted into substations where IEC 61850, DNP3, IEC 60870-5-104, proprietary relay logic, and aging RTU layers coexist, forcing vendors to spend disproportionate engineering time on protocol mapping, naming normalization, gateway behavior, and interoperability testing rather than on scalable product deployment.
IEC 61850 was designed to reduce lifecycle engineering burden and trip-critical messaging can operate in under 4 milliseconds, yet field modernization still proceeds bay by bay because utilities cannot rebuild entire substations offline, which means most projects require staged coexistence between new IEDs and legacy infrastructure, repeated FAT/SAT cycles, and manual validation of multi-vendor data models before energization.
The operational penalty is not an outright sales block but a chronic cost-to-serve problem: custom integration can consume 15%–30% of project labor hours, stretch implementation timelines by 3–9 months, and reduce repeatability across fleets, forcing vendors to maintain larger applications-engineering teams and limiting how fast revenue can scale even when demand remains intact.
Challenges Impact Analysis
| Challenge | (~) % CAGR Friction Drag | Geographic Relevance | Mitigation Horizon |
|---|---|---|---|
| Legacy integration complexity | -1.4% | North America core, EU, India, APAC utility fleets | Medium term (2-4 years) |
| Commissioning window congestion | -1.1% | North America core, India, EU transmission corridors | Short term (≤ 2 years) |
| Specialist talent scarcity | -1.3% | EU, North America core, advanced APAC utilities | Long term (≥ 4 years) |
| Cyber architecture escalation | -1.0% | U.S. bulk power, EU regulatory hubs, UK | Medium term (2-4 years) |
| Data quality immaturity | -0.9% | Global utilities, emerging APAC, LATAM spill-over | Medium term (2-4 years) |
| Technology transition overlap | -0.8% | EU core, North America, selective APAC adopters | Medium term (2-4 years) |
Geopolitical Impact Analysis
Geopolitical Trade Controls and Semiconductor Dependence Reshaping Grid Monitoring.
Geopolitical tensions are reshaping the circuit breaker monitoring systems industry by disrupting access to semiconductors, communication modules, sensors, and electrical components used in digital substations. The U.S. Department of Commerce has imposed export controls on more than 2,800 product categories linked to Russia, including electrical equipment and microelectronics. Separately, the U.S. tariff on selected Chinese semiconductors increased from 25% to 50% in 2025. These measures can raise component costs, lengthen qualification cycles, and push utilities toward approved regional suppliers, standardized hardware, and locally supported monitoring platforms.
Supply security is therefore becoming as important as technical performance. U.S. government data show that the national share of global semiconductor wafer fabrication declined from 37% in 1990 to less than 10% in 2024, highlighting dependence on overseas production. In response, monitoring-system suppliers are likely to redesign products around interchangeable chips, multi-vendor sourcing, and cybersecurity-tested software. Utilities may also favor retrofit devices with longer service lives, remote diagnostics, and replaceable modules, reducing exposure to sanctions, shipping interruptions, and politically sensitive technology supply chains globally.
Geopolitical uncertainty is also changing procurement behaviour across the sector. Utilities are placing greater value on supplier transparency, local technical support, cybersecurity compliance, and long-term spare-part availability. This shift favours monitoring solutions built on open communication standards and modular designs, as operators seek to avoid dependence on a single country, vendor, or proprietary technology platform.
Regional Analysis
Asia Pacific Held the Largest Share of the Global Circuit Breaker Monitoring Systems Market.
Asia Pacific held the leading position in the circuit breaker monitoring systems market, capturing a 36.4% share. Large-scale renewable additions and grid expansion are increasing the number of breakers requiring continuous supervision. China’s installed renewable capacity exceeded 2,337 GW in 2025, while renewables represented 82.7% of newly installed power capacity. This rapid buildout supports demand for sensors, operating-time analysis, insulation monitoring, and remote maintenance across substations.
North America is emerging as the fastest-growing regional market as utilities modernize aging grids and connect new generation assets. The U.S. Energy Information Administration expected 63 GW of utility-scale generating capacity additions in 2025, nearly 30% higher than the previous year. Solar and battery storage represented 81% of the planned additions, creating stronger requirements for reliable switching and real-time equipment diagnostics. The U.S. Department of Energy also announced nearly USD 18.4 million for advanced grid technologies, including lower-cost high-voltage direct-current circuit breakers and failure-prevention systems.
Key Regions and Countries Covered
- North America
- The US
- Canada
- Europe
- Germany
- France
- The UK
- Spain
- Italy
- Russia & CIS
- Rest of Europe
- APAC
- China
- Japan
- South Korea
- India
- ASEAN
- Rest of APAC
- Latin America
- Brazil
- Mexico
- Rest of Latin America
- Middle East & Africa
- GCC
- South Africa
- Rest of MEA
Key Players Analysis
Circuit Breaker Monitoring Systems manufacturers focus on strengthening technological differentiation, system reliability, and digital integration to remain competitive. A key priority is continuous innovation in sensors, communication modules, and diagnostic software that can track operating time, contact wear, coil current, temperature, gas pressure, and insulation condition with greater accuracy.
Integration with substation automation systems, asset management software, and cloud-based monitoring platforms improves data visibility and supports faster maintenance decisions. Strategic expansion into transmission, distribution, renewable energy, and industrial facilities enables suppliers to address growing demand for reliable switching equipment across modern power networks.
Additionally, manufacturers emphasize cybersecurity, interoperability, modular hardware design, and compliance with international grid standards to ensure dependable operation across different breaker types. Long-term partnerships with utilities, equipment manufacturers, and engineering contractors further support product customization, service continuity, and stronger positioning in high-value grid modernization projects.
The Major Players In The Industry
- ABB Ltd.
- Siemens
- Schneider Electric SE
- Hitachi Energy Ltd.
- GE Vernova
- Eaton Corporation plc
- Mitsubishi Electric Corporation
- Toshiba Energy Systems & Solutions Corporation
- Hyundai Electric & Energy Systems
- NR Electric Co., Ltd.
- Qualitrol Corporation
- Schweitzer Engineering Laboratories (SEL)
- Megger Group Limited
- OMICRON electronics GmbH
- Dynamic Ratings Pty Ltd.
Key Development
- In August 2025, Schneider Electric launched FeederSeT, a digitally connected circuit-protection range with asset-health monitoring, backed by a £42 million manufacturing facility in Scarborough. The system supports scalable monitoring and improved reliability across electrical distribution networks.
- In November 2025, ABB unveiled SACE Emax 3 in Canada, offering fault detection below 40 milliseconds, transmission of more than 3,000 grid parameters, eight communication protocols, and continuous temperature monitoring for predictive breaker maintenance.
Report Scope
| Report Features | Description |
|---|---|
| Market Value (2025) | USD 4.5 Bn |
| Forecast Revenue (2035) | USD 11.2 Bn |
| CAGR (2026-2035) | 9.5% |
| Base Year for Estimation | 2025 |
| Historic Period | 2020-2024 |
| Forecast Period | 2026-2035 |
| Report Coverage | Revenue Forecast, Market Dynamics, Competitive Landscape, Recent Developments |
| Segments Covered | By Monitoring Mode (Online (Continuous) Monitoring Systems, Hybrid Monitoring Systems , Diagnostic / Event-Based Monitoring Systems and Portable), By Offering (Hardware / Devices, Software Platforms and Services), By Voltage Level (High Voltage (HV), Medium Voltage (MV) and Low Voltage (LV)), By Application (Electric Power Transmission, Electric Power Distribution, Industrial Facilities and Process Plants and Renewable Energy Plants and Substations), By End-user (Utilities, Industrial Manufacturing and Process Industries, Renewable Energy Developers and IPPs and Data Centers and Railways) |
| Regional Analysis | North America – The US & Canada; Europe – Germany, France, The UK, Spain, Italy, Russia & CIS, Rest of Europe; APAC– China, Japan, South Korea, India, ASEAN & Rest of APAC; Latin America– Brazil, Mexico & Rest of Latin America; Middle East & Africa– GCC, South Africa, & Rest of MEA |
| Competitive Landscape | ABB Ltd., Siemens, Schneider Electric SE, Hitachi Energy Ltd., GE Vernova, Eaton Corporation plc, Mitsubishi Electric Corporation, Toshiba Energy Systems & Solutions Corporation, Hyundai Electric & Energy Systems, NR Electric Co., Ltd., Qualitrol Corporation, Schweitzer Engineering Laboratories (SEL), Megger Group Limited, OMICRON electronics GmbH, Dynamic Ratings Pty Ltd. |
| Customization Scope | Customization for segments, region/country-level will be provided. Moreover, additional customization can be done based on the requirements. |
| Purchase Options | We have three licenses to opt for: Single User License, Multi-User License (Up to 5 Users), Corporate Use License (Unlimited Users and Printable PDF) |





































