


Report Overview
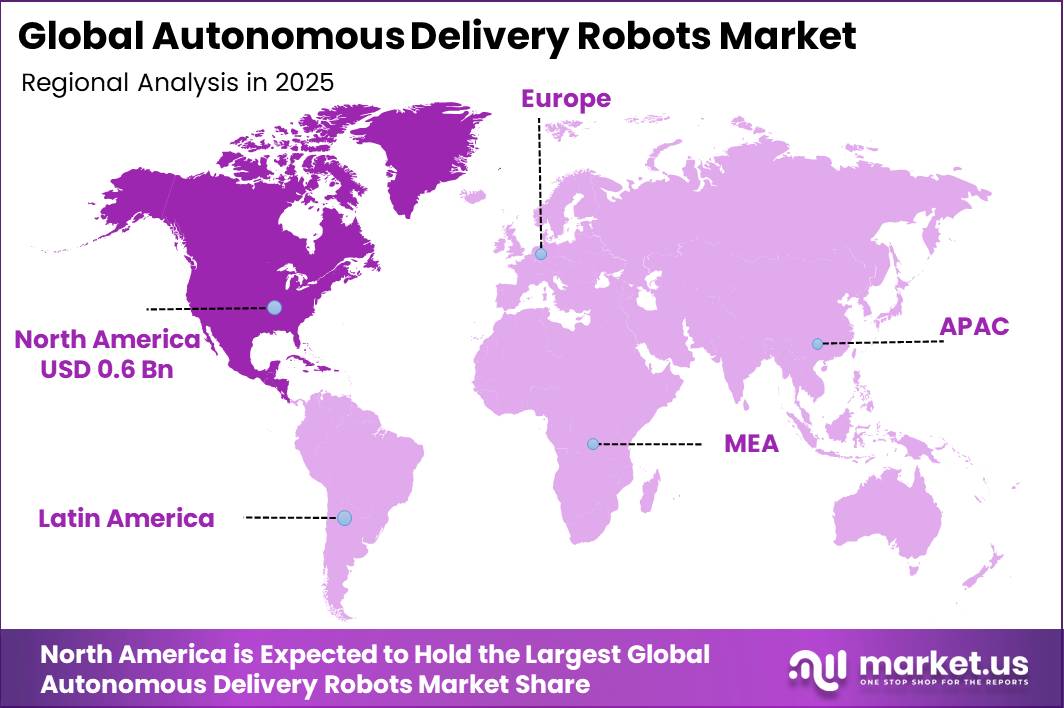
In 2025, the Global Autonomous Delivery Robots Market was valued at USD 1.5 billion. The market is projected to grow at a CAGR of 23.4% during 2026–2035, reaching approximately USD 12.1 billion by 2035. North America dominated the global market in 2025, accounting for more than 39.8% of the total market share and generating approximately USD 0.6 billion in revenue.
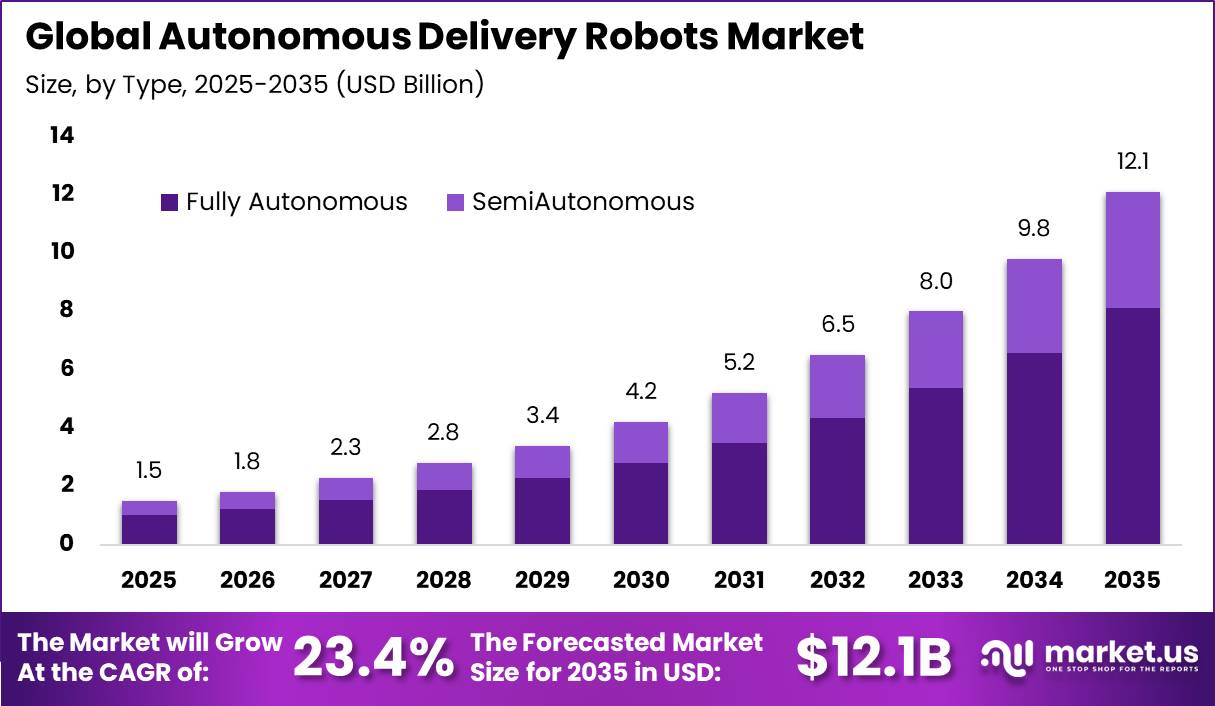
The Autonomous Delivery Robots Market is expected to add nearly USD 10.6 billion over the forecast period, supported by rising e-commerce, grocery, food, pharmacy, and on-demand deliveries. U.S. retail e-commerce sales reached about USD 1.23 trillion in 2025, increasing from USD 300.2 billion in Q1 to around USD 316.1 billion in Q4.
E-commerce accounted for 16.2% of total U.S. retail sales in Q1 2025 and increased to 16.6% in Q4 2025. In Q3 2025, online retail sales grew by 5.3% year-on-year, compared with 4.1% growth in total retail sales. This shift is creating stronger demand for fast delivery of groceries, meals, medicines, convenience products, and small parcels.
U.S. delivery truck driver and driver/sales worker employment is projected to grow by 7% from 2025 to 2035, with around 152,700 job openings annually. In addition, 48.7% of online grocery buyers used home delivery and 49.1% used pickup, supporting demand for autonomous robot fleets, navigation systems, fleet-management software, charging equipment, and maintenance services.
Key Takeaway
- Autonomous Delivery Robots Market was valued at USD 1.5 billion in 2025, projected to reach USD 12.1 billion by 2035 at a 23.4% CAGR.
- The fully autonomous segment held a dominant 67.1% share by type.
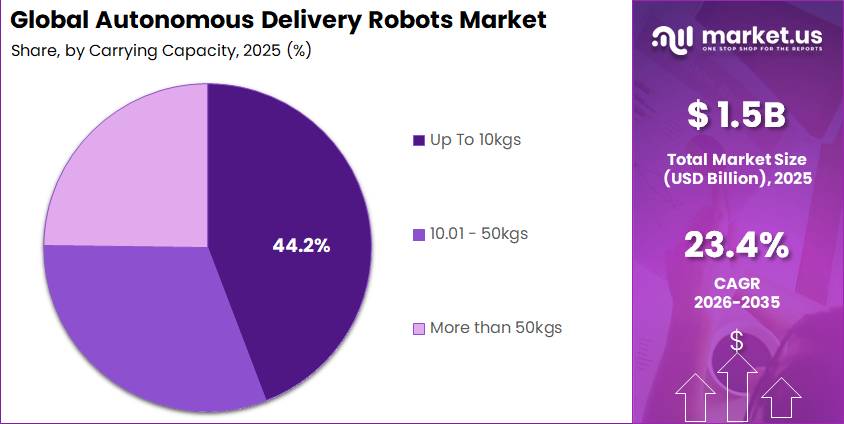
- The up to 10 kg carrying capacity segment led with a 44.2% share.
- The four-wheel segment held the largest share at 45.6%.
- The food and beverages vertical dominated with a 42.1% share.
- North America led the market in 2025 with a 39.8% share and about USD 0.6 billion in revenue.
Market Statistics and Data Insights
- U.S. seasonally adjusted e-commerce sales increased further to USD 340.2 billion in Q2 2026, up 12.2% year-on-year. E-commerce represented 17.1% of total retail sales during the quarter.
- The U.S. Postal Service handled 7.252 billion Shipping and package pieces in FY2024, generating USD 32.260 billion in revenue, compared with 7.060 billion pieces and USD 31.635 billion in FY2023.
- China recorded CNY 15.9722 trillion in online retail sales in 2025, up 8.6%. Online sales of physical goods reached CNY 13.0923 trillion, increased 5.2%, and represented 26.1% of total retail sales. Online food sales increased 14.5%.
- In the EU, 78% of people purchased goods or services online in 2025, compared with 62% in 2015. Online shopping reached 84% among people aged 16–24 and 81% among those aged 25–64.
- Canadian retail e-commerce sales reached CAD 4.3 billion in December 2025, increasing 3.6% month-on-month and representing 6.1% of retail trade. Total Canadian retail sales reached CAD 837.2 billion in 2025, up 4.0%.
- USDA data show that 19.5% of U.S. grocery shoppers purchased groceries online at least once during the previous 30 days in 2023. Among these online shoppers, 47.1% ordered groceries three or more times.
- Among U.S. consumers who purchased groceries online, 43.5% usually had their groceries delivered, 52.4% usually picked them up, and 4.1% used both methods.
- National Restaurant Association research found that 37% of U.S. adults order restaurant delivery at least once per week, while 47% obtain takeout at least weekly. More than 6 in 10 Gen Z and millennial consumers reported using takeout, drive-thru, and delivery more frequently than a year earlier.
- Another 2025 restaurant-industry survey found that 94% of consumers consider speed important for off-premises restaurant orders. More than 80% use value deals, while over 60% of takeout and delivery customers say loyalty-program membership influences where they order.
- Serve Robotics deployed 2,000 autonomous delivery robots by the end of 2025 across 20 cities and 6 major U.S. metropolitan areas, maintaining a 99.8% delivery-completion rate.
- Serve Robotics expanded its merchant network from about 400 partners to more than 4,500 during 2025, representing more than 10-fold growth. Its Uber Eats and DoorDash integrations provided access to platforms covering more than 80% of the U.S. food-delivery market.
- Diligent Robotics reported that its Moxi robots had completed more than 300,000 hospital pharmacy deliveries by July 2025, showing a substantial autonomous-delivery use case outside restaurant and parcel delivery.
By Type
The Fully Autonomous segment held a dominant 67.1% share of the Autonomous Delivery Robots Market, supported by its ability to complete deliveries without a remote operator or on-site worker during normal trips within approved service areas. This model helps retailers, restaurants, pharmacies, and logistics companies reduce labor needs per delivery and operate repeated local routes for longer hours.
Fully autonomous robots use cameras, sensors, radar, maps, artificial intelligence, and automatic obstacle detection to complete short-distance trips without human guidance. Through September 2025, autonomous driving systems had completed more than 127 million rider-only miles in U.S. robotaxi operations.
By Carrying Capacity
The Up to 10 kg segment held a dominant 44.2% share of the Autonomous Delivery Robots Market, supported by strong demand for lightweight and frequent last-mile deliveries. This payload range is suitable for meals, medicines, convenience products, small grocery orders, and e-commerce parcels, while helping robots remain compact, energy-efficient, and suitable for sidewalks and indoor routes.
The U.S. Department of Agriculture reported that household spending on food for home consumption reached USD 961.3 billion in 2024, creating a large base for small grocery and convenience deliveries. The U.S. Postal Service handled 7.25 billion shipping and package pieces in fiscal year 2024, generating USD 32.26 billion in shipping and package revenue.
Its Ground Advantage service alone transported 2.3 billion pieces weighing 2.7 billion pounds, equal to an average of only about 1.18 pounds per piece. This highlights the large volume of lightweight parcels moving through delivery networks. Robots carrying up to 10 kg can serve many of these orders without requiring the larger batteries, heavier chassis, and additional safety systems needed for higher payloads, making this segment attractive for high-frequency urban delivery operations.
By Number of Wheels
The Four-wheel segment held a dominant 45.6% share of the Autonomous Delivery Robots Market because it offers a strong balance of stability, payload support, battery space, and maneuverability. Compared with two-wheel designs, four-wheel robots can better handle uneven loads such as grocery bags, meal boxes, medicine packs, and small parcels.
Safety remains an important factor in delivery robot design. The U.S. National Highway Traffic Safety Administration recorded 7,080 pedestrian deaths and about 71,635 pedestrian injuries in 2024, highlighting the need for stable platforms, reliable braking, obstacle detection, and controlled movement in pedestrian areas.
By Vertical
The Food and Beverages Vertical held a dominant 42.1% share of the Autonomous Delivery Robots Market because food orders are frequent, time-sensitive, and usually delivered over short distances. The U.S. Department of Agriculture reported that foodservice sales reached USD 1.54 trillion in 2024, accounting for 58.5% of total U.S. food expenditure.
Limited-service restaurants generated USD 548.9 billion, while full-service restaurants generated USD 546.6 billion, creating a large base of prepared meals suitable for local robot delivery. Food delivery spending increased from USD 9.8 billion in 1997 to USD 100.5 billion in 2024, representing a rise of 924%. These orders often include meals, beverages, snacks, and small grocery baskets that can fit easily inside compact delivery robots.
Autonomous robots can move these orders without requiring a driver for every trip, helping operators reduce labor pressure, improve delivery speed, and protect food quality through enclosed cargo compartments. The National Restaurant Association expects U.S. restaurant and foodservice sales to reach USD 1.5 trillion in 2025, with employment reaching 15.9 million workers, supporting continued demand for automated last-mile delivery solutions.
Key Market Segments
By Type
- Fully Autonomous
- Semi-Autonomous
By Carrying Capacity
- Up To 10kgs
- 10.01 – 50kgs
- More than 50 kg
By Number of Wheels
- 3 Wheels
- 4 Wheels
- 6 Wheels
By Vertical
- Food and Beverages
- Healthcare
- Retail
- Logistics
- Others (Hospitality, etc.)
Geopolitical Impact Analysis
Geopolitical tensions are increasing supply-chain and cost risks for autonomous delivery robot manufacturers because these systems depend on lithium-ion batteries, graphite anodes, rare-earth magnets, semiconductors, cameras, sensors, motors, and electronic control units sourced globally.
The International Energy Agency reported that the number of mineral tariff codes covered by Chinese export controls had tripled since 2023. Although some measures were suspended until November 2026, licensing requirements, customs delays, and supply disruptions can still increase component costs, delay robot production, and push manufacturers to hold larger inventories or develop alternative suppliers.
The WTO also projected global merchandise trade volume to decline by 0.2% in 2025, nearly 3 percentage points below its low-tariff baseline. The Shanghai Containerized Freight Index averaged 2,496 points in 2024, up 149% from 2023, while spot freight rates reached about USD 3,600 per container in July 2024.
Higher freight costs directly increase the landed cost of batteries, robot chassis, sensors, circuit boards, and replacement parts. Some relief may come from lower energy prices, as the World Bank projected its energy price index to decline 17% in 2025, with Brent crude averaging USD 64 per barrel, down USD 17 from 2024.
Regional Analysis
North America led the Autonomous Delivery Robots Market in 2025, accounting for 39.8% of global revenue and generating about USD 0.6 billion. Growth is supported by a large urban population, strong e-commerce activity, high foodservice spending, and early adoption of robotics across retail and logistics. The U.S. population reached 341.8 million in July 2025, increasing by 1.8 million people, or 0.5%, from the previous year.
Canada also provides strong demand, with retail e-commerce sales reaching CAD 4.3 billion in December 2025, up 3.6% from November and representing 6.1% of total retail trade. Canadian retailers generated CAD 837.2 billion in 2025, up 4.0% from 2024. Regional automation investment is also strong, with 36,766 industrial robots valued at USD 2.25 billion ordered in 2025, representing 6.6% growth in units and 10.1% growth in value.
Asia Pacific is expected to be the fastest-growing regional market, supported by large e-commerce volumes, dense cities, and strong automation investment. China’s online retail sales reached CNY 15.97 trillion in 2025, rising 8.6% year-on-year. Physical-goods online retail sales reached CNY 13.09 trillion, increased 5.2%, and represented 26.1% of national retail sales, while online food sales grew 14.5%.
China also installed 295,000 industrial robots in 2024, equal to 54% of global installations, while its operating stock reached 2.02 million units, strengthening access to robot components, batteries, sensors, motors, lidar, and navigation technologies.
Key Regions and Countries
North America
- US
- Canada
Europe
- Germany
- France
- The UK
- Spain
- Italy
- Rest of Europe
Asia Pacific
- China
- Japan
- South Korea
- India
- Australia
- Rest of APAC
Latin America
- Brazil
- Mexico
- Rest of Latin America
Middle East & Africa
- GCC
- South Africa
- Rest of MEA
Market Dynamics
Drivers
| Driver | (~) % CAGR | Geographic Relevance | Impact Timeline |
|---|---|---|---|
| High-frequency local commerce | +3.2% | North America, China, South Korea | Short term (2 years or less) |
| Logistics labour productivity gap | +2.4% | North America, Western Europe, Japan | Short term (2 years or less) |
| Autonomous fleet scale-up | +2.1% | China, United States | Medium term (2 to 4 years) |
| Campus and healthcare routing | +1.6% | United States, Japan, Singapore | Medium term (2 to 4 years) |
| Battery and sensor integration | +1.3% | Global | Medium term (2 to 4 years) |
High-frequency local commerce
High-frequency local commerce is a major growth driver because meal, grocery, pharmacy, and convenience orders create short and repeatable delivery routes. U.S. retail e-commerce sales reached USD 1.234 trillion in 2025, increasing 5.4% year-on-year and accounting for 16.4% of total retail sales.
In the second quarter of 2026, seasonally adjusted e-commerce sales reached USD 340.2 billion, showing continued growth in online order volumes. JD Logistics reported that hundreds of unmanned vehicles operating across more than 10 Chinese provinces reduced courier transfer work by 2 to 3 trips per day and extended active delivery time by 3 to 4 hours.
Higher route density allows operators to spread software, charging, and remote-support costs across more deliveries, improving fleet economics. This trend could contribute an estimated +3.2% CAGR upside above the market’s 23.4% baseline CAGR.
Restraints
| Restraint | (~) % CAGR | Geographic Relevance | Impact Timeline |
|---|---|---|---|
| Fragmented operating permits | -3.0% | United States, Europe, Asia Pacific | Short term (2 years or less) |
| High fleet deployment capital | -2.3% | Global | Medium term (2 to 4 years) |
| Liability and insurance limits | -1.8% | North America, Europe | Short term (2 years or less) |
| Restricted pedestrian access | -1.5% | Urban North America, Europe | Medium term (2 to 4 years) |
| Low-density route economics | -1.2% | Rural and suburban markets | Long term (4 years or more) |
Fragmented operating permits
Fragmented operating permits remain a major restraint because autonomous delivery fleets require approval for sidewalk access, road crossings, speed limits, insurance, remote supervision, and data handling. At least 30 U.S. states and Washington, D.C. have enacted autonomous-vehicle legislation, but operators can still face separate city-level requirements.
Safety reporting also adds operational burden. Under NHTSA’s reporting framework, automated-driving-system companies must report certain severe crashes within 1 day and other qualifying incidents within 10 days.
These different rules can delay city launches, increase legal and compliance costs, and make it harder to standardize robot hardware and operating procedures across markets. As a result, regulatory fragmentation could create an estimated -3.0% drag on the market’s 23.4% baseline CAGR.
Challenges
| Challenge | (~) % CAGR | Geographic Relevance | Mitigation Horizon |
|---|---|---|---|
| Component sourcing concentration | -2.6% | Global | Medium term (2 to 4 years) |
| Adverse-weather navigation reliability | -2.1% | North America, Europe, Japan | Medium term (2 to 4 years) |
| Remote assistance staffing | -1.8% | Global | Medium term (2 to 4 years) |
| Curb and sidewalk variability | -1.5% | Global urban markets | Long term (4 years or more) |
| Cybersecurity lifecycle exposure | -1.3% | Global | Long term (4 years or more) |
Component sourcing concentration
Component sourcing concentration remains a major challenge because autonomous delivery robots depend on battery cells, graphite anodes, rare-earth magnets, processors, lidar, cameras, and motor controllers.
According to the IEA, China accounted for around 85% of global battery-cell manufacturing capacity and more than 90% of anode-material capacity. China also processes about 60% of lithium, 70% of cobalt, and nearly 90% of rare-earth elements, increasing exposure to export controls and supply disruptions.
Logistics disruptions add further pressure. UNCTAD reported that Red Sea rerouting increased travel distances between Asia and Europe by up to 40%, raising lead times and inventory requirements. These supply-chain pressures could create an estimated -2.6% drag on the market’s maximum attainable growth.
Opportunities
| Opportunity | (~) % CAGR | Geographic Relevance | Execution Window |
|---|---|---|---|
| Robot-as-a-service contracts | +3.4% | North America, Europe, Asia Pacific | Medium term (2 to 4 years) |
| Pharmacy cold-chain delivery | +2.6% | North America, Japan, Europe | Medium term (2 to 4 years) |
| Micro-fulfilment integration | +2.2% | Global urban markets | Medium term (2 to 4 years) |
| Industrial campus logistics | +1.8% | China, Germany, United States | Long term (4 years or more) |
| Fleet data monetisation | +1.4% | Global | Long term (4 years or more) |
Robot-as-a-service contracts
Robot-as-a-service remains an untapped opportunity because many retailers and foodservice operators still face upfront costs for robot purchase, deployment, and maintenance. Small businesses represent 99.9% of U.S. firms, making low-capital service models important for wider adoption.
Serve Robotics expanded its active fleet 20-fold in 2025, surpassed 2,000 Level 4 robots, and achieved a 99.8% delivery-completion rate, showing the potential for usage-based pricing and fleet-service contracts. JD Logistics also targeted unmanned vehicle deployment at the 1,000-unit level in 2025, highlighting the importance of fleet utilization rather than hardware ownership.
A service model can convert customer CapEx into operating expenditure, improve recurring vendor revenue, and potentially lower delivery costs by an estimated 15% to 30% at high utilization. If financing, maintenance, and service agreements scale successfully, this model could provide around +3.4% upside above the 23.4% baseline CAGR.
Key Players Analysis
The Autonomous Delivery Robots Market is led by a small group of companies with strong robotics capability, delivery networks, and large investment budgets. Tier-1 leaders include JD.com, Nuro, Boston Dynamics, and Caterpillar. Among them, JD.com has one of the strongest commercial positions because it combines retail, logistics, warehouse automation, and robot deployment.
JD.com generated RMB 1,309.1 billion (USD 187.2 billion) in 2025 revenue, up 13.0% year-on-year. Marketplace, marketing, logistics, and related service revenue reached RMB 285.3 billion (USD 40.8 billion). R&D spending totaled RMB 22.2 billion (USD 3.18 billion), equal to 1.7% of revenue. By the end of 2025, more than 20 LangzuTech automated warehouses were operating across almost 20 Chinese cities. JD.com is estimated to hold around 15–20% of the commercial autonomous delivery robot opportunity.
Boston Dynamics and Nuro remain important technology challengers but do not disclose separate delivery-robot revenue or R&D figures. Tier-2 challengers include Aethon, Aitonomi, Kiwi Campus, Piaggio, Marble Robot, and Postmates. Their combined market share is estimated at around 20–30%, spread across healthcare, campuses, food delivery, and local logistics programs.
Caterpillar is an important adjacent competitor with strong financial resources. It reported USD 67.6 billion in 2025 sales and revenues, USD 2.15 billion in R&D spending, and USD 2.79 billion in capital expenditure. Its strengths are more relevant to rugged autonomous platforms, industrial logistics, fleet monitoring, and charging infrastructure, creating a competitive market split between consumer last-mile specialists and larger industrial technology companies.
Top Key Players in the Market
- Marble Robot Inc.
- Aethon Inc.
- Aitonomi AG
- Boston Dynamics Inc.
- JD.com, Inc.
- Kiwi Campus SAS
- Nuro Inc.
- Piaggio and C. Spa
- Postmates Inc.
- Caterpillar Inc.
Recent Developments
- In 2026, Amazon announced an investment of more than EUR 10 billion to expand and modernize its European fulfilment network with advanced robotics and automation. Amazon plans to deploy Proteus in Europe, while its STARK robotic system is expected to expand to 15 European sites. Amazon had already deployed more than 1 million robots across more than 300 facilities worldwide.
- In 2025, Nuro completed a USD 203 million Series E funding round at a USD 6.0 billion valuation to strengthen its autonomous-driving technology and commercial partnerships. The financing included an initial USD 106 million tranche announced in April 2025, followed by an additional USD 97 million.
Report Scope
| Report Features | Description |
|---|---|
| Market Value (2025) | USD 1.5 Billion |
| Forecast Revenue (2035) | USD 12.1 Billion |
| CAGR (2026-2035) | 23.4% |
| Base Year for Estimation | 2025 |
| Historic Period | 2020-2024 |
| Forecast Period | 2026-2035 |
| Report Coverage | Revenue Forecast, Market Dynamics, Competitive Landscape, Recent Developments |
| Segments Covered | By Type (Fully Autonomous, Semi-Autonomous); By Carrying Capacity (Up to 10 kg, 10.01–50 kg, More than 50 kg); By Number of Wheels (3 Wheels, 4 Wheels, 6 Wheels); By Vertical (Food and Beverages, Healthcare, Retail, Logistics, Others) |
| Regional Analysis | North America – US, Canada; Europe – Germany, France, The UK, Spain, Italy, Rest of Europe; Asia Pacific – China, Japan, South Korea, India, Australia, Singapore, Rest of APAC; Latin America – Brazil, Mexico, Rest of Latin America; Middle East & Africa – GCC, South Africa, Rest of MEA |
| Competitive Landscape | Marble Robot Inc., Aethon Inc., Aitonomi AG, Boston Dynamics Inc., JD.com Inc., Kiwi Campus SAS, Nuro Inc., Piaggio and C. Spa, Postmates Inc., Caterpillar Inc. |
| Customization Scope | Customization for segments, region/country-level will be provided. Moreover, additional customization can be done based on the requirements. |
| Purchase Options | We have three licenses to opt for: Single User License, Multi-User License (Up to 5 Users), Corporate Use License (Unlimited Users and Printable PDF) |





























