


Report Overview
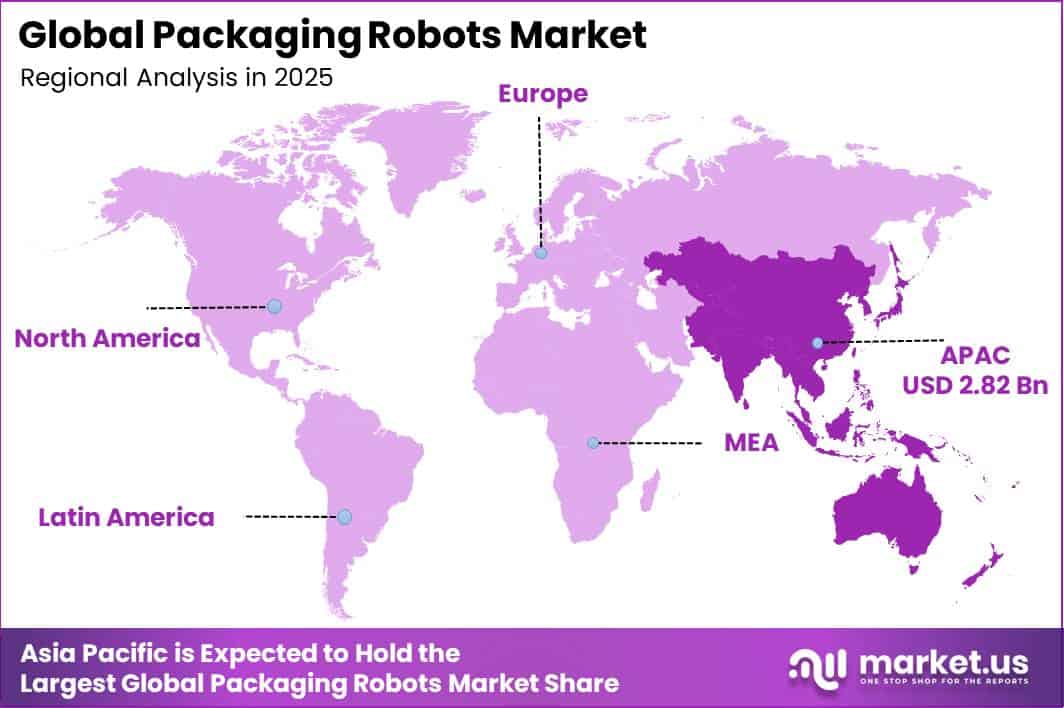
In 2025, the Global Packaging Robots Market was valued at USD 8.0 billion. The market is projected to grow at a CAGR of 11.5% during 2026–2035, reaching approximately USD 23.6 billion by 2035. Asia Pacific dominated the global market in 2025, accounting for more than 35.3% of the total market share and generating approximately USD 2.82 billion in revenue.
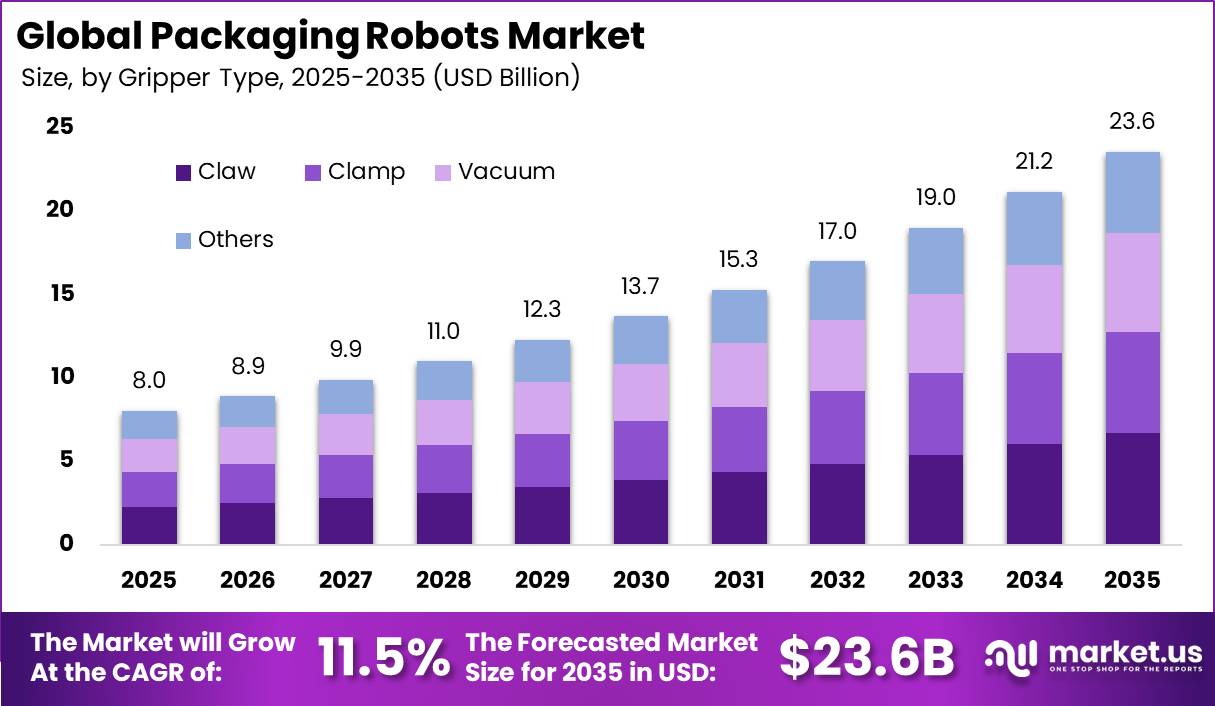
Growth is supported by rising packaging demand across food, beverages, consumer goods, pharmaceuticals, and e-commerce, where companies require faster and more accurate packing, sorting, case loading, labelling, and palletising. According to UNCTAD, business e-commerce sales across 43 economies reached nearly USD 27 trillion in 2022, while sales in 2021 were 15% higher than in 2019.
In China and the Republic of Korea, online retail represented around 25–30% of total retail sales, increasing the need for automated packaging and fulfilment systems. IFR reported that Asia accounted for 74% of global industrial robot installations in 2024.
China installed a record 295,000 robots, representing 54% of worldwide installations, while its operational robot stock exceeded 2 million units. India also installed a record 9,100 robots, increasing by 7% year on year. This growing automation base is strengthening technical skills, system integration capacity, and confidence in robotic packaging solutions across manufacturing and warehouse operations.
Key Takeaway
- The Packaging Robots Market was valued at USD 8.0 billion in 2025 and is projected to reach USD 23.6 billion by 2035, growing at a CAGR of 11.5%.
- The claw gripper segment held the leading position by gripper type with a 28.4% share.
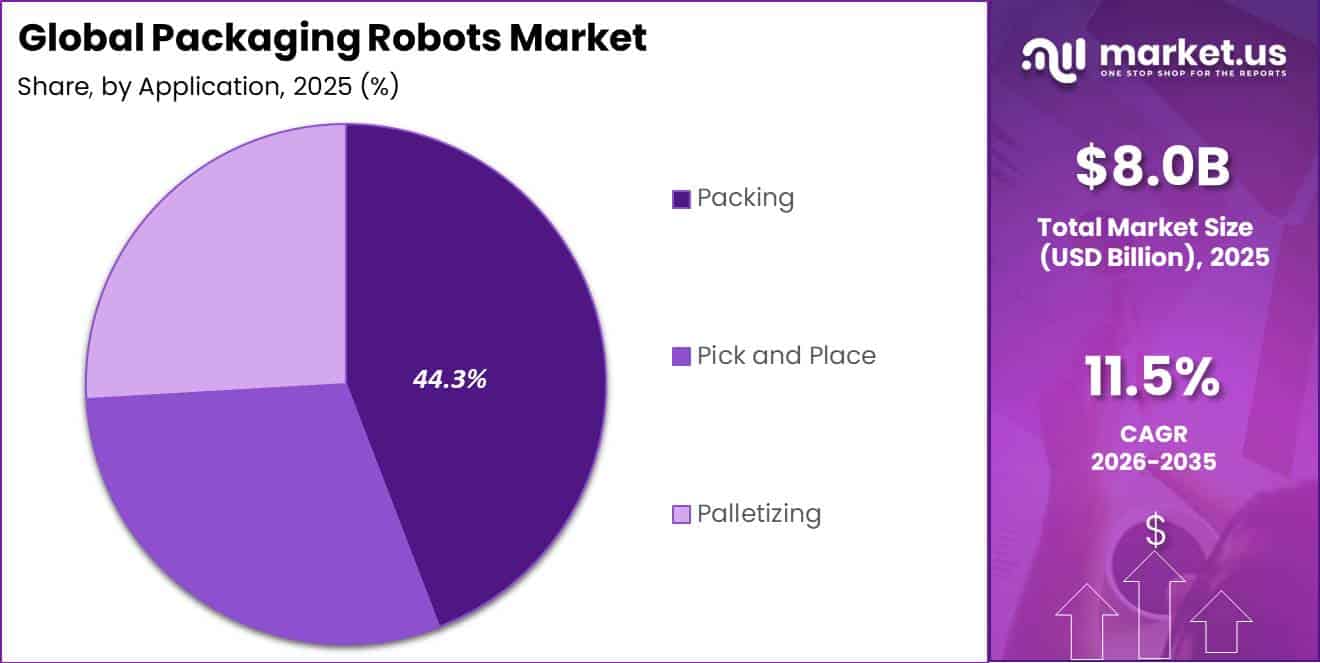
- The packing application segment led the market with a 44.3% share.
- The food and beverage segment held the largest end-user share at 27.4%.
- Asia Pacific led the market in 2025 with a 35.3% share, generating USD 2.8 billion in revenue.
By Gripper Type
The Claw Gripper segment held a leading position in the packaging robots market, accounting for a 28.4% share. Its strong position is supported by its ability to handle uneven, heavy, rigid, and loosely packed products with reliable grip and control. Unlike vacuum systems, claw grippers do not require a flat or airtight surface, making them suitable for cartons, bottles, crates, trays, bags, and fresh-produce packs.
This flexibility supports wide use across food, beverage, agriculture, and consumer-goods packaging lines. According to the Food and Agriculture Organization of the United Nations, global fruit and vegetable production reached 2.1 billion tonnes in 2023, including 952 million tonnes of fruit and 1.2 billion tonnes of vegetables.
By Application
The Packing application segment held a leading position in the packaging robots market, accounting for a 44.3% share. Its dominance is supported by the basic need to place every finished product into primary, secondary, or transport packaging before shipment. Demand is particularly strong in healthcare and pharmaceutical operations, where packaging must meet strict safety, traceability, and handling requirements.
According to the World Health Organization, the global vaccine market handled about 7 billion doses in 2023, with a total value of around USD 77 billion. These large volumes require vaccines to be accurately placed into vials, cartons, trays, and temperature-controlled shipping packs while maintaining batch identification and pack integrity.
By End User
The Food and Beverage segment held a leading position in the packaging robots market, accounting for a 27.4% share. Its strong position is supported by the large volume of food products that must be filled, packed, sealed, labelled, and palletised before distribution. According to the Food and Agriculture Organization, global cereal production reached a record 3.1 billion tonnes in 2024, representing an increase of 27% compared with 2010.
Global cereal utilisation also reached a record 2,851 million tonnes during the 2024/25 season. These high volumes create strong demand for automated bagging, case packing, filling, sorting, and palletising systems across food and beverage plants. Packaging robots help manufacturers maintain steady production speeds while improving handling accuracy and reducing repetitive manual work.
Key Market Segments
By Gripper Type
- Claw
- Clamp
- Vacuum
- Others
By Application
- Packing
- Pick and Place
- Palletizing
By End User
- Food and Beverage
- Pharmaceuticals
- Consumer Products
- Logistics
- Others
Geopolitical Impact Analysis
Geopolitical tensions are increasing the cost and delivery time of packaging robots because these systems depend on imported servo motors, reducers, sensors, machine vision systems, programmable controllers, semiconductors, steel structures, and electrical components. The IMF reported that the U.S. effective tariff rate increased from below 3% to around 17% after tariff measures introduced in 2025.
Earlier measures in April temporarily raised the effective tariff rate on Chinese goods to 115%. In addition, the U.S. Trade Representative imposed a 50% tariff on Chinese semiconductors, increasing costs for controllers, drives, cameras, and other electronic parts used in robotic systems. Manufacturers are responding by using regional suppliers and dual-sourcing strategies, although redesign, compliance testing, and higher inventories can further increase costs.
Shipping disruptions are also affecting robot deliveries. UNCTAD reported that rerouting Asia-Europe vessels around the Cape of Good Hope adds around 12 days, or nearly 30%, to transit times. By mid-2024, shipping tonnage through the Suez Canal had fallen 70%, while arrivals around the Cape increased 89%.
These delays can slow the delivery of robot arms, grippers, spare parts, and complete packaging lines. Energy prices create another risk. The World Bank estimated that a disruption of 2 million barrels per day could increase average 2025 Brent crude prices from a baseline of USD 73 per barrel to USD 84 per barrel, representing a 15% rise.
Regional Analysis
Asia Pacific dominated the packaging robots market with a 35.3% revenue share, valued at USD 2.8 billion in 2025. The region benefits from strong manufacturing, large consumer-goods production, and high industrial automation adoption. According to the International Federation of Robotics, Asia installed 401,665 industrial robots in 2024, accounting for 74% of global installations.
China led with 295,045 units, followed by Japan with 44,453 units and South Korea with 30,596 units. India also installed 9,100 robots, increasing by 7% year on year. This strong automation base supports wider use of robotic picking, case packing, palletising, inspection, and material-handling systems across food, beverage, pharmaceutical, electronics, and e-commerce operations.
North America is expected to be the fastest-growing regional market, supported by warehouse automation, higher labour costs, and rising direct-to-consumer shipments. U.S. retail e-commerce sales reached USD 304.2 billion in the second quarter of 2025, representing 16.3% of total retail sales. This creates strong demand for robotic systems used in picking, packing, labelling, and shipment preparation.
Industrial robot installations in the Americas declined 10% to 50,100 units in 2024, but deployments remained above 50,000 units for the fourth consecutive year. Europe continues to be an important mature market, while Latin America, the Middle East, and Africa offer longer-term growth opportunities as manufacturing and logistics infrastructure expand.
Key Regions and Countries
North America
- US
- Canada
Europe
- Germany
- France
- The UK
- Spain
- Italy
- Rest of Europe
Asia Pacific
- China
- Japan
- South Korea
- India
- Australia
- Rest of APAC
Latin America
- Brazil
- Mexico
- Rest of Latin America
Middle East & Africa
- GCC
- South Africa
- Rest of MEA
Market Dynamics
Drivers
| Driver | (~) % CAGR | Geographic Relevance | Impact Timeline |
|---|---|---|---|
| Fulfilment throughput demand | +2.4% | North America, Asia Pacific, Europe | Short term (2 years or less) |
| Food safety automation | +1.9% | Global | Short term (2 years or less) |
| Factory labour substitution | +1.7% | North America, Europe, Japan | Medium term (2 to 4 years) |
| High-mix production | +1.4% | Asia Pacific, Europe | Medium term (2 to 4 years) |
| Pharma line modernization | +1.2% | North America, Europe, Asia Pacific | Medium term (2 to 4 years) |
Fulfilment throughput demand
Rising parcel and direct-to-consumer volumes are converting packaging from a labour-led warehouse activity into an automated throughput constraint. U.S. Census Bureau data show that retail e-commerce represented 16.3% of U.S. retail sales in the second quarter of 2025, creating a larger flow of individually packed, labelled, and sorted orders.
The International Federation of Robotics recorded 542,076 industrial-robot installations globally in 2024, more than double the level of a decade earlier, while Asia accounted for 401,665 of these installations. The Universal Postal Union reports that parcel growth continues to require faster processing and stronger traceability across delivery networks.
Restraints
| Restraint | (~) % CAGR | Geographic Relevance | Impact Timeline |
|---|---|---|---|
| High project capital cost | -2.1% | Global, strongest among smaller manufacturers | Short term (2 years or less) |
| Tariff-loaded component cost | -1.5% | North America, China-linked supply chains | Short term (2 years or less) |
| Financing cost pressure | -1.1% | Europe, North America, emerging markets | Medium term (2 to 4 years) |
| Plant shutdown aversion | -0.9% | Global | Short term (2 years or less) |
| Fragmented buyer budgets | -0.7% | Emerging markets | Medium term (2 to 4 years) |
High project capital cost
High upfront system cost remains a major barrier because buyers must pay for the robot, gripper, vision system, safety equipment, controls integration, line redesign, and commissioning before receiving efficiency benefits. The U.S. Federal Reserve kept its policy rate at 4.25%–4.50% through early 2025, increasing financing costs for capital equipment.
The European Central Bank’s deposit facility rate stood at 2.50% in March 2025, while the World Bank projected global growth of 2.7% for 2025. These conditions can delay automation spending, especially among smaller food and consumer-goods producers, creating an estimated -2.1% drag on the market’s achievable CAGR.
Challenges
| Challenge | (~) % CAGR | Geographic Relevance | Mitigation Horizon |
|---|---|---|---|
| Controls integration complexity | -1.8% | Global | Medium term (2 to 4 years) |
| Automation skills shortage | -1.5% | North America, Europe, Asia Pacific | Long term (4 years or more) |
| Component supply concentration | -1.3% | Global | Medium term (2 to 4 years) |
| Irregular product handling | -1.0% | Food, consumer goods, e-commerce | Medium term (2 to 4 years) |
| Cybersecurity compliance load | -0.8% | Europe, North America | Medium term (2 to 4 years) |
Controls integration complexity
Integration remains a key challenge for packaging robots because they must work with existing conveyors, fillers, labellers, warehouse software, safety controllers, and production systems. The International Federation of Robotics reported 4.2 million industrial robots operating worldwide at the end of 2023, showing the scale of equipment that requires compatibility and system integration.
New compliance requirements can also increase deployment time and cost. The European Union’s Machinery Regulation will apply from January 2027, adding further validation and safety requirements for new machinery. Site-specific programming, testing, and system acceptance can delay commissioning and limit repeatable installations, creating an estimated -1.8% drag on the market’s maximum growth rate.
Opportunities
| Opportunity | (~) % CAGR | Geographic Relevance | Execution Window |
|---|---|---|---|
| Robotics-as-a-service models | +2.0% | North America, Europe, Asia Pacific | Medium term (2 to 4 years) |
| Small plant automation | +1.7% | Emerging markets, Europe, North America | Medium term (2 to 4 years) |
| Vision-enabled flexible gripping | +1.5% | Global | Medium term (2 to 4 years) |
| Aftermarket service subscriptions | +1.3% | Global installed base | Short term (2 years or less) |
| Nearshore line deployment | +1.1% | North America, Europe | Long term (4 years or more) |
Robotics-as-a-service models
Robotics-as-a-Service is an emerging opportunity in the packaging robots market because it can replace a large upfront investment with subscription, lease, or usage-based payments. The International Labour Organization reports that small and medium-sized enterprises account for more than 70% of global employment, showing a large customer base that may benefit from lower-cost automation models.
The International Federation of Robotics reported 542,076 industrial robot installations in 2024, supporting demand for maintenance, software, and remote-monitoring services.
By spreading equipment costs across multi-year contracts and charging separately for uptime, maintenance, gripper changes, and analytics, providers can offer more predictable operating costs. This model could create around +2.0% CAGR upside above the 11.5% baseline growth rate.
Key Players Analysis
The packaging robots market is led by Tier-1 automation suppliers such as ABB, FANUC, Syntegon, Schneider Electric, Epson, and Yamaha Robotics. Their large installed bases, global service networks, and control over robot, motion, software, and packaging technologies create strong entry barriers. ABB generated USD 3.2 billion in Robotics & Discrete Automation revenue in 2024, supported by around 10,800 employees.
FANUC reported ¥380.9 billion in Robot Division revenue in fiscal 2024, rising 6.7% and representing 47.9% of total group sales. Syntegon recorded EUR 1.6 billion in 2024 revenue, while order intake increased 11% to EUR 1.8 billion. ABB, FANUC, and Syntegon therefore form the main Tier-1 supplier group, although exact packaging-robot market shares are not publicly disclosed.
Schneider Electric strengthens competition through industrial controls, digital software, safety systems, and machine electrification. It generated EUR 38.1 billion in 2024 revenue and spent EUR 2.2 billion on R&D, equal to 5.9% of sales, alongside EUR 1.3 billion in net capital expenditure. Epson invested ¥44.2 billion in R&D, including ¥6.8 billion in manufacturing-related activities, and allocated ¥12.3 billion to commercialisation and capacity.
Yamaha Robotics generated ¥113.3 billion in revenue, up 11.4%, but reported a ¥3.0 billion operating loss. Tier-2 suppliers such as BluePrint Automation, Brenton Engineering, and Remtec Automation compete through customised end-of-line solutions. Bosch Packaging Technology has operated as Syntegon since 2020 and should not be counted separately.
Top Key Players in the Market
- ABB Limited
- Syntegon Technology GmbH
- BluePrint Automation
- Bosch Packaging Technology
- Brenton Engineering
- Epson Robots
- Fanuc Corporation
- Schneider Electric SE
- Yamaha Robotics
- Remtec Automation LLC
Recent Developments
- In 2026, FANUC announced its new Central Technical Center at its headquarters in Japan, which had been completed in March 2025. The 3-storey facility covers approximately 14,900 m² within FANUC’s roughly 1.7 million m² headquarters campus.
- In 2025, ABB signed an agreement to sell its Robotics division to SoftBank Group for an enterprise value of USD 5.3 billion, replacing its earlier plan to spin off the business. ABB Robotics generated USD 2.3 billion in 2024 revenue, employed approximately 7,000 people, and recorded an operational EBITA margin of 12.1%.
Report Scope
| Report Features | Description |
|---|---|
| Market Value (2025) | USD 8.0 Billion |
| Forecast Revenue (2035) | USD 23.6 Billion |
| CAGR (2026-2035) | 11.5% |
| Base Year for Estimation | 2025 |
| Historic Period | 2020-2024 |
| Forecast Period | 2026-2035 |
| Report Coverage | Revenue Forecast, Market Dynamics, Competitive Landscape, Recent Developments |
| Segments Covered | By Gripper Type – (Claw, Clamp, Vacuum, Others); By Application – (Packing, Pick and Place, Palletizing); By End User – (Food and Beverage, Pharmaceuticals, Consumer Products, Logistics, Others) |
| Regional Analysis | North America – US, Canada; Europe – Germany, France, The UK, Spain, Italy, Rest of Europe; Asia Pacific – China, Japan, South Korea, India, Australia, Singapore, Rest of APAC; Latin America – Brazil, Mexico, Rest of Latin America; Middle East & Africa – GCC, South Africa, Rest of MEA |
| Competitive Landscape | ABB Limited, Syntegon Technology GmbH, BluePrint Automation, Bosch Packaging Technology, Brenton Engineering, Epson Robots, Fanuc Corporation, Schneider Electric SE, Yamaha Robotics, Remtec Automation LLC |
| Customization Scope | Customization for segments, region/country-level will be provided. Moreover, additional customization can be done based on the requirements. |
| Purchase Options | We have three licenses to opt for: Single User License, Multi-User License (Up to 5 Users), Corporate Use License (Unlimited Users and Printable PDF) |





























