Report Overview
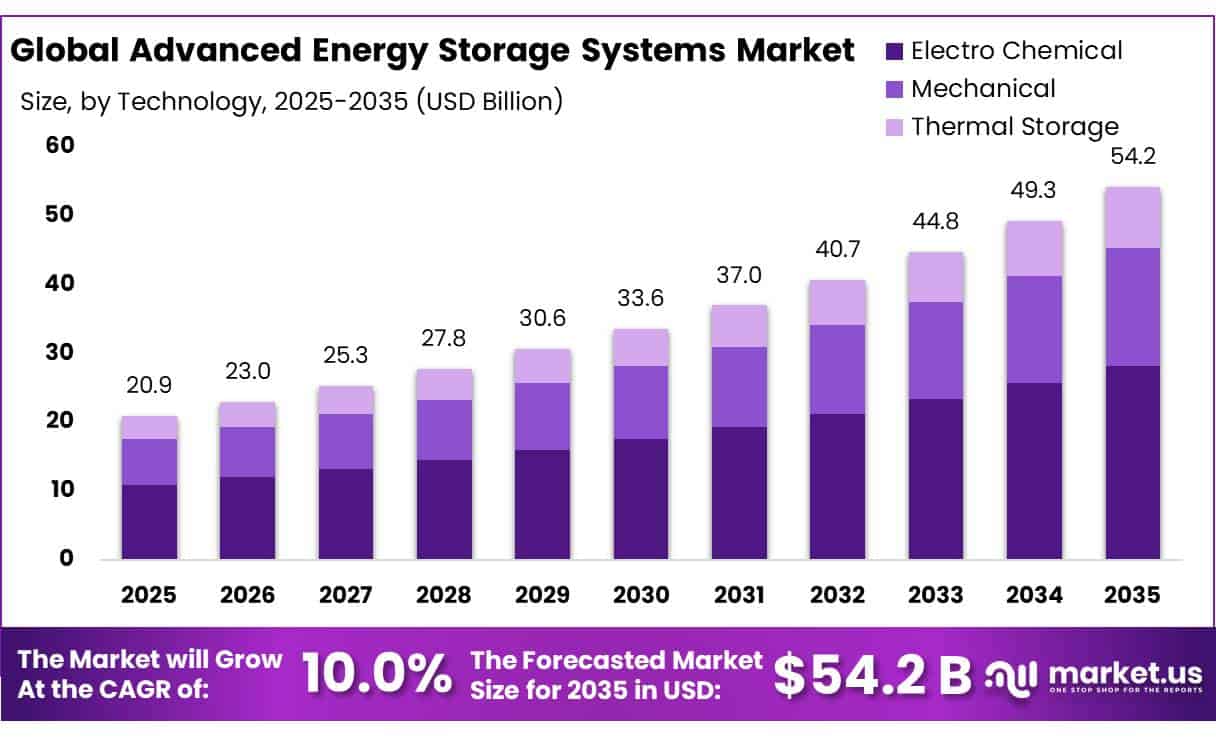
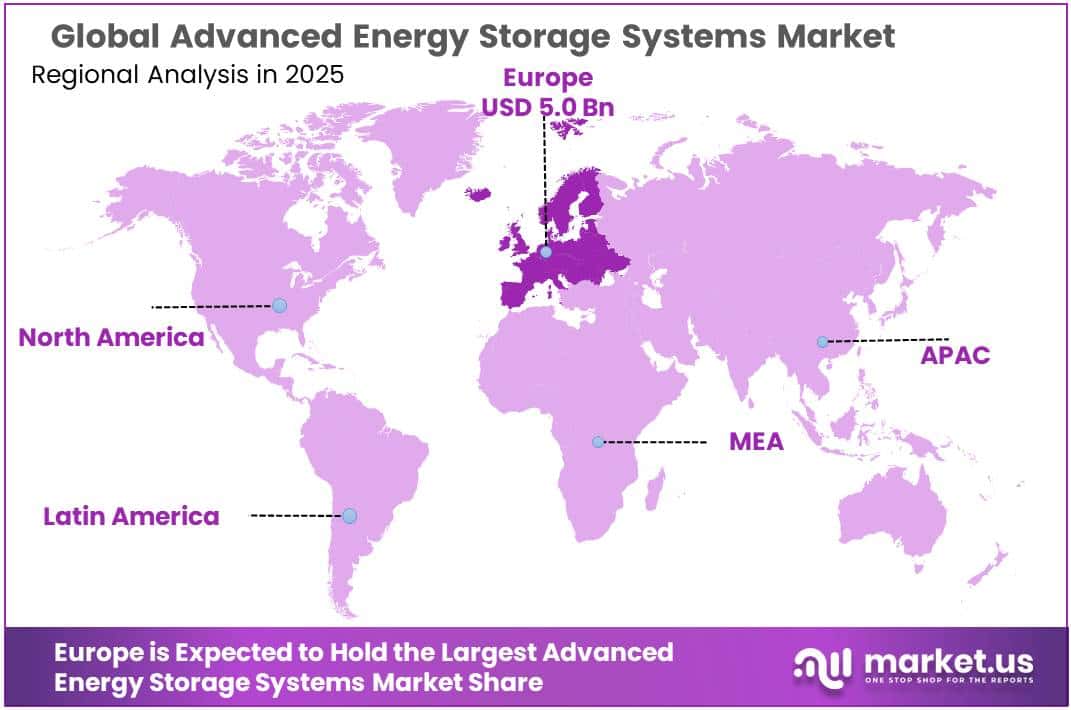
The Global Advanced Energy Storage Systems Market size is expected to be worth around USD 54.2 Billion by 2035, from USD 20.9 Billion in 2025, growing at a CAGR of 10.0% during the forecast period from 2026 to 2035. In 2025, Europe held a dominant market position, capturing more than a 34.23% share, holding USD 5.0 Billion revenue.
Advanced Energy Storage Systems (AESS) are becoming an important part of the global energy infrastructure as industries seek reliable electricity, better energy efficiency, and improved integration of renewable power. These systems store energy and release it when required, helping balance electricity supply and demand. Major technologies include lithium-ion batteries, solid-state batteries, flow batteries, sodium-ion batteries, compressed air energy storage, thermal energy storage, and pumped hydro storage.
- According to the IEA, 108 GW of new battery storage capacity was installed globally in 2025, representing a 40% increase compared with 2024. Global installed battery storage capacity reached approximately 11 times its 2021 level. Utility-scale projects accounted for around 80% of new battery capacity additions, reflecting increasing demand from grid operators and energy-intensive industries.
Rising electricity demand, renewable energy integration, grid instability, and the need for uninterrupted industrial operations are major factors driving the adoption of advanced energy storage systems. The U.S. Energy Information Administration (EIA) reported that utility-scale battery storage capacity in the United States reached 43.6 GW by the end of 2025. During the first half of 2026, another 8.3 GW was added, taking total capacity to nearly 52 GW. This expansion reflects increasing investment in grid flexibility, peak-load management, and reliable electricity supply.
- The U.S. Department of Energy supports research into storage technologies that can improve reliability, affordability, and resilience. Meanwhile, the IEA reported that lithium-ion battery prices declined by approximately 90% between 2010 and 2023, helping expand their use in industrial and grid applications.
Government initiatives, clean energy targets, and financial incentives are further supporting market development. In the United States, the Department of Energy promotes energy storage research, demonstration projects, and grid modernization to strengthen domestic technology capabilities. In Europe, the European Commission supports battery innovation and sustainable manufacturing through its battery policy framework and strategic investment programs. These initiatives encourage manufacturers to improve battery chemistry, recycling, energy density, safety, and lifecycle performance.
Key Takeaways
- Advanced Energy Storage Systems Market size is expected to be worth around USD 54.2 Billion by 2035, from USD 20.9 Billion in 2025, growing at a CAGR of 10.0%.
- Electro Chemical held a dominant market position, capturing more than a 52.11% share.
- Transportation held a dominant market position, capturing more than a 63.45% share.
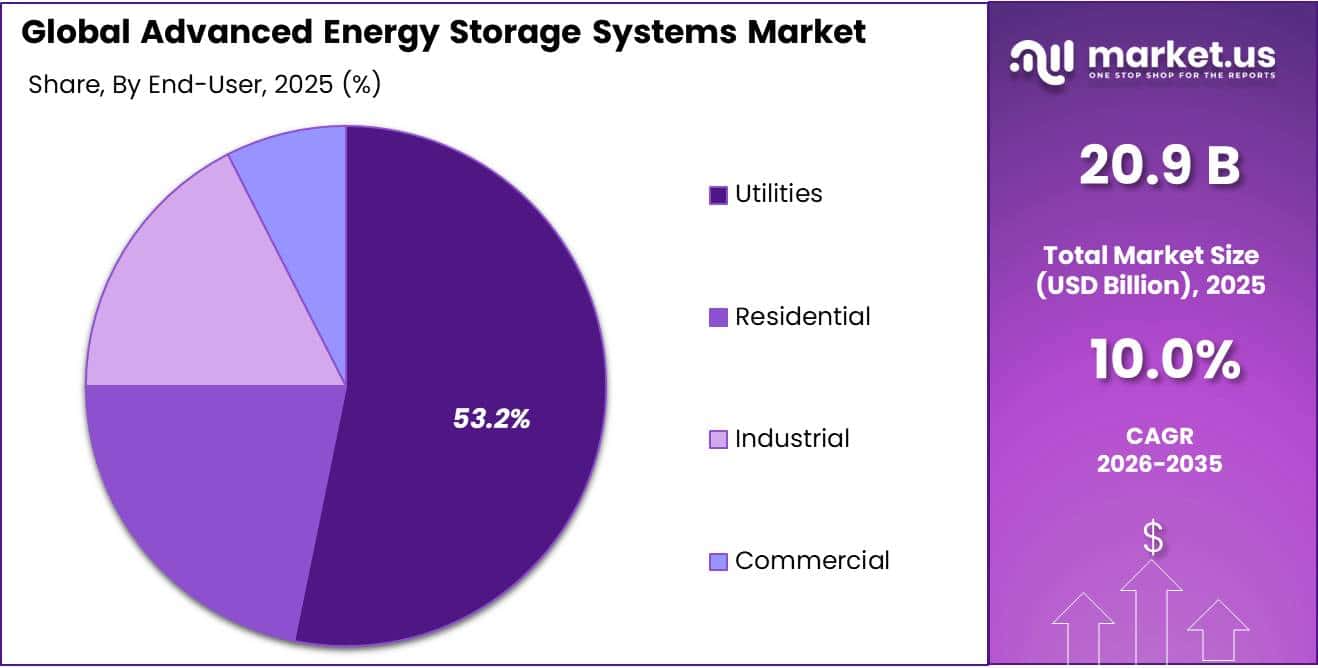
- Utilities held a dominant market position, capturing more than a 53.23% share.
- Europe held a dominant position in the Advanced Energy Storage Systems Market, accounting for 34.23% of the market, valued at USD 5.0 billion.
By Technology Analysis
Electrochemical Energy Storage Leads Through Battery-Based Storage Solutions
In 2025, “Electro Chemical” held a dominant market position, capturing more than a 52.11% share. Electrochemical energy storage leads because battery-based systems offer flexible installation, fast response, high efficiency, and easy integration with renewable power sources. Lithium-ion, lithium iron phosphate, sodium-ion, lead-acid, and flow batteries are among the key technologies used in this segment. These systems support electricity storage, peak-load management, backup power, and grid balancing across industrial facilities, data centers, and utility networks.
According to the International Energy Agency (IEA), 108 GW of new battery storage capacity was deployed globally in 2025, marking a 40% increase over 2024. Around 80% of these additions were utility-scale installations, while lithium iron phosphate batteries accounted for approximately 90% of deployments. These figures demonstrate the growing role of electrochemical storage in modern power systems.
Mechanical energy storage systems store energy in physical forms such as gravitational potential energy, compressed air, or rotational motion. Pumped-storage hydropower, compressed-air energy storage, and flywheel systems are important technologies within this segment. These solutions are used for grid stability, frequency regulation, peak-demand management, and long-duration electricity storage. Pumped-storage hydropower remains an established technology because it can store large amounts of electricity and release power when demand increases.
According to the U.S. Energy Information Administration (EIA), the United States had approximately 23,156 MW of pumped-storage hydropower generation capacity across 18 states in 2025. The U.S. Department of Energy’s 2026 Hydropower Market Report also recorded 80.55 GW of total U.S. hydropower generating capacity across 2,258 plants in 2025, supporting the wider role of hydropower infrastructure in electricity supply. Mechanical storage adoption is supported by its long operating life and ability to provide grid-scale flexibility, although high construction costs, geographical requirements, and lengthy project development can limit new installations.
By Application Analysis
Transportation Dominates with Rising Electric Vehicle Adoption
In 2025, “Transportation” held a dominant market position, capturing more than a 63.45% share. The transportation segment leads due to growing adoption of electric vehicles, electric trucks, buses, and other battery-powered mobility solutions. Advanced energy storage systems play a vital role in vehicle performance by providing power for propulsion, improving energy efficiency, and supporting longer driving ranges. Battery technology advancements and expanding charging infrastructure are further strengthening demand.
According to the International Energy Agency (IEA), global electric car sales exceeded 20 million units in 2025, representing approximately 25% of total new car sales. Electric truck sales also more than doubled compared with 2024, reaching 9% of global truck sales. These developments demonstrate the increasing importance of battery-based energy storage in transportation and the wider shift toward electrified mobility.
Grid Storage is an important application of advanced energy storage systems, supporting electricity supply reliability, grid stability, renewable energy integration, and peak-demand management. Utility-scale battery installations help power networks store surplus electricity and release it during periods of high consumption. These systems also support frequency regulation, reduce congestion, and improve the flexibility of electricity infrastructure.
According to the U.S. Energy Information Administration (EIA), utility-scale battery storage capacity in the United States reached 43.6 GW by the end of 2025. During the first 6 months of 2026, another 8.3 GW was added, increasing total capacity to nearly 52 GW. The EIA also reported that operators planned an additional 54 GW over the following 2.5 years. These government figures highlight the growing role of grid storage in supporting reliable and flexible electricity systems.
By End User Analysis
Utilities Lead the Advanced Energy Storage Systems Market with a 53.23% Share in 2025
In 2025, “Utilities” held a dominant market position, capturing more than a 53.23% share of the Advanced Energy Storage Systems Market by end user. The utilities segment is driven by the growing need for reliable electricity supply, grid stability, and efficient energy management. Advanced energy storage systems help utility providers store electricity generated from renewable sources and deliver it during periods of high demand. These systems also support peak load management, reduce pressure on power infrastructure, and improve the integration of solar and wind energy into existing grids.
In 2025, the residential segment contributed to the Advanced Energy Storage Systems Market through the increasing adoption of home energy storage solutions. Residential energy storage systems allow households to store electricity generated from rooftop solar panels and use it during evening hours, power interruptions, and periods of high electricity demand. These systems help improve energy independence, reduce dependence on conventional grid electricity, and support better household energy management.
In 2026, the growing focus on renewable energy integration and reliable electricity access continued to support interest in residential battery storage. Government-backed renewable energy initiatives and household solar installations also created opportunities for energy storage adoption. Residential systems are becoming increasingly relevant for consumers seeking reliable backup power and improved utilization of renewable electricity.
Key Market Segments
By Technology
- Electro Chemical
- Lithium-ion battery
- Lead Acid battery
- Sodium Sulfur (NaS) battery
- Flow battery
- Nickel Metal Hydride (NiMH) & Nickel Metal Cadmium (NiCd)
- Mechanical
- Pumped Hydro
- Flywheel
- Compressed Air Energy Storage (CAES) & Liquid Air Energy Storage (LAES)
- Thermal Storage
- Thermo Chemical
- Sensible
- Latent
By Application
- Transportation
- Grid Storage
By End User
- Residential
- Industrial
- Commercial
- Utilities
Driver Analysis
Renewable-Output Time Shifting — +0.9 Percentage Points
Expanding variable renewable generation increases the commercial value of moving energy from high-output periods into higher-value hours, creating storage procurement where curtailment, low daytime prices or evening demand weaken generation economics. IRENA’s July 2026 revision records 693 GW of renewable-capacity additions in 2025, with renewables representing approximately 49.5% of global installed generating capacity; this is a capacity share, not a generation share or an automatic storage-attachment ratio.
EIA separately documents US solar-and-storage configurations that shift low-priced electricity into higher-price periods. In a constructed 100 MW solar project paired with 50 MW/200 MWh storage, one full discharge on 300 days delivers 60,000 MWh annually. At 88% round-trip efficiency, charging requires approximately 68,182 MWh; with USD 20/MWh charging energy and USD 100/MWh discharge realization, gross annual energy margin is approximately USD 4.64 million before degradation, operating expense, network charges and financing. That margin is owner revenue—not storage-system market revenue—and the assumed prices are not a forecast.
The +0.9-point sensitivity assumes 30% of terminal counterfactual supplier revenue is exposed to renewable-linked applications and achieves approximately 14.3% cumulative outperformance, producing 4.3% terminal upside. Suppliers consequently compete on usable energy, cycling capability and integrated dispatch rather than nameplate capacity alone; only executed storage contracts are counted, with curtailed energy treated as free only where contractual and technical conditions genuinely permit it.
Drivers Impact Analysis
| Driver | (~) % Impact on CAGR Forecast | Geographic Relevance | Impact Timeline |
|---|---|---|---|
| Renewable-output time shifting | +0.9 pp | China, US, EU, India, Australia | Medium term (2–4 years) |
| Peak-capacity procurement | +0.8 pp | US, Australia, UK, India | Medium term (2–4 years) |
| Storage-system cost optimization | +0.7 pp | China, US, EU, India | Medium term (2–4 years) |
| Wholesale-market participation | +0.6 pp | US organized markets | Short term (≤ 2 years) |
| Customer-side peak management | +0.6 pp | US, Germany, Japan, Australia | Medium term (2–4 years) |
| Thermal-load time shifting | +0.4 pp | US, EU, China, Japan | Long term (≥ 4 years) |
Restraint Analysis
Interconnection and Reinforcement Delays — −0.8 Percentage Points
Storage demand cannot become executable procurement where projects lack a viable grid connection, an acceptable reinforcement cost or a sufficiently credible energization date. Berkeley Lab’s December 2025 queue assessment recorded approximately 890 GW of storage seeking US transmission interconnection at end-2024; across generation and storage projects, median request-to-operation time exceeded four years for projects completed during 2018–2024, versus less than two years during 2000–2007.
In a constructed 100 MW/400 MWh project costing USD 80 million before exceptional network work, a USD 20 million reinforcement requirement raises initial expenditure by 25%. If USD 10 million of development expenditure and equipment deposits remain committed during a two-year delay, financing at an assumed 10% simple annual rate adds USD 2 million before escalation and contract-renegotiation costs. A twenty-project portfolio losing three projects to unacceptable connection economics removes USD 240 million of proposed system procurement at the original project cost, but projects merely deferred within 2026–2031 must not be treated as permanently lost sales.
The −0.8-point sensitivity assumes 30% of terminal counterfactual revenue is connection-sensitive and experiences a 12% realization shortfall, producing approximately 3.6% aggregate terminal erosion. Suppliers consequently face conditional notices to proceed, delayed factory reservations and weaker backlog conversion; behind-the-meter and directly coupled thermal applications are excluded from this particular exposure.
Restraint Impact Analysis
| Restraint | (~) % Impact on CAGR Forecast | Geographic Relevance | Impact Timeline |
|---|---|---|---|
| Interconnection and reinforcement delays | −0.8 pp | US, UK, EU, Australia | Long term (≥ 4 years) |
| Merchant-revenue compression | −0.7 pp | California, Texas, UK, Australia | Medium term (2–4 years) |
| Financing and bankability gaps | −0.6 pp | US, EU, India, ASEAN | Long term (≥ 4 years) |
| Safety-driven siting restrictions | −0.5 pp | US, EU, UK, South Korea | Medium term (2–4 years) |
| Degradation and augmentation costs | −0.4 pp | China, US, EU, Australia | Long term (≥ 4 years) |
| Duration and utilization mismatch | −0.4 pp | US, EU, India, Japan | Long term (≥ 4 years) |
Opportunity Analysis
Contracted Long-Duration Packages — +0.7 Percentage Points
The opportunity is to convert technically promising long-duration systems into repeatable, contract-backed offerings for customers whose reliability requirements exceed conventional short-duration applications—not simply extrapolate existing battery deployment. DOE defines long-duration storage as systems delivering electricity for at least ten hours and describes demonstration programs intended to resolve technical and institutional barriers; its January 2025 Storage Shot document targets a 90% cost reduction for ten-hour-plus systems within the decade, which is an ambition rather than an achieved commercial cost.
In a constructed 50 MW/600 MWh twelve-hour project, an assumed installed-system cost of USD 150/kWh produces USD 90 million of procurement. Annualized capital recovery at 10% is USD 9 million; adding USD 1.5 million of fixed operating expense creates a USD 10.5 million annual requirement before charging energy, variable maintenance and tax. At 100 complete discharges annually, delivered energy is 60,000 MWh, implying USD 175/MWh for those fixed components alone. A customer may still justify that cost through documented reliability or capacity value, but inexpensive equipment does not automatically produce a financeable project.
The +0.7-point sensitivity assumes 15% of baseline terminal revenue is exposed to newly commercialized long-duration applications and achieves approximately 22% cumulative outperformance, adding 3.3% market-wide terminal revenue. Strategic value lies in performance guarantees, standardized engineering, credible completion support and durable offtake; contracts must match the actual duty cycle, and announced demonstrations are not counted as sales before funded procurement.
Opportunity Impact Analysis
| Opportunity | (~) % Potential CAGR Upside | Geographic Relevance | Execution Window |
|---|---|---|---|
| Contracted long-duration packages | +0.7 pp | US, UK, Australia, India | Long term (≥ 4 years) |
| Industrial heat-service platforms | +0.6 pp | EU, US, China, India | Medium term (2–4 years) |
| Retired-plant storage conversions | +0.5 pp | US, Germany, UK, Australia | Medium term (2–4 years) |
| Storage-as-a-service portfolios | +0.5 pp | US, Germany, Japan, Australia | Medium term (2–4 years) |
| Lifecycle repowering packages | +0.4 pp | US, China, EU, Australia | Short term (≤ 2 years) |
| Capability-led acquisition platforms | +0.3 pp | US, Germany, UK, Singapore | Short term (≤ 2 years) |
Challenges Analysis
Multi-System Control Validation — −0.5 Percentage Points
The technical vulnerability is inconsistent behavior between storage-management software, converters, protection, auxiliary systems and plant controllers, requiring repeated validation as equipment and firmware change. NERC’s grid-forming specification white paper recommends validating actual converter-level controls and protection against disturbances, including transitions from charging to discharging, and obtaining manufacturer confirmation that models represent the expected installed configuration; these are technical recommendations, not a universal legal requirement for every storage system.
NERC’s January 2026 reliability assessment likewise treats both charging and discharging behavior as relevant to storage integration studies. In a constructed twenty-project battery-storage portfolio, three additional validation iterations per project at 300 engineering-hours each create 18,000 hours of work; at USD 120 per hour, incremental engineering cost is USD 2.16 million. Additional hardware-in-the-loop or site testing costing USD 100,000 on six projects raises unplanned delivery expenditure to USD 2.76 million. Across USD 100 million of fixed-price contracts initially budgeted at a 20% gross margin, absorbing that expense reduces margin to approximately 17.2% before other overruns.
The −0.5-point sensitivity assumes 25% of terminal opportunity-enabled revenue is control-validation-ensitive and suffers a 9.2% realization shortfall, producing approximately 2.3% aggregate terminal friction through delayed acceptance and constrained engineering capacity. Mitigation requires interface ownership, validated models, staged testing and configuration-controlled releases; paid testing offsets supplier losses where contracted, and these battery-specific requirements are not generalized to thermal-storage installations.
Challenges Impact Analysis
| Challenge | (~) % CAGR Friction Drag | Geographic Relevance | Mitigation Horizon |
|---|---|---|---|
| Multi-System Control Validation | −0.5 pp | US, EU, China, Australia | Long term (≥ 4 years) |
| Usable-Energy Inventory Accuracy | −0.4 pp | China, US, EU, Japan | Medium term (2–4 years) |
| Multi-Service Dispatch Coordination | −0.4 pp | US, UK, EU, Australia | Medium term (2–4 years) |
| Safety-Response Workforce Readiness | −0.4 pp | US, EU, India, ASEAN | Long term (≥ 4 years) |
| Configuration and Spare Synchronization | −0.3 pp | China–US, China–EU, Asia–India | Medium term (2–4 years) |
| Contractual Performance Verification | −0.3 pp | US, EU, Australia, India | Medium term (2–4 years) |
Geopolitical Impact Analysis
Geopolitical Impact of the Ongoing War on the Advanced Energy Storage Systems Market
The ongoing Russia-Ukraine war and rising tensions in the Middle East are influencing the Advanced Energy Storage Systems Market by increasing concerns over energy security, supply chain stability, and raw material availability. Disruptions in global trade routes and energy supplies have encouraged governments to strengthen domestic energy infrastructure and reduce dependence on imported fossil fuels. This situation is creating greater interest in battery storage systems that support renewable energy integration, grid stability, and reliable electricity supply.
The conflict has also increased uncertainty around the prices and availability of essential battery materials, including lithium, nickel, and graphite. Higher transportation costs, trade restrictions, and supply chain disruptions can increase battery manufacturing expenses and delay energy storage projects. However, these challenges are also encouraging countries to invest in domestic battery production, recycling, and alternative energy storage technologies.
The International Energy Agency (IEA) reported that battery storage investment is expected to exceed USD 100 billion in 2026, reflecting the growing importance of electricity storage in strengthening energy security. Although geopolitical tensions create short-term cost and supply challenges, they are also encouraging governments to accelerate investments in advanced energy storage systems, diversify energy sources, and build more resilient power infrastructure.
Regional Insights
Dominating Region: Europe (34.23% Share, USD 5.0 Billion)
In 2025, Europe held a dominant position in the Advanced Energy Storage Systems Market, accounting for 34.23% of the market, valued at USD 5.0 billion. The region’s leadership is supported by increasing renewable energy installations, strong government policies, and growing investments in grid modernization. Germany, the United Kingdom, Italy, and France remain important contributors to regional energy storage deployment.
According to SolarPower Europe, Europe installed approximately 36 GWh of new battery energy storage capacity in 2025, taking total operational battery capacity beyond 100 GWh. The European Union also recorded 27.1 GWh of new battery storage installations during 2025, representing a 45% annual increase. Growing solar and wind power generation, energy security concerns, and decarbonization targets continue to encourage utilities and industries to adopt advanced storage solutions.
Utility-scale battery storage is emerging as the fastest-growing segment across Europe due to rising electricity demand, renewable energy integration, and the need for greater grid flexibility. In 2025, utility-scale battery systems accounted for more than 50% of Europe’s newly installed battery storage capacity, reflecting a shift toward large-scale energy storage projects. Germany, Italy, and the United Kingdom are attracting investments through supportive regulatory frameworks, grid balancing requirements, and energy storage incentives.
According to Energy Storage Europe, the region added 13.5 GW of electrochemical storage capacity in 2025, while installed energy storage capacity across all technologies reached 102.7 GW. In 2026, further deployment is expected to be supported by renewable energy expansion, hybrid solar-plus-storage projects, and increasing demand for reliable electricity infrastructure.
Key Regions and Countries Insights
- North America
- US
- Canada
- Europe
- Germany
- France
- The UK
- Spain
- Italy
- Rest of Europe
- Asia Pacific
- China
- Japan
- South Korea
- India
- Australia
- Rest of APAC
- Latin America
- Brazil
- Mexico
- Rest of Latin America
- Middle East & Africa
- GCC
- South Africa
- Rest of MEA
Key Players Analysis
Tesla Inc. is a major player in the Advanced Energy Storage Systems Market, offering utility-scale Megapack and residential Powerwall solutions. In 2025, Tesla recorded 46.7 GWh of total energy storage deployments, reflecting strong demand for battery storage products. During the fourth quarter of 2025, deployments reached 14.2 GWh, marking a quarterly record. The company focuses on battery innovation, energy management software, and large-scale storage installations to support renewable energy integration and grid stability.
GE Vernova strengthens its position in the Advanced Energy Storage Systems Market through its Power Conversion & Storage business, which delivers solutions for utilities and industrial customers. In 2025, the company reported total annual revenue of USD 38.1 billion, while its Power Conversion & Storage segment generated USD 2.049 billion in revenue. Its Electrification segment recorded USD 34.667 billion in remaining performance obligations, reflecting growing demand for grid modernization and energy storage technologies.
ABB Ltd. is a prominent technology provider in the Advanced Energy Storage Systems Market, focusing on electrification, automation, power conversion, and grid integration solutions. In 2025, ABB reported USD 33.22 billion in revenue and USD 36.765 billion in orders. The company invested USD 1.318 billion in research and development, supporting innovation in energy efficiency, electrical infrastructure, and advanced power technologies. ABB’s solutions help utilities and industries improve power reliability and integrate renewable energy into existing networks.
Top Key Players Outlook
- Tesla Inc
- GE Vernova
- ABB Ltd.
- Samsung SDI Co., Ltd.
- LG Energy Solution
- Siemens AG
- Panasonic Corporation
- BYD Co. Ltd.
- Hitachi Energy
- Saft Groupe S.A.
- The Scoular Company
- Other Key Players
Recent Developments
- In February 2026, Samsung SDI reported annual 2025 revenue of KRW 13.27 trillion (USD 9.28 billion), while its fourth-quarter ESS battery sales achieved a record high.
- In October 2026, LG Energy Solution signed a memorandum of understanding with Energix to explore approximately 2 GWh of energy storage supply across Europe and the United States over 24 months, with potential expansion to 4.5 GWh.
Report Scope
| Report Features | Description |
|---|---|
| Market Value (2025) | USD 20.9 Bn |
| Forecast Revenue (2035) | USD 54.2 Bn |
| CAGR (2026-2035) | 10.0% |
| Base Year for Estimation | 2025 |
| Historic Period | 2020-2024 |
| Forecast Period | 2026-2035 |
| Report Coverage | Revenue Forecast, Market Dynamics, Competitive Landscape, Recent Developments |
| Segments Covered | By Technology (Electro Chemical, Mechanical, Thermal Storage), By Application (Transportation, Grid Storage), By End User (Residential, Industrial, Commercial, Utilities) |
| Regional Analysis | North America – US, Canada; Europe – Germany, France, The UK, Spain, Italy, Rest of Europe; Asia Pacific – China, Japan, South Korea, India, Australia, Singapore, Rest of APAC; Latin America – Brazil, Mexico, Rest of Latin America; Middle East & Africa – GCC, South Africa, Rest of MEA |
| Competitive Landscape | Tesla Inc, GE Vernova, ABB Ltd., Samsung SDI Co., Ltd., LG Energy Solution, Siemens AG, Panasonic Corporation, BYD Co. Ltd., Hitachi Energy, Saft Groupe S.A., The Scoular Company, Other Key Players |
| Customization Scope | Customization for segments, region/country-level will be provided. Moreover, additional customization can be done based on the requirements. |
| Purchase Options | We have three licenses to opt for: Single User License, Multi-User License (Up to 5 Users), Corporate Use License (Unlimited User and Printable PDF) |