


Report Overview
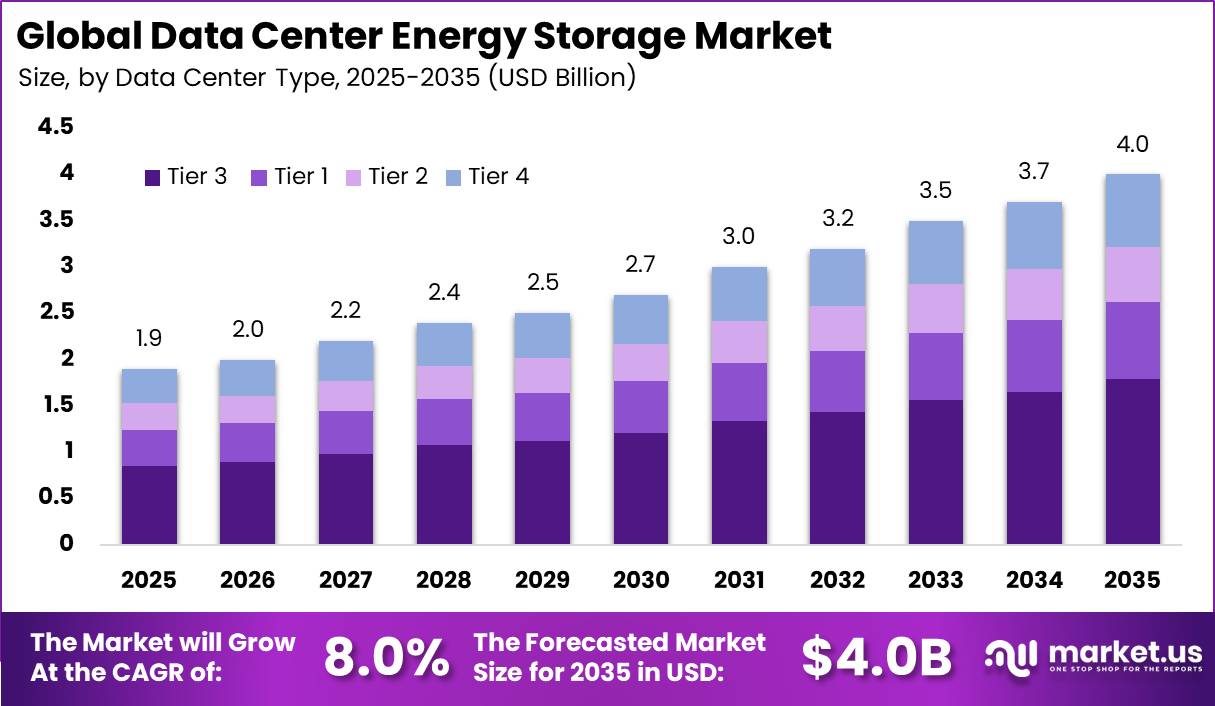
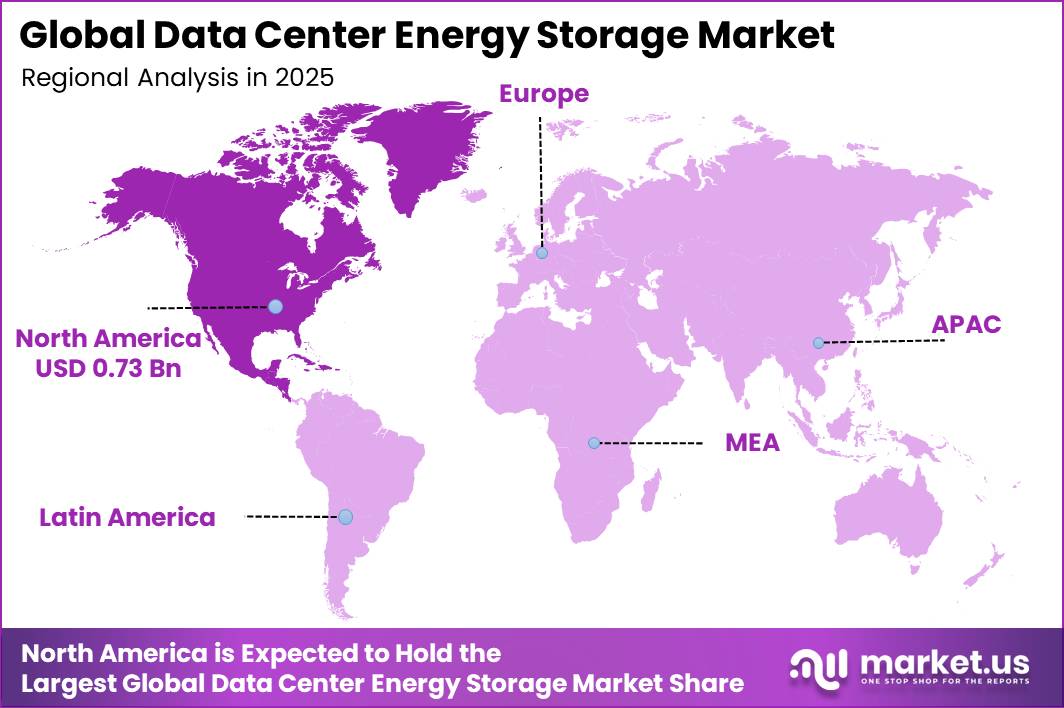
In 2025, the Global Data Center Energy Storage Market was valued at USD 1.9 billion. The market is projected to grow at a CAGR of 8.0% during 2026–2035, reaching approximately USD 4.0 billion by 2035. North America dominated the global market in 2025, accounting for more than 38.2% of the total market share and generating approximately USD 0.73 billion in revenue.
Growth is being supported by rising electricity demand from AI servers, cloud platforms, storage systems, and high-speed networks. According to the IEA, global data centres consumed about 415 TWh of electricity in 2024, equal to 1.5% of global electricity use, after increasing at 12% annually during the previous 5 years.
Demand is expected to reach around 945 TWh by 2030, or just under 3% of global electricity consumption, with annual growth of nearly 15% during 2024–2030. AI-accelerated servers alone could increase electricity use by about 30% annually and contribute almost half of total demand growth. Servers account for around 60% of facility electricity use, while cooling represents about 7% in efficient hyperscale facilities and more than 30% in less-efficient enterprise centres.
U.S. data-centre electricity use increased from around 60 TWh in 2014–2016 to 76 TWh in 2018 and 176 TWh in 2023, a 131.6% rise in 5 years, representing 4.4% of U.S. electricity use. Demand could reach 325–580 TWh by 2028, equal to 6.7%–12.0% of U.S. electricity use, with 74–132 GW of operating load at 50% utilisation. The 2030 reference case reaches 649 TWh, within a 521–843 TWh range.
Key Takeaway
- The Data Center Energy Storage Market was valued at USD 1.9 billion in 2025 and is forecast to reach USD 4.0 billion by 2035, growing at a CAGR of 8.0%.
- Tier 3 facilities held the largest data-centre type share at 44.7% in 2025, favoured for their reliability-to-cost balance.
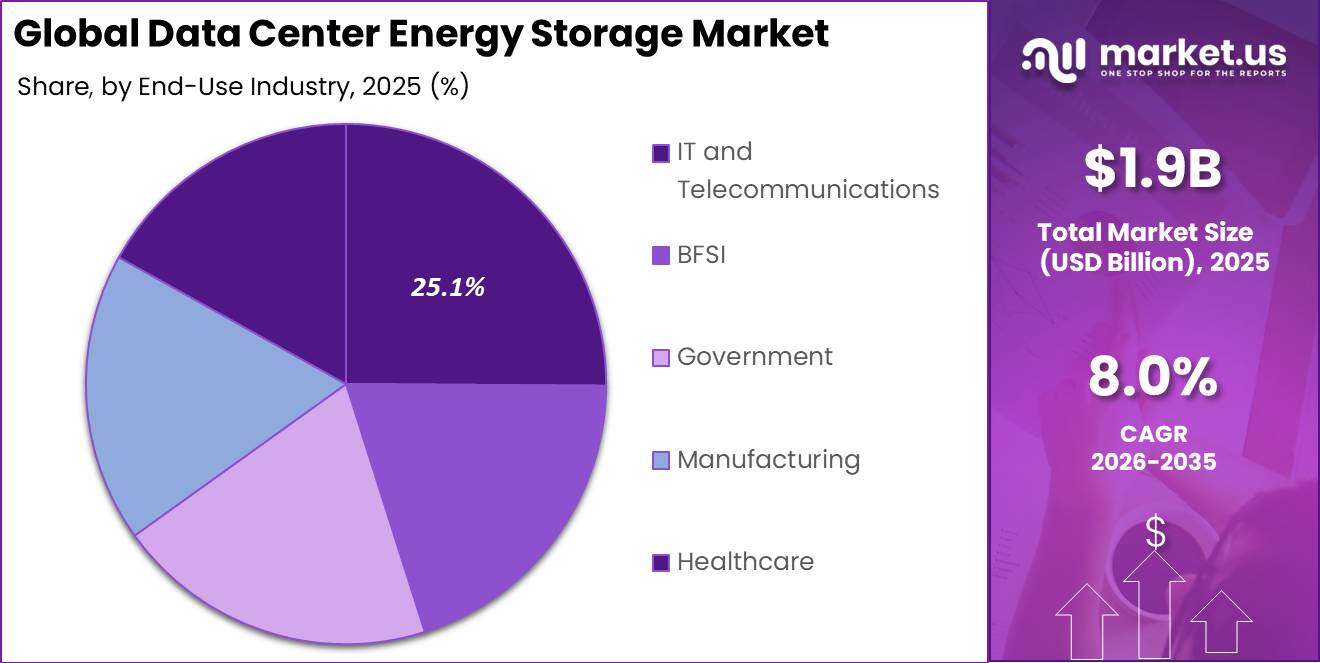
- IT and Telecommunications was the leading end-use segment in 2025, with a 25.1% share.
- North America led the market in 2025 with a 38.2% share and approximately USD 0.73 billion in revenue.
By Data Center Type
In 2025, Tier 3 held a dominant position in the Data Center Energy Storage Market, capturing a 44.7% share. Its leadership comes from offering a strong balance between system reliability and investment cost, making it suitable for enterprise, cloud, colocation, financial, healthcare, and public-sector data centres.
This setup requires redundant power paths and N+1 capacity, which increases demand for UPS batteries, battery energy-storage systems, switchgear, and backup generators. Tier 3 facilities target 99.98% availability, limiting downtime to about 1.6 hours per year. The need for reliable energy storage is also supported by outage risks.
Uptime Institute’s 2025 survey showed that 50% of operators experienced at least 1 significant outage during the previous 3 years, while 1 in 5 major outages resulted in costs above USD 1 million. Power-related failures were responsible for 45% of reported impactful outages in 2025.
By End-Use Industry
In 2025, IT and Telecommunications held a dominant position in the Data Center Energy Storage Market, capturing a 25.1% share. The segment leads because telecom and IT services require continuous power for data processing, storage, cloud hosting, content delivery, and network operations.
According to the ITU, around 5.5 billion people were online in 2024, while global fixed-broadband traffic reached 6 zettabytes and mobile-broadband traffic approached 1.3 zettabytes. The world also recorded 112 mobile-cellular subscriptions per 100 inhabitants and 95 mobile-broadband subscriptions per 100 inhabitants.
The World Bank reported that high-income economies accounted for 72% of connected data centres in 2022, showing the scale of installed digital infrastructure. At the same time, 5G coverage has expanded to more than half of the global population and represents more than one-third of mobile broadband.
Key Market Segments
By Data Center Type
- Tier 1
- Tier 2
- Tier 3
- Tier 4
By End-Use Industry
- IT and Telecommunications
- BFSI
- Government
- Manufacturing
- Healthcare
- Other End-Use Industries
Geopolitical Impact Analysis
Geopolitical risks are increasing both cost pressure and supply uncertainty in the Data Center Energy Storage Market, especially for lithium-ion UPS batteries and large battery energy-storage systems. According to the IEA, China produced around 80% of global battery cells in 2024, about 85% of cathode active materials, and more than 90% of anode active materials.
China also refined nearly 65% of global lithium and more than 90% of graphite. In addition, over 98% of lithium-iron-phosphate cathode material and LFP cells are produced in China. This heavy concentration makes data-centre projects in North America, Europe, India, and the Middle East more exposed to trade restrictions, export controls, currency movements, and shipment delays.
Any disruption in battery cells, modules, battery-management systems, or power-conversion equipment can increase project costs and extend installation schedules. Shipping disruption is adding another layer of risk. UNCTAD reported that by mid-February 2024, container tonnage through the Suez Canal had fallen 82%, while transit volumes through both the Suez and Panama canals were more than 40% below their peaks.
Rerouting vessels around the Cape of Good Hope can add roughly 10–14 days to Asia-Europe shipping routes, increasing fuel, insurance, container, and inventory costs. Battery cells are also classified as hazardous goods, making transport and handling more complex. The World Bank projected its commodity-price index to decline 5% in 2025 and another 2% in 2026, but trade tensions and conflicts remain key upside risks.
Regional Analysis
North America led the global Data Center Energy Storage Market with a 38.2% share, generating approximately USD 0.73 billion in revenue. The region benefits from a large base of hyperscale, cloud, colocation, enterprise, and telecom data centres, particularly in the United States. Lawrence Berkeley National Laboratory reported that U.S. data centres consumed around 192 TWh of electricity in 2024, equal to 4.7% of national electricity use.
In the reference case, this share could increase to 11.8% by 2030, with possible outcomes ranging from 9.5% to 15.3%. The IEA also estimates that data-centre expansion could contribute around 50% of total U.S. electricity-demand growth through 2030.
Asia Pacific is expected to be the fastest-growing regional market, supported by expanding cloud services, AI investment, 5G deployment, and new data-centre construction across major Asian economies. According to the IEA, Southeast Asia already accounts for around 10% of Asia-Pacific data-centre electricity demand.
Regional electricity consumption increased by more than 7% in 2024, compared with around 4% in 2023. This rapid growth is creating stronger demand for on-site energy storage to protect critical IT loads, manage short-duration power fluctuations, and support renewable-energy integration.
Key Regions and Countries
North America
- US
- Canada
Europe
- Germany
- France
- The UK
- Spain
- Italy
- Rest of Europe
Asia Pacific
- China
- Japan
- South Korea
- India
- Australia
- Rest of APAC
Latin America
- Brazil
- Mexico
- Rest of Latin America
Middle East & Africa
- GCC
- South Africa
- Rest of MEA
Market Dynamics
Drivers
| Driver | (~) % CAGR | Geographic Relevance | Impact Timeline |
|---|---|---|---|
| AI computing load expansion | +2.0% | Global; strongest in North America, China and Europe | Short term (2 years or less) |
| Cloud resilience requirements | +1.3% | Global | Short term (2 years or less) |
| Grid-interactive storage adoption | +1.0% | North America and Europe | Medium term (2 to 4 years) |
| High-density rack deployment | +0.9% | Global hyperscale hubs | Short term (2 years or less) |
| Telecom edge expansion | +0.6% | Asia Pacific, Middle East and Africa | Medium term (2 to 4 years) |
AI computing load expansion
AI-focused data-centre construction is increasing demand for high-power UPS and battery energy-storage systems as operators need to protect dense server loads from even short power interruptions. Global data-centre electricity consumption increased 17% in 2025, compared with only 3% growth in overall electricity demand.
AI-focused facilities are also expected to triple their electricity use by 2030, creating stronger demand for fast-response backup power and energy-storage capacity. In the U.S., data centres could account for 11.8% of national electricity consumption by 2030.
On-site battery storage can provide immediate backup during grid failures, support peak-load management, and improve grid flexibility. This rising power requirement could contribute an estimated +2.0% incremental upside to the market’s 8.0% baseline CAGR, while also improving equipment utilisation and service revenue for integrated power-system suppliers.
Restraints
| Restraint | (~) % CAGR | Geographic Relevance | Impact Timeline |
|---|---|---|---|
| Grid connection moratoria | -1.6% | Europe and major U.S. hubs | Medium term (2 to 4 years) |
| High project financing cost | -0.8% | Global | Short term (2 years or less) |
| Utility capacity limits | -0.7% | North America and Europe | Medium term (2 to 4 years) |
| Permitting and land limits | -0.5% | Major metropolitan data-centre hubs | Medium term (2 to 4 years) |
| Battery import exposure | -0.4% | North America and Europe | Short term (2 years or less) |
Grid connection moratoria
Grid connection constraints are an immediate restraint because a data-centre project cannot install or commission its full UPS and battery-storage system until an energised grid connection is secured. The IEA reported in 2026 that European grid-connection waits range from 2 to 10 years, while data-centre developers in Frankfurt, London, Amsterdam, Paris and Dublin face average queues of 7 to 10 years.
The European Union Agency for the Cooperation of Energy Regulators estimated direct grid-congestion costs at €4.3 billion in 2024, excluding the wider cost of delayed investment. The IEA notes that transmission projects in advanced economies commonly require 4 to 8 years, compared with much shorter data-centre construction cycles.
Challenges
| Challenge | (~) % CAGR | Geographic Relevance | Mitigation Horizon |
|---|---|---|---|
| Battery supply concentration | -1.2% | Global | Long term (4 years or more) |
| Transformer delivery constraints | -0.9% | North America and Europe | Medium term (2 to 4 years) |
| Thermal safety compliance | -0.6% | Global | Medium term (2 to 4 years) |
| Skilled power workforce gap | -0.5% | Global | Long term (4 years or more) |
| Cybersecurity integration risk | -0.3% | Global | Short term (2 years or less) |
Battery supply concentration
Battery supply concentration remains a major challenge for data-centre energy storage because key components depend heavily on Asian supply chains. China produced 80% of global battery cells in 2024, more than 90% of anode materials, and around 85% of cathode active materials.
China also accounted for more than 98% of global LFP cathode-material and LFP-cell production, while trade and tariff actions across more than 170 economies add procurement uncertainty. Higher sourcing, qualification, and validation costs could reduce project margins and create an estimated -1.2% friction drag on maximum market growth.
Opportunities
| Opportunity | (~) % CAGR | Geographic Relevance | Execution Window |
|---|---|---|---|
| Storage-as-a-service contracts | +1.5% | North America, Europe and Asia Pacific | Medium term (2 to 4 years) |
| Second-life battery integration | +1.1% | Europe, China and North America | Long term (4 years or more) |
| Behind-the-meter grid services | +1.0% | North America and deregulated power markets | Medium term (2 to 4 years) |
| Modular edge power systems | +0.8% | Asia Pacific, Latin America and Africa | Medium term (2 to 4 years) |
| Long-duration storage hybridisation | +0.6% | Renewable-rich electricity markets | Long term (4 years or more) |
Storage-as-a-service contracts
Storage-as-a-service offers a strong opportunity as most data-centre operators still purchase UPS batteries and energy-storage systems as capital equipment. Data-centre electricity demand increased 17% in 2025, increasing the value of storage systems that combine backup power, demand management, and grid-response services.
Global battery-manufacturing capacity is expected to exceed 4 TWh by the end of 2025, around 30% higher than in 2024, improving supply and lowering deployment costs. Subscription-based monitoring, maintenance, and capacity guarantees could create recurring revenue for suppliers and potentially add around +1.5% upside to the market’s 8.0% baseline CAGR.
Key Players Analysis
Tier-1 companies such as Schneider Electric, Eaton, Vertiv, ABB, Delta Electronics, and Huawei are expected to hold a major position in the Data Center Energy Storage Market because they provide UPS systems, power distribution, cooling, digital monitoring, and grid-connected storage solutions.
Schneider Electric reported FY2025 revenue of €40.15 billion, with organic growth of 8.9%, while Data Center & Networks represented 30% of Energy Management revenue. Its R&D cash spending reached 5.9% of FY2024 sales. Eaton recorded USD 27.4 billion in 2025 sales, including USD 13.2 billion from Electrical Americas, while capital expenditure reached USD 919 million.
Vertiv generated about USD 8.0 billion in 2024 sales, up 17%, and spent USD 441.7 million on engineering and R&D in 2025. Together, leading suppliers are estimated to represent around 45%–55% of global data-centre energy-storage spending, although this remains an analyst estimate.
ABB generated USD 33.2 billion in 2025 revenue, including USD 17.3 billion from Electrification, up 12% year on year. Data centres represented 14% of Electrification revenue, implying about USD 2.4 billion. ABB invested USD 1.32 billion, or 4.0% of revenue, in R&D.
Delta’s 2025 revenue increased 32% to NT$554.9 billion, while R&D spending was about NT$48.7 billion, equal to 8.8% of revenue. Mitsubishi Electric reported FY2025 revenue of ¥5,521.7 billion, R&D spending of ¥228.8 billion, and Energy Systems revenue of ¥396.1 billion.
Top Key Players in the Market
- Schneider Electric SE
- Eaton Corporation PLC
- Mitsubishi Electric Corporation
- ABB Group
- Vertiv Group Corporation
- Delta Electronics, Inc.
- Toshiba Corporation
- Legrand Group
- Huawei Technologies Co., Ltd.
- Fuji Electric Co., Ltd.
Recent Developments
- In 2026, Schneider Electric launched a new multi-chemistry APC Smart-UPS for data centres and edge IT. The system provides up to 3× higher base runtime, 1.4× greater power density, and 57% more outlets than previous models, improving flexibility for backup-energy deployments.
- In 2025, Eaton completed the acquisition of Fibrebond Corporation to strengthen its modular power solutions. Eaton completed the USD 1.4 billion acquisition of Fibrebond, a provider of pre-integrated power enclosures for data centres and other critical infrastructure. Fibrebond was expected to generate about USD 110 million in adjusted EBITDA in 2025.
Report Scope
| Report Features | Description |
|---|---|
| Market Value (2025) | USD 1.9 Billion |
| Forecast Revenue (2035) | USD 4.0 Billion |
| CAGR (2026-2035) | 8.0% |
| Base Year for Estimation | 2025 |
| Historic Period | 2020-2024 |
| Forecast Period | 2026-2035 |
| Report Coverage | Revenue Forecast, Market Dynamics, Competitive Landscape, Recent Developments |
| Segments Covered | By Data Center Type (Tier 1, Tier 2, Tier 3, Tier 4), By End-Use Industry (IT and Telecommunications, BFSI, Government, Manufacturing, Healthcare, Other End-Use Industries) |
| Regional Analysis | North America – US, Canada; Europe – Germany, France, The UK, Spain, Italy, Rest of Europe; Asia Pacific – China, Japan, South Korea, India, Australia, Singapore, Rest of APAC; Latin America – Brazil, Mexico, Rest of Latin America; Middle East & Africa – GCC, South Africa, Rest of MEA |
| Competitive Landscape | Schneider Electric SE, Eaton Corporation PLC, Mitsubishi Electric Corporation, ABB Group, Vertiv Group Corporation, Delta Electronics, Inc., Toshiba Corporation, Legrand Group, Huawei Technologies Co., Ltd., Fuji Electric Co., Ltd. |
| Customization Scope | Customization for segments, region/country-level will be provided. Additional customization can be done based on requirements. |
| Purchase Options | We have three licenses to opt for: Single User License, Multi-User License (Up to 5 Users), Corporate Use License (Unlimited Users and Printable PDF) |





























