


Report Overview
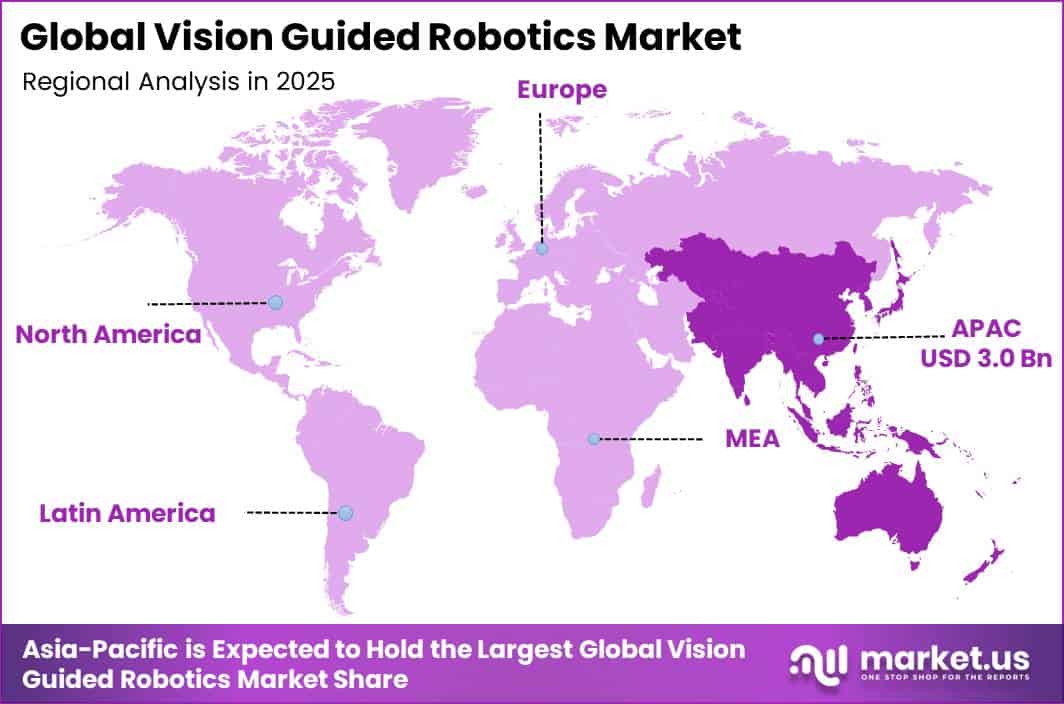
In 2025, the Global Vision Guided Robotics Market was valued at USD 8.1 billion. The market is projected to grow at a CAGR of 10.1% during 2026–2035, reaching approximately USD 21.3 billion by 2035. Asia-Pacific dominated the global market in 2025, accounting for more than 37% of the total market share and generating approximately USD 3.0 billion in revenue.
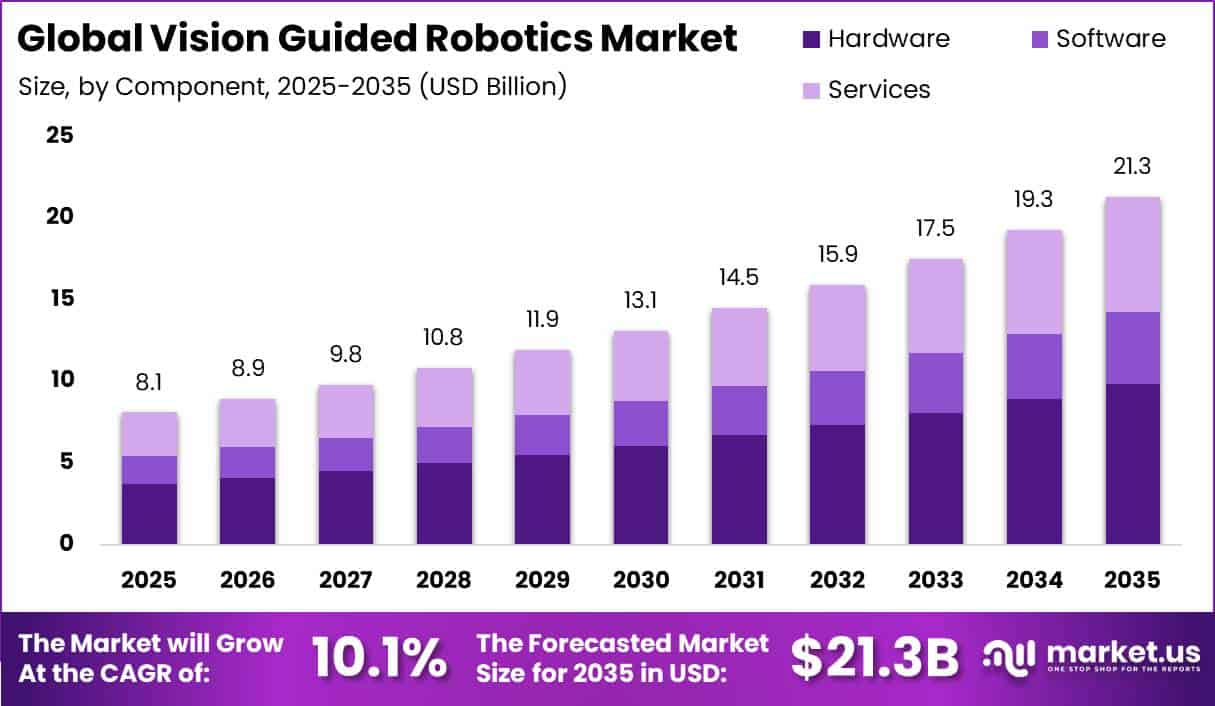
Market growth is supported by increasing factory automation, as manufacturers use vision-guided robots for inspection, picking, sorting, assembly, and material handling. These systems combine robotic arms, cameras, sensors, and software to detect the position, shape, and quality of objects before completing a task.
In 2024, global industrial robot installations reached 542,076 units, while annual installations remained above 500,000 units for 4 consecutive years. The worldwide operating stock increased to 4.6 million robots, representing 9% year-on-year growth. This expanding robot base is creating stronger demand for machine-vision systems, image-processing software, sensors, integration services, and equipment upgrades.
Asia-Pacific region installed 401,665 industrial robots in 2024, equal to 74% of global deployments. China installed 295,045 units, representing 54% of the global total. Manufacturing activity also supports demand, with Asia-Oceania producing 54.9 million vehicles in 2024. China produced 27.5 million passenger cars, while India produced 5.0 million.
Key Takeaway
- The Vision Guided Robotics Market valued at USD 8.1 billion in 2025, projected to reach USD 21.3 billion by 2035 at a 10.1% CAGR.
- Hardware led the component segment with a 46.2% share, driven by demand from semiconductor manufacturing.
- 2D-vision System Robots held a dominant 57.9% share due to lower cost and faster deployment.
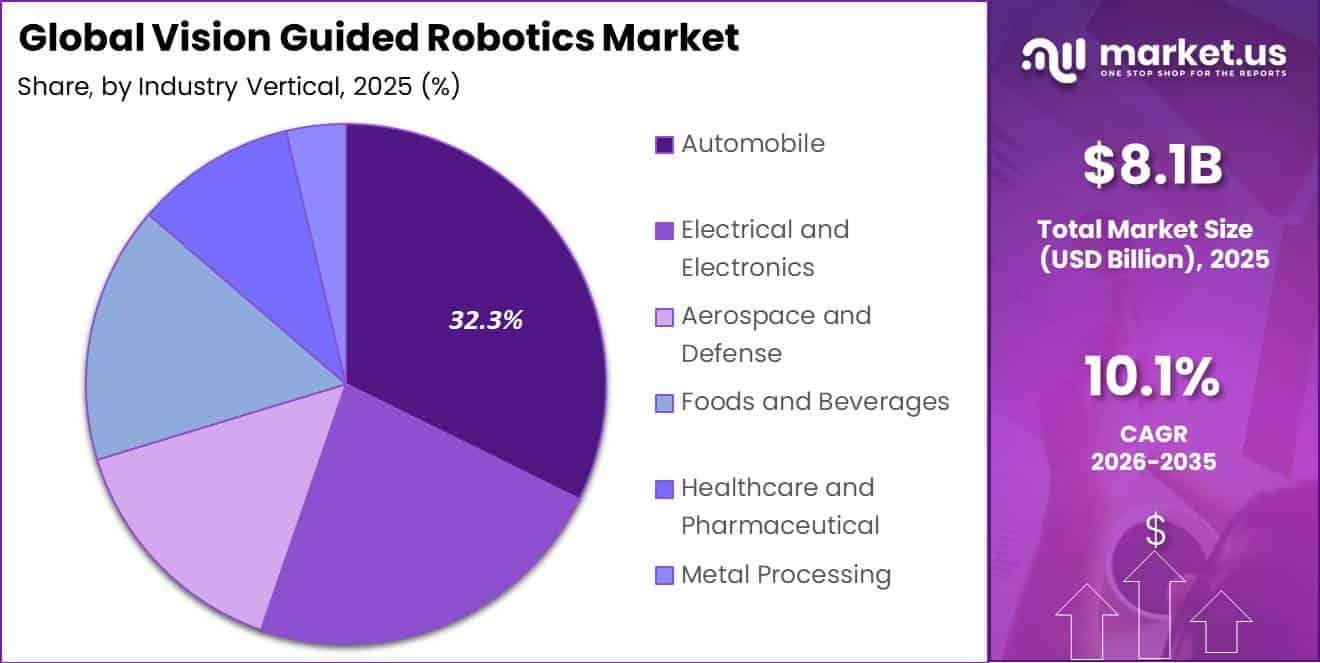
- The Automobile Industry led industry-vertical demand with a 32.3% share, driven by EV production growth.
- Asia-Pacific led the market in 2025 with more than 37% share, worth approximately USD 3.0 billion.
By Component
Hardware held a leading position in the vision-guided robotics market, accounting for a 46.2% share, as every robotic vision system requires physical equipment before software can perform its functions. A standard system includes industrial cameras, lenses, lighting, 2D or 3D sensors, processors, robot controllers, grippers, safety devices, and robotic arms.
Global semiconductor manufacturing-equipment sales increased 10% to USD 117.1 billion in 2024. Within this market, assembly and packaging equipment sales grew 25%, while test-equipment billings increased 20%. New production and testing lines require cameras, optics, sensors, lighting, and processing units for accurate inspection. Manufacturing also represents 62% of machine-vision component sales.
By Type
The 2D-vision system robots segment held a dominant position in the vision-guided robotics market with a 57.9% share, supported by its lower cost, simple setup, and fast deployment across high-volume manufacturing and warehouse operations. A 2D camera captures flat images that help robots read labels, verify barcodes, inspect surface defects, sort products, and guide pick-and-place activities.
These systems work well when products move at a fixed height and orientation, reducing the need for more expensive 3D depth sensors and complex programming. Demand is also supported by the rapid growth of e-commerce and fulfilment operations. U.S. e-commerce sales reached USD 289.2 billion in the first quarter of 2024, increasing 8.6% year on year and accounting for 15.9% of total retail sales.
Higher online order volumes increase the need for fast product identification, carton routing, barcode verification, and automated sorting. The use of mature cameras, lenses, lighting, and image-processing tools allows 2D vision systems to deliver reliable performance at a lower integration cost, supporting their strong adoption across repetitive inspection, packaging, sorting, and material-handling applications.
By Industry Vertical
The Automobile Industry held a leading position in the vision-guided robotics market with a 32.3% share, driven by the need for high accuracy and consistent quality across vehicle production. Automotive plants use vision-guided robots for welding, painting, assembly, inspection, battery installation, and component handling.
Global electric-car production reached 17.3 million units in 2024, around 25% higher than in 2023, while China produced 12.4 million units. These production volumes require inspection and quality checks at several stages of manufacturing. High-speed automotive production lines further support automation, as manual inspection can be slower and less consistent.
Key Market Segments
By Component
- Hardware
- Software
- Services
By Type
- 2D-Vision System Robots
- 3D-Vision System Robots
By Industry Vertical
- Automobile
- Electrical and Electronics
- Aerospace and Defense
- Foods and Beverages
- Healthcare and Pharmaceutical
- Metal Processing
Geopolitical Impact Analysis
Geopolitical disruptions are increasing delivery times and overall costs across the vision-guided robotics market, which depends heavily on global supplies of industrial cameras, CMOS image sensors, semiconductors, optics, servo drives, permanent magnets, controllers, and precision metal parts. Red Sea tensions have affected major shipping routes, with average daily Suez Canal transits falling to 33 by mid-October 2024, around 57% below the earlier peak.
Vessel tonnage passing through the canal was also about 70% below the 2023 average in early May 2025. Ships diverted around the Cape of Good Hope face longer Asia-Europe routes, increasing freight, insurance, inventory, and warehousing costs. Robotics suppliers may therefore need larger buffer stocks of cameras, lenses, motors, and control boards, raising installation and project costs.
Trade restrictions are adding further supply-chain pressure. China restricted exports of gallium, germanium, and antimony to the United States in December 2024 and introduced controls covering 7 heavy rare-earth elements in 2025. More than 50% of energy-related minerals were also subject to some form of export control.
Meanwhile, U.S. Section 301 tariffs on Chinese semiconductors increased to 50% in 2025, raising costs for affected chips used in cameras, processors, and robot controllers. Although the World Bank projected energy prices to decline 17% and metals and minerals prices to fall 10% in 2025, these savings may be offset by tariffs and logistics costs. WTO estimated global merchandise trade could decline 0.2%, with a downside risk of 1.5% if trade tensions worsen.
Regional Analysis
Asia-Pacific dominated the Vision Guided Robotics Market in 2025, holding more than 37% of global revenue, equal to approximately USD 3.0 billion. The region benefits from its large manufacturing base, strong electronics industry, growing electric-vehicle supply chain, and continuous investment in factory automation.
China had more than 2 million industrial robots operating in factories by 2024, creating strong demand for cameras, sensors, controllers, optics, and system upgrades. Japan installed nearly 44,500 robots in 2024, while South Korea added around 30,000 units. The region also supports widespread use of 2D vision systems, while semiconductor and battery plants are increasing demand for advanced 3D vision systems.
North America is expected to be the fastest-growing regional market, supported by reshoring, supply-chain localization, and new manufacturing investments. The United States had 393,700 industrial robots operating in 2024, up 3% year on year. Automotive companies installed 13,600 robots, increasing 11%, while food and beverage installations rose 21% to 2,200 units.
U.S. industrial robot installations further increased 11% to 38,000 units in 2025, strengthening demand for flexible vision-guided automation across manufacturing, logistics, food processing, electronics, and automotive operations.
Key Regions and Countries
- North America
- US
- Canada
- Europe
- Germany
- France
- The UK
- Spain
- Italy
- Rest of Europe
- Asia Pacific
- China
- Japan
- South Korea
- India
- Australia
- Rest of APAC
- Latin America
- Brazil
- Mexico
- Rest of Latin America
- Middle East & Africa
- GCC
- South Africa
- Rest of MEA
Market Dynamics
Drivers
| Driver | (~) % CAGR | Geographic Relevance | Impact Timeline |
|---|---|---|---|
| Automotive automation demand | +2.2% | Global | Short term (2 years or less) |
| Electronics quality inspection | +1.8% | Asia-Pacific | Short term (2 years or less) |
| Flexible production cells | +1.4% | North America and Europe | Medium term (2 to 4 years) |
| Warehouse throughput automation | +1.1% | North America and Asia-Pacific | Medium term (2 to 4 years) |
| Edge AI inspection | +0.9% | Global | Medium term (2 to 4 years) |
Automotive automation demand
Automotive production remains the largest demand driver for vision-guided robotics because camera-guided systems improve accuracy in welding, dispensing, inspection, traceability, and battery assembly. Automotive manufacturers installed 135,461 industrial robots globally in 2023, equal to 30% of annual installations.
Global electric-car production reached 17.3 million units in 2024, about 25% higher than in 2023, while total motor-vehicle production reached around 92.5 million units. This production scale supports an estimated +2.2% contribution to the market’s 10.1% CAGR, while also increasing demand for hardware, software calibration, and service contracts.
Restraints
| Restraint | (~) % CAGR | Geographic Relevance | Impact Timeline |
|---|---|---|---|
| Capital expenditure deferrals | -1.8% | Europe and North America | Short term (2 years or less) |
| Semiconductor import tariffs | -1.3% | United States | Short term (2 years or less) |
| High integration costs | -1.1% | Global small and medium manufacturers | Medium term (2 to 4 years) |
| Factory-floor funding limits | -0.8% | Emerging markets | Medium term (2 to 4 years) |
| Safety approval delays | -0.6% | Europe and North America | Short term (2 years or less) |
Capital expenditure deferrals
Capital expenditure deferrals remain a key restraint because vision-guided robotics is usually purchased through large automation projects. WTO projected global merchandise trade volume to decline by 0.2% in 2025, while the World Bank expected its global commodity-price index to fall by about 5%, indicating weaker industrial investment conditions.
Industrial robot installations in the electronics sector fell to around 82,000 units in 2024, showing softer spending from a major robotics customer base. These conditions could reduce the market’s 10.1% CAGR by an estimated -1.8%, as manufacturers delay projects, negotiate lower prices, and shift spending toward retrofits, maintenance, and phased automation deployments.
Challenges
| Challenge | (~) % CAGR | Geographic Relevance | Mitigation Horizon |
|---|---|---|---|
| Component supply concentration | -1.5% | Global | Medium term (2 to 4 years) |
| Systems integration skills | -1.2% | Global | Long term (4 years or more) |
| Variable-part recognition | -1.0% | Global | Medium term (2 to 4 years) |
| Cybersecurity compliance burden | -0.7% | Europe and North America | Medium term (2 to 4 years) |
| Multi-vendor interoperability | -0.6% | Global | Medium term (2 to 4 years) |
Component supply concentration
Component supply concentration remains a major challenge because industrial cameras, processors, rare-earth magnets, servo drives, and optics depend on complex international supply chains. Suez Canal ship-tonnage transits were about 70% below the 2023 average by early May 2025, increasing delivery times and logistics costs for robotics components.
Demand for nickel, cobalt, graphite, and rare earths increased by 6% to 8% in 2024, while China introduced export controls on 7 heavy rare-earth elements in 2025. These disruptions could create an estimated -1.5% drag on attainable CAGR by increasing procurement delays, safety-stock needs, and component costs, encouraging manufacturers to diversify suppliers and regionalize inventories.
Opportunities
| Opportunity | (~) % CAGR | Geographic Relevance | Execution Window |
|---|---|---|---|
| Robotics-as-a-service adoption | +2.0% | North America and Europe | Medium term (2 to 4 years) |
| Food-grade inspection cells | +1.6% | Global | Medium term (2 to 4 years) |
| Battery recycling automation | +1.4% | Europe, China and North America | Long term (4 years or more) |
| Brownfield vision retrofits | +1.2% | Global | Short term (2 years or less) |
| AI inspection subscriptions | +1.0% | Global | Medium term (2 to 4 years) |
Robotics-as-a-service adoption
Robotics-as-a-service remains an emerging opportunity because most vision-guided systems are still sold as upfront capital equipment, limiting adoption among smaller manufacturers. U.S. manufacturing shipments exceeded USD 6 trillion in 2024, while general industry represented 42% of global industrial robot installations in 2023, showing a large potential customer base for flexible, service-based automation.
The World Bank projected energy prices to fall 17% in 2025, which could improve operating economics for service providers managing high-utilization robot fleets. Shifting from upfront purchases to monthly or usage-based fees could reduce customer entry costs by an estimated 30% to 50% and potentially add up to +2.0% growth above the market’s 10.1% CAGR if suppliers expand financing, remote monitoring, and outcome-based pricing.
Key Players Analysis
The Vision Guided Robotics Market is led by Tier-1 companies including FANUC, ABB, Yaskawa, DENSO, Kawasaki, OMRON, Cognex, and Teradyne’s Universal Robots. Together, these suppliers are estimated to account for around 55–65% of market revenue, although this remains an analyst estimate because companies do not report vision-guided robotics as a separate business line.
FANUC’s Robot division generated ¥329.6 billion in FY2025, representing 41.3% of total company sales of ¥797.1 billion. Yaskawa’s Robotics segment recorded ¥247.0 billion, equal to 46% of total revenue. ABB reported 2025 revenue of USD 33.2 billion and R&D investment of USD 1.3 billion, while its Robotics division generated USD 813 million in Q2 2025 before the planned SoftBank sale, expected to close in the second half of 2026.
Cognex remains a major machine-vision specialist, recording 2025 revenue of USD 994.4 million and research, development, and engineering spending of USD 139.0 million, equal to 14% of revenue. Around 85% of its 2025 revenue came from logistics, packaging, consumer electronics, and automotive applications.
OMRON’s Industrial Automation Business reported FY2024 sales of ¥360.8 billion, R&D spending of ¥21.6 billion, and launched 11 new products. Teradyne’s Robotics segment recorded USD 308.3 million in 2025 revenue, compared with USD 364.8 million in 2024, highlighting demand fluctuations in collaborative automation.
Top Key Players in the Market
- ABB Ltd.
- Allied Vision Technologies GmbH
- Basler AG
- Bastian Solutions LLC (Toyota Industries Corporation)
- Cognex Corporation
- DENSO Corporation
- FANUC Corporation
- ISRA Vision AG (Atlas Copco)
- Kawasaki Heavy Industries Ltd.
- OMRON Corporation
- Universal Robots A/S (Teradyne Inc.)
- Yaskawa Electric Corporation
Recent Developments
- In 2025, ABB signed a definitive agreement on October 8 to sell its Robotics division to SoftBank Group for an enterprise value of USD 5.3 billion. ABB expects net cash proceeds of approximately USD 5.3 billion and a pre-tax book gain of around USD 2.4 billion when the transaction closes. The Robotics division has approximately 7,000 employees and generated around USD 2.3 billion in revenue in 2024.
- In 2025, Yaskawa announced on June 19 that it plans to invest USD 180 million in a new robotics campus in Franklin, Wisconsin, over the next 8 to 10 years. The facility will cover more than 74,000 square metres and bring together headquarters, training, and manufacturing activities for industrial robots, including systems used in semiconductor production.
Report Scope
| Report Features | Description |
|---|---|
| Market Value (2025) | USD 8.1 Billion |
| Forecast Revenue (2035) | USD 21.3 Billion |
| CAGR (2026-2035) | 10.1% |
| Base Year for Estimation | 2025 |
| Historic Period | 2020-2024 |
| Forecast Period | 2026-2035 |
| Report Coverage | Revenue Forecast, Market Dynamics, Competitive Landscape, Recent Developments |
| Segments Covered | By Component (Hardware, Software, Services); By Type (2D-Vision System Robots, 3D-Vision System Robots); By Industry Vertical (Automobile, Electrical and Electronics, Aerospace and Defense, Foods and Beverages, Healthcare and Pharmaceutical, Metal Processing) |
| Regional Analysis | North America – US, Canada; Europe – Germany, France, The UK, Spain, Italy, Rest of Europe; Asia Pacific – China, Japan, South Korea, India, Australia, Singapore, Rest of APAC; Latin America – Brazil, Mexico, Rest of Latin America; Middle East & Africa – GCC, South Africa, Rest of MEA |
| Competitive Landscape | ABB Ltd., Allied Vision Technologies GmbH, Basler AG, Bastian Solutions LLC (Toyota Industries Corporation), Cognex Corporation, DENSO Corporation, FANUC Corporation, ISRA Vision AG (Atlas Copco), Kawasaki Heavy Industries Ltd., OMRON Corporation, Universal Robots A/S (Teradyne Inc.), Yaskawa Electric Corporation |
| Customization Scope | Customization for segments, region/country-level will be provided. Additional customization can be done based on requirements. |
| Purchase Options | We have three licenses to opt for: Single User License, Multi-User License (Up to 5 Users), Corporate Use License (Unlimited Users and Printable PDF) |





























