


Report Overview
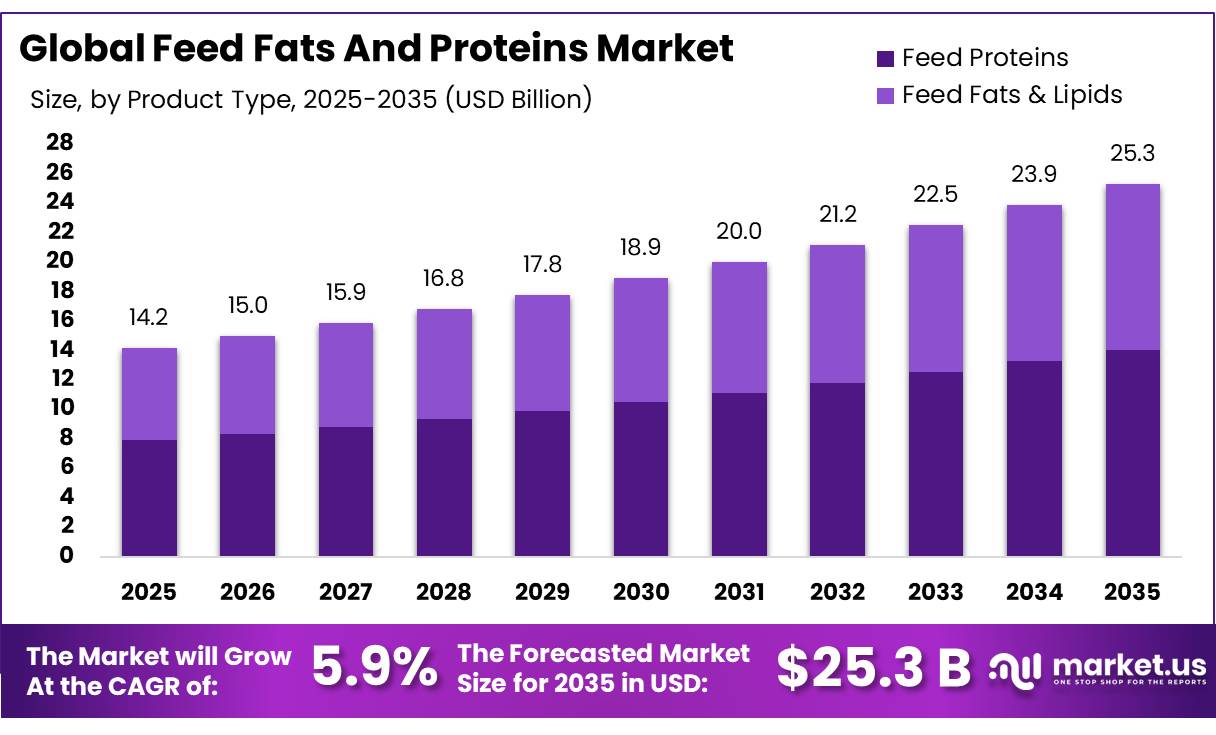
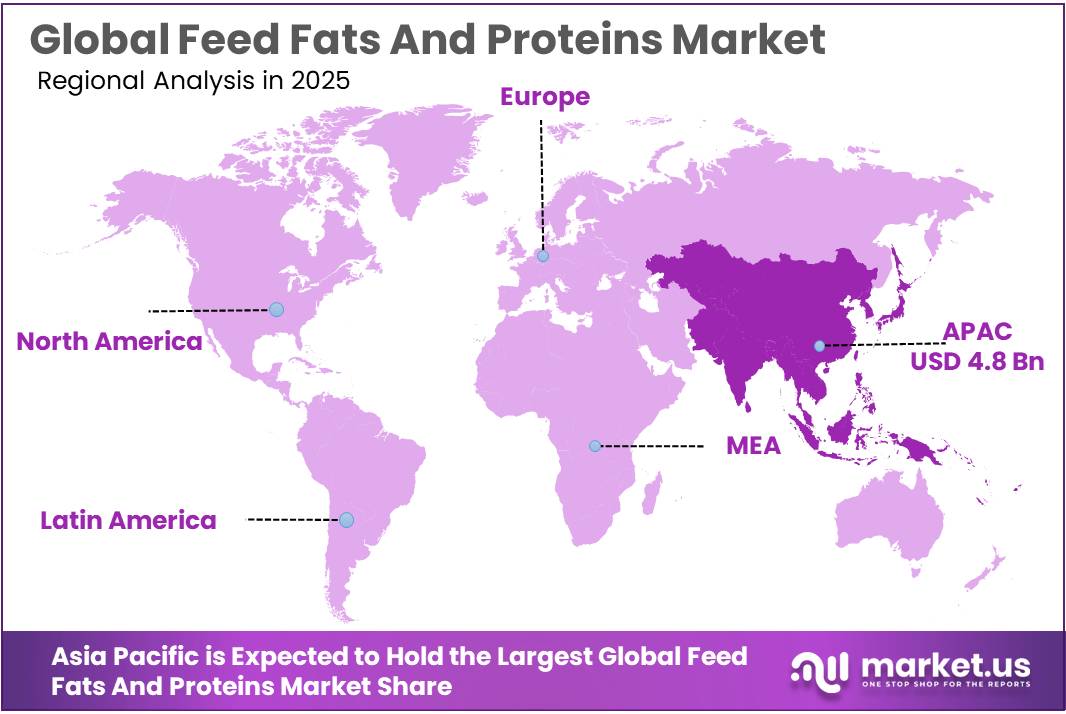
The Global Feed Fats And Proteins Market size is expected to be worth around USD 25.3 Billion by 2035, from USD 14.2 Billion in 2025, growing at a CAGR of 5.9% during the forecast period from 2026 to 2035. In 2025, Asia Pacific held a dominant market position, capturing more than a 34.20% share, holding USD 4.8 Billion revenue.
The feed fats and proteins industry forms an important part of the global animal-nutrition value chain, supplying concentrated energy, amino acids and protein to poultry, swine, cattle, aquaculture and pet-food formulations. Feed fats include rendered animal fats, vegetable oils and specialty lipid blends, while the protein side includes oilseed meals, processed animal proteins and other high-protein ingredients. Global feed production reached about 1.396 billion metric tonnes in 2024, increasing 1.2% from the previous year, showing the large industrial base supporting demand for nutrient-dense feed ingredients.
- In Europe, EFPRA members process around 18.3 million tonnes of animal by-products into approximately 2.8 million tonnes of animal fat and nearly 4.1 million tonnes of animal proteins. These recovered materials help convert livestock and food-processing by-products into usable feed, fuel and industrial inputs rather than waste. In parallel, the EU compound-feed industry is forecast to produce about 152 million tonnes in 2026, underlining a substantial customer base for feed fat and protein suppliers.
Protein availability remains one of the strongest structural drivers. The European Commission states that the EU livestock sector uses about 74 million tonnes of protein as animal feed each year, while 74% of high-protein feed from oilseeds and protein crops is imported. During 2024–25, the EU imported 13.4 million tonnes of soybean and soybean-meal protein.
- FAO reported that global aquaculture aquatic-animal production reached 103 million tonnes in 2024 and represented 53% of total aquatic-animal production. As aquaculture expands, formulators require highly digestible proteins and energy-rich fats capable of supporting animal growth while reducing dependence on finite marine ingredients. EFPRA indicates that processed animal proteins can typically be included at rates of around 5–10% in suitable feed applications, creating opportunities for circular protein ingredients.
The fats segment is also being influenced by competition from renewable-energy applications. U.S. renewable-diesel production reached 3.194 billion gallons in 2024, increasing 23% from 2023, with used cooking oils and inedible animal fats among important feedstocks.
The European Commission’s 2026 Protein Action Plan aims to increase the share of EU-produced oilseed and protein-crop feed from 25% in 2025 to 35% by 2035, encouraging investment in domestic and alternative protein supply chains. At the same time, Evonik has invested more than €200 million in recent years to expand and integrate methionine production, highlighting continued industrial investment in technologies designed to improve feed-protein efficiency.
Key Takeaways
- Feed Fats And Proteins Market size is expected to be worth around USD 25.3 Billion by 2035, from USD 14.2 Billion in 2025, growing at a CAGR of 5.9%.
- Feed Proteins held a dominant market position, capturing more than a 55.65% share.
- Poultry Feed held a dominant market position, capturing more than a 34.50% share.
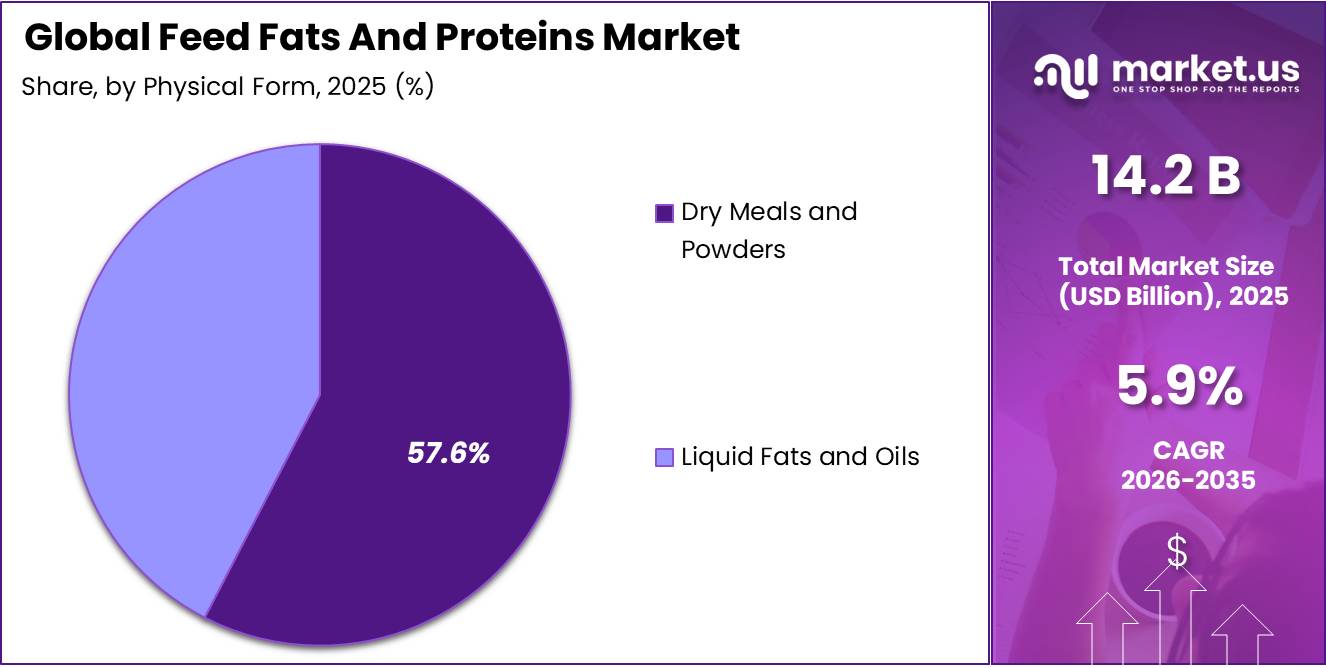
- Dry Meals and Powders held a dominant market position, capturing more than a 57.60% share.
- Extraction held a dominant market position, capturing more than a 49.20% share.
- Asia Pacific held a dominant position in the Feed Fats and Proteins Market, capturing more than a 34.20% share and generating approximately USD 4.86 billion.
By Product Type Analysis
Feed Proteins lead the product landscape with a 55.65% share, supported by their essential role in livestock and poultry nutrition.
In 2025, “Feed Proteins” held a dominant market position, capturing more than a 55.65% share. The segment maintains its strong position because proteins are essential for animal growth, muscle development, reproduction, and overall feed efficiency. Soybean meal, oilseed meals, processed animal proteins, and other protein-rich ingredients remain widely used across poultry, swine, cattle, and aquaculture feed formulations.
Demand for feed proteins is supported by the large nutritional requirements of the livestock industry. In 2026, the European Commission reported that the EU livestock sector uses around 74 million tonnes of protein for animal feed each year. The region currently produces about 67 million tonnes of plant-based protein, while total protein use across feed, food, and industrial applications stands at approximately 80 million tonnes. These volumes show the continuing importance of reliable protein ingredients in commercial animal nutrition. European Commission – Reducing the Plant Protein Deficit of the EU
By Livestock / Application Analysis
Poultry Feed dominates the application landscape with a 34.50% share, supported by large-scale broiler production and high feed requirements.
In 2025, “Poultry Feed” held a dominant market position, capturing more than a 34.50% share. Poultry producers depend heavily on balanced protein and fat ingredients because broilers and layers require energy-dense diets with carefully controlled amino-acid levels. Feed fats provide concentrated dietary energy, while soybean meal and other protein ingredients support muscle development, weight gain and egg production. USDA notes that corn and soybean meal remain the primary feed resources supporting the U.S. poultry industry, while feed represents one of the most important production costs for livestock and poultry producers.
Government production figures underline the scale of this feed requirement. According to the USDA Economic Research Service, U.S. poultry-sector sales reached USD 81.7 billion in 2025, compared with USD 70.3 billion in the previous year, while broilers generated USD 44.6 billion in production value. U.S. broiler production was estimated at 48.046 billion pounds in 2025, with production projected to reach 48.600 billion pounds in 2026. Expanding broiler output keeps commercial demand strong for soybean meal, rendered fats, vegetable oils and other nutrient-rich feed ingredients used to improve growth and feed conversion.
Swine Feed represents an important application within the Feed Fats and Proteins Market, supported by the continuous nutritional requirements of breeding, nursery and finishing hog operations. Commercial swine diets commonly depend on corn for energy and soybean meal for protein, while added fats can increase dietary energy density and improve formulation flexibility.
By Physical Form Analysis
Dry Meals and Powders dominate with a 57.60% share, supported by strong demand for protein-rich, easy-to-handle feed ingredients.
In 2025, “Dry Meals and Powders” held a dominant market position, capturing more than a 57.60% share. This form remains widely used because dry ingredients such as soybean meal, canola meal, fish meal, and processed animal proteins can be stored, transported, mixed, and measured easily in commercial feed plants. USDA describes soybean meal as the ground solid residue remaining after soybean-oil production and notes that it is widely used as a protein source in diets for poultry, pigs, cattle, sheep, horses, and fish.
The scale of meal consumption strengthens the position of dry feed ingredients. For the 2025/26 marketing year, USDA projects U.S. domestic soybean-meal consumption at 42.03 million short tons, an increase of 2.4% from the previous marketing year. USDA also reported that demand had already reached a record 41.04 million short tons in 2024/25, driven partly by growth in poultry production and competitive feed prices. Higher soybean crushing is also increasing the availability of meal for animal-feed formulations.
By Technology Method Analysis
Extraction leads the technology landscape with a 49.20% share, supported by large-scale oilseed processing for protein meals and feed oils.
In 2025, “Extraction” held a dominant market position, capturing more than a 49.20% share. Extraction remains widely used because it separates valuable protein meal and oil from soybeans and other oilseeds, supplying two important ingredients for animal-feed formulations. The method supports large-volume production, consistent nutrient quality, and efficient recovery of both protein-rich solids and energy-dense oils. These advantages make extraction particularly important for poultry, swine, dairy, and aquaculture feed manufacturers.
Government data reflects the continuing expansion of extraction capacity. In September 2026, the USDA forecast U.S. soybean crushing at 2.78 billion bushels for the 2026/27 marketing year, while soybean production was projected at around 4.5 billion bushels. Higher crushing activity increases the availability of soybean meal and soybean oil for feed and other industrial uses. USDA also reported that stronger global demand is supporting higher rapeseed and sunflowerseed crushing, with global rapeseed production approaching 100 million metric tons and sunflowerseed production projected at 63.7 million metric tons.
Key Market Segments
By Product Type
- Feed Proteins
- Plant-Based Proteins
- Animal-Derived Proteins
- Alternative & Emerging Proteins
- Feed Fats & Lipids
- Animal Fats
- Vegetable Oils
- Blended Specialty Lipids
By Livestock / Application
- Poultry Feed
- Broilers
- Layers
- Turkeys and breeders
- Swine Feed
- Starters / Piglets
- Growers / Finishers
- Gestating and lactating sows
- Ruminant Feed
- Dairy cattle
- Beef cattle
- Small ruminants
- Aquaculture (Aquafeed)
- Finfish
- Crustaceans
- Others
By Physical Form
- Dry Meals and Powders
- Liquid Fats and Oils
By Technology Method
- Extraction
- Rendering
- Bioengineering & Fermentation
Driver Analysis
Animal-Protein Output Growth
OECD–FAO expects global meat, dairy and egg output to increase 17% through 2034 while combined cattle, sheep, pig and poultry inventories rise only 7%, implying that productivity—not merely animal numbers—must supply much of the gain and therefore increasing the commercial value of nutritionally consistent feed ingredients.
The 2026–2035 outlook projects poultry consumption to expand by 29 million tonnes, or 20%, the largest absolute increase among meats; USDA separately forecasts 2026 world chicken production near 110.7 million tonnes, almost 3% above 2025, with China reaching 17.3 million tonnes and U.S. red-meat-and-poultry production reaching 108.4 billion lb.
Feed proteins convert that production pull into meal demand: OECD–FAO estimates protein-meal consumption will continue rising around 1.1% annually, while USDA’s 2026/27 balances indicate approximately 301.9 million tonnes of soybean meal and 54.3 million tonnes of rapeseed meal, establishing a combined 356 million-tonne supply base before sunflower, fish and animal proteins.
The +2.0-percentage-point impact assumes most incremental value comes from higher compound-feed penetration and quality upgrading in Asia, Latin America and MENA rather than uniform increases in ingredient inclusion; suppliers consequently shift from spot commodity sales toward species-specific protein matrices, standardized digestibility, blended fats and multi-year integrator contracts, capturing value through consistency and formulation support while large crushers and renderers defend margins through scale, logistics and co-product optimization.
Drivers Impact Analysis
| Driver | (~) % Impact on CAGR Forecast | Geographic Relevance | Impact Timeline |
|---|---|---|---|
| Animal-protein output growth | +2.0 pp | APAC core; Americas; MENA | Short term (≤2 years) |
| Aquaculture feed intensification | +1.6 pp | China; Southeast Asia; India; Latin America | Medium term (2–4 years) |
| Energy-dense ration economics | +1.3 pp | Global intensive livestock hubs | Short term (≤2 years) |
| Circular by-product recovery | +1.1 pp | EU; North America; Brazil; Oceania | Medium term (2–4 years) |
| Protein-source diversification | +0.9 pp | EU core; North America; advanced APAC | Medium term (2–4 years) |
| Traceable low-carbon sourcing | +0.7 pp | EU-linked supply chains; global exporters | Long term (≥4 years) |
Restraint Analysis
Input-Price Volatility
The market’s largest near-term restraint is the mismatch between volatile oilseed, meal and lipid input costs and the limited speed at which feed manufacturers can reprice contracted rations: in August 2026, FAO’s oilseed and oilmeal indices rose 3.2% and 7.6% month on month, respectively, the oilmeal index reached a two-year high, and the vegetable-oil index reached its highest level since June 2022 as soymeal demand, U.S. crop concerns, palm-oil import demand and possible El Niño effects moved simultaneously through the complex.
This matters because feed fats and proteins are co-products of crushing, rendering and fishing rather than independently scalable outputs, so the supply response depends on economics in food oil, meat processing, biodiesel and fisheries; a crusher may expand meal supply when oil margins support throughput, yet a protein supplier cannot readily offset a weather-driven soybean shortfall or a palm-oil shock. The resulting commercial friction is asymmetric: integrated processors can hedge or rebalance crush margins, while small blenders and feed mills typically carry 30–90 days of inventory and sell under shorter formula-linked or fixed-price contracts, exposing working capital and gross margin when weekly spot costs outrun customer resets.
Import-reliant APAC and MENA buyers face an additional freight and currency layer, while livestock customers respond by reducing discretionary fat inclusion, reformulating toward lower-cost meals or delaying premium purchases rather than absorbing the full increase. The modeled -1.8-percentage-point CAGR effect therefore reflects lost volume during price spikes, substitution toward farm-mixed materials and lower-priced energy sources, and margin compression that discourages capacity investment; strategically, suppliers must adopt indexed pricing, shorter validity windows, multi-origin procurement and inventory hedging, but these protections transfer volatility to customers and can weaken retention.
Restraint Impact Analysis
| Restraint | (~) % Impact on CAGR Forecast | Geographic Relevance | Impact Timeline |
|---|---|---|---|
| Input-price volatility | -1.8 pp | Global; import-led APAC/MENA | Short term (≤2 years) |
| Food–fuel fat competition | -1.4 pp | EU; North America; Brazil | Medium term (2–4 years) |
| Marine-ingredient scarcity | -1.2 pp | Peru–Chile supply; global aquaculture | Short term (≤2 years) |
| Compliance and segregation costs | -1.0 pp | EU core; EU-linked exporters; US | Medium term (2–4 years) |
| Livestock disease shocks | -0.9 pp | Americas; Europe; East/Southeast Asia | Short term (≤2 years) |
| Quality and contamination risk | -0.7 pp | Global; humid tropical corridors | Long term (≥4 years) |
Opportunity Analysis
Functional Ingredient Upgrading
The highest near-term white space is not selling more undifferentiated tallow, meal or fish oil—a baseline activity but converting low-margin streams into standardized functional ingredients such as spray-dried plasma, enzymatic protein hydrolysates, palatants, low-ash meals, phospholipid concentrates, protected fats and species-specific lipid blends. The value-creation case is supported by performance rather than commodity tonnage: a 2025 piglet study using 5% spray-dried porcine plasma increased first-week feed intake from 215 to 280 g/day, average daily gain from 133 to 205 g/day and gain-to-feed from 0.61 to 0.74, equivalent to gains of 30%, 54% and 21%, respectively.
Broader 2025 evidence places typical plasma inclusion at 2–5%, with formulations reaching 7–8%, and links nursery use to fewer gastrointestinal medical interventions and higher final slaughter weight even when early-phase growth responses vary. The opportunity is untapped because most rendered and marine materials remain sold against protein, fat, ash and moisture specifications rather than validated biological outcomes; in Europe, 18.3 million tonnes of animal by-products generated 2.8 million tonnes of fats and nearly 4.1 million tonnes of processed animal proteins in 2025, leaving a large conversion base for selective fractionation and hydrolysis.
A processor upgrading only 5% of that 6.9-million-tonne European output would create roughly 345,000 tonnes of specialty capacity; at an analyst-modeled $400–$1,000-per-tonne uplift versus bulk equivalents, the incremental annual revenue pool is approximately $140–$345 million before replication in North America and Asia.
Execution requires segregated raw materials, enzymatic or spray-drying assets, peptide and fatty-acid characterization, palatability trials and patentable formulations, but it shifts the business model from cost-plus commodity sales toward application-led pricing, 20–35% target gross margins, technical lock-in and multi-year contracts tied to feed-conversion, survivability or gut-health outcomes; successful commercialization could add about 1.7 percentage points to market CAGR through price/mix rather than livestock-volume growth.
Opportunity Impact Analysis
| Opportunity | (~) % Potential CAGR Upside | Geographic Relevance | Execution Window |
|---|---|---|---|
| Functional ingredient upgrading | +1.7 pp | North America; EU; APAC premium hubs | Short term (≤2 years) |
| Digital nutrition-as-a-service | +1.4 pp | North America; EU; China; Brazil | Short term (≤2 years) |
| Emerging-market rendering hubs | +1.3 pp | India; Southeast Asia; Africa; LATAM | Medium term (2–4 years) |
| Alternative-protein platforms | +1.1 pp | EU; North America; East Asia | Medium term (2–4 years) |
| Verified low-carbon ingredients | +0.9 pp | EU core; global export chains | Medium term (2–4 years) |
| Premium pet-food adjacency | +0.8 pp | US; Europe; Japan; urban APAC | Short term (≤2 years) |
Challenges Analysis
Nutrient Batch Variability
Feed-fat and protein suppliers must continuously reconcile biological raw-material variability with formulation guarantees: a 2024 U.S. soybean-meal assessment spanning 232 samples from 45 locations and 14 states reported coefficients of variation of 31.0% for neutral-detergent fibre, 16.8% for acid-detergent fibre, 11.8% for bulk density and 6.8% for ash, even though crude-protein variation was only 1.8%; the first three principal components still captured 71.9% of total variation, showing that specification risk is multidimensional rather than reducible to protein percentage alone.
A separate multi-origin study found coefficients of variation above 10% for ether extract, fibre fractions, tryptophan and several minerals, while standardized ileal digestibility shifted by source and animal physiological stage. This does not stop trade, but it forces buyers to hold safety margins, over-formulate digestible amino acids and metabolizable energy, retest incoming lots and discount poorly characterized batches; at scale, a 1–2% formulation cushion across high-throughput poultry, swine or aquafeed accounts can consume much of a commodity supplier’s contribution margin.
The modeled -1.1 percentage-point drag therefore reflects slower qualification, rejected or downgraded lots, and resistance to premium contracts until processors deploy source-specific NIR calibrations, supplier scorecards and digestibility-based pricing; NIR can read fat, moisture, protein, fibre, ash and starch within seconds without sample preparation, but calibration transfer, reference-laboratory bias and representative sampling remain the real bottlenecks.
Challenges Impact Analysis
| Challenge | (~) % CAGR Friction Drag | Geographic Relevance | Mitigation Horizon |
|---|---|---|---|
| Nutrient Batch Variability | -1.1% | Global; Americas–Asia trade | Medium term (2–4 years) |
| Lipid Oxidation Control | -0.9% | Hot-climate APAC, MEA, LatAm | Medium term (2–4 years) |
| Contaminant Risk Management | -0.8% | Global; Asia, Americas, EU | Long term (≥ 4 years) |
| Traceability Data Fragmentation | -1.0% | EU core; Brazil, SE Asia | Medium term (2–4 years) |
| Freight Network Volatility | -0.7% | Asia–EU; MENA; Africa | Short term (≤ 2 years) |
| Technical Talent Scarcity | -0.6% | North America, EU; rural hubs | Long term (≥ 4 years) |
Geopolitical Impact Analysis
The Russia–Ukraine war and continuing Middle East shipping disruptions are keeping the Feed Fats and Proteins Market exposed to supply, freight, and energy risks. Ukraine and Russia together produce more than half of global sunflowerseed and account for nearly three-quarters of sunflower oil and meal exports, making Black Sea trade highly important for feed-grade oils and protein meals. USDA reported that war-related logistics and trade-policy changes have repeatedly affected sunflower product flows and global prices.
- In 2025/26, FAO expects Ukraine’s cereal exports at about 40 million tonnes, around 20% below the previous year, while transport and storage constraints linked to the war continue to limit export capacity. Lower or delayed grain availability can raise procurement pressure for compound-feed producers and encourage greater use of soybean meal, rapeseed meal, rendered proteins, and alternative fats.
Shipping tensions are adding another layer of cost. UNCTAD reported that global maritime trade, which carries more than 80% of world trade, was expected to grow only 0.5% in 2025, while rerouting around the Cape of Good Hope increased shipping distances. As a result, feed-fat and protein suppliers are focusing more on regional sourcing, inventory protection, alternative ingredients, and diversified logistics to reduce exposure to geopolitical shocks.
Regional Insights
Asia Pacific Leads the Feed Fats and Proteins Market with a 34.20% Share, Reaching USD 4.86 Billion
In 2025, Asia Pacific held a dominant position in the Feed Fats and Proteins Market, capturing more than a 34.20% share and generating approximately USD 4.86 billion. The region benefits from a very large livestock, poultry, aquaculture, and commercial-feed base. According to Alltech, Asia Pacific produced about 533.1 million metric tons of animal feed, making it the world’s largest feed-producing region. China alone produced around 311 million metric tons of compound feed.
Asia Pacific’s position is further supported by rapid aquaculture development. FAO reported in 2026 that Asia produced around 179 million tonnes of aquatic animals and algae during 2024, accounting for 76% of global production. Around 130 million tonnes came from aquaculture, while farmed aquatic-animal production reached 91.5 million tonnes. The region contributed around 90% of global aquaculture growth between 2000 and 2024.
Key Regions and Countries Insights
- North America
- US
- Canada
- Europe
- Germany
- France
- The UK
- Spain
- Italy
- Rest of Europe
- Asia Pacific
- China
- Japan
- South Korea
- India
- Australia
- Rest of APAC
- Latin America
- Brazil
- Mexico
- Rest of Latin America
- Middle East & Africa
- GCC
- South Africa
- Rest of MEA
Key Players Analysis
Cargill maintains a strong position in feed fats and proteins through its large animal-nutrition and agricultural-processing network. In fiscal 2025, the company generated USD 154 billion in revenue and operated across 70 countries. Its animal-nutrition business employs about 20,000 people at 280 locations across 40 countries and produces nearly 18 million metric tons of feed annually. This scale supports Cargill’s supply of protein ingredients, fats, premixes, additives, and customized nutrition solutions across livestock and aquaculture markets.
ADM holds a significant position in feed proteins and fats through its oilseed processing, animal nutrition, and feed-ingredient operations. In 2025, ADM generated total revenue of USD 80.269 billion, including USD 61.571 billion from Ag Services and Oilseeds. The company processed approximately 36.324 million metric tons of oilseeds during the year. Its animal-nutrition network produces about 3 million metric tons of feed annually through more than 50 plants worldwide, supporting soybean meal, vegetable oils, amino acids, and specialty feed solutions.
Bunge Global SA strengthened its feed fats and proteins position after completing its combination with Viterra in 2025, creating a broader global agribusiness platform for food, feed, and fuel. During 2025, its Soybean Processing and Refining segment processed approximately 41.013 million metric tons of soybeans and produced 3.612 million metric tons of refined soybean oil. The segment generated USD 36.313 billion in net sales. Following the Viterra combination, the wider organization had nearly 34,000 employees worldwide.
Top Key Players Outlook
- Cargill, Incorporated
- Archer Daniels Midland Company (ADM)
- Bunge Global SA
- Darling Ingredients Inc.
- Wilmar International Limited
- Louis Dreyfus Company B.V.
- Tyson Foods, Inc.
- JBS S.A.
- Nutreco N.V.
- dsm-firmenich AG
- Evonik Industries AG
- Roquette Frères
- AAK AB
- The Scoular Company
- Omega Protein Corporation
Recent Developments
- December 2025; Darling is expected to hold 85% of the new company, which will have about USD 1.5 billion in annual revenue and 200,000 metric tons of capacity across 22 facilities. Under Merger & Acquisition, in July 2026 the company confirmed the acquisition of 3 rendering facilities from Brazil’s Patense Group for approximately USD 122 million, directly expanding its animal by-product processing network.
- In 2025, Wilmar International Limited its Feed & Industrial Products segment recorded about US$42.87 billion in revenue and US$861.0 million in pre-tax profit, while sales volume reached nearly 68.0 million metric tons; Oilseeds & Grains alone contributed 30.0 million metric tons, up 9% year over year.
Report Scope
| Report Features | Description |
|---|---|
| Market Value (2025) | USD 14.2 Bn |
| Forecast Revenue (2035) | USD 25.3 Bn |
| CAGR (2026-2035) | 5.9% |
| Base Year for Estimation | 2025 |
| Historic Period | 2020-2024 |
| Forecast Period | 2026-2035 |
| Report Coverage | Revenue Forecast, Market Dynamics, Competitive Landscape, Recent Developments |
| Segments Covered | By Product Type (Feed Proteins, Feed Fats & Lipids), By Livestock / Application (Poultry Feed, Swine Feed, Ruminant Feed, Aquaculture (Aquafeed), Others), By Physical Form (Dry Meals and Powders, Liquid Fats and Oils), By Technology Method (Extraction, Rendering, Bioengineering & Fermentation) |
| Regional Analysis | North America – US, Canada; Europe – Germany, France, The UK, Spain, Italy, Rest of Europe; Asia Pacific – China, Japan, South Korea, India, Australia, Singapore, Rest of APAC; Latin America – Brazil, Mexico, Rest of Latin America; Middle East & Africa – GCC, South Africa, Rest of MEA |
| Competitive Landscape | Cargill, Incorporated, Archer Daniels Midland Company (ADM), Bunge Global SA, Darling Ingredients Inc., Wilmar International Limited, Louis Dreyfus Company B.V., Tyson Foods, Inc., JBS S.A., Nutreco N.V., dsm-firmenich AG, Evonik Industries AG, Roquette Frères, AAK AB, The Scoular Company, Omega Protein Corporation |
| Customization Scope | Customization for segments, region/country-level will be provided. Moreover, additional customization can be done based on the requirements. |
| Purchase Options | We have three licenses to opt for: Single User License, Multi-User License (Up to 5 Users), Corporate Use License (Unlimited User and Printable PDF) |





































