


Report Overview
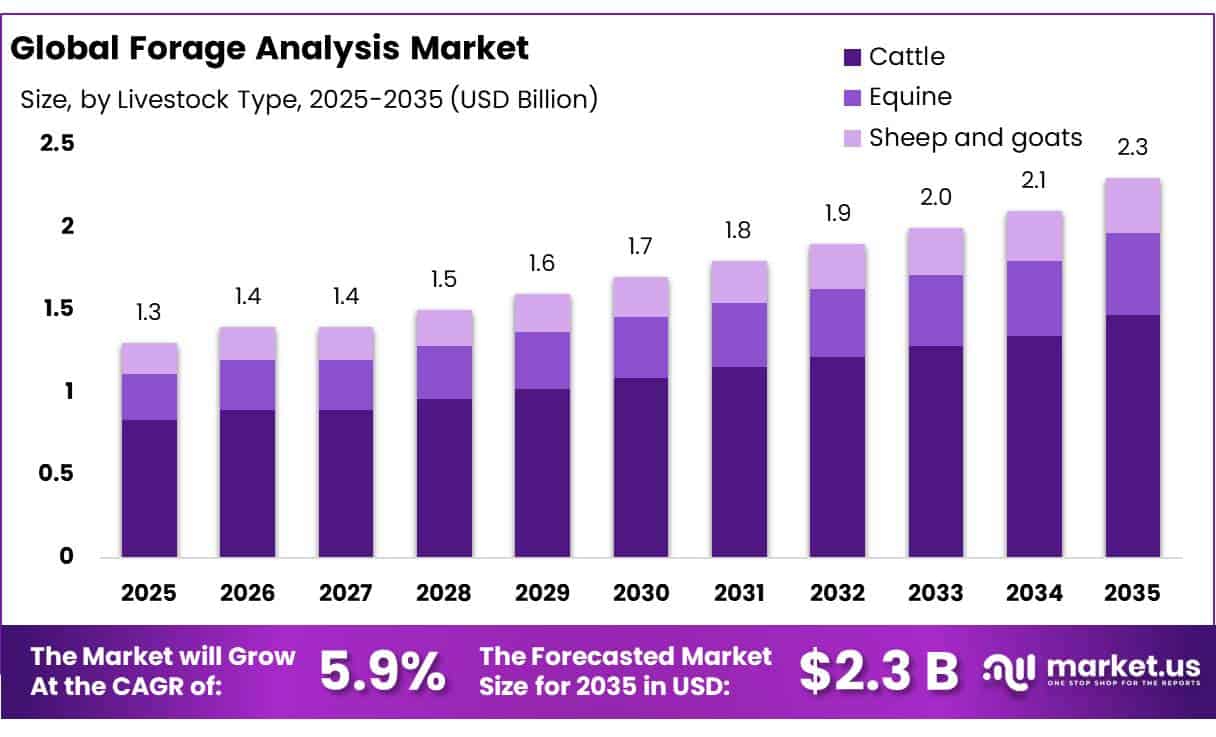
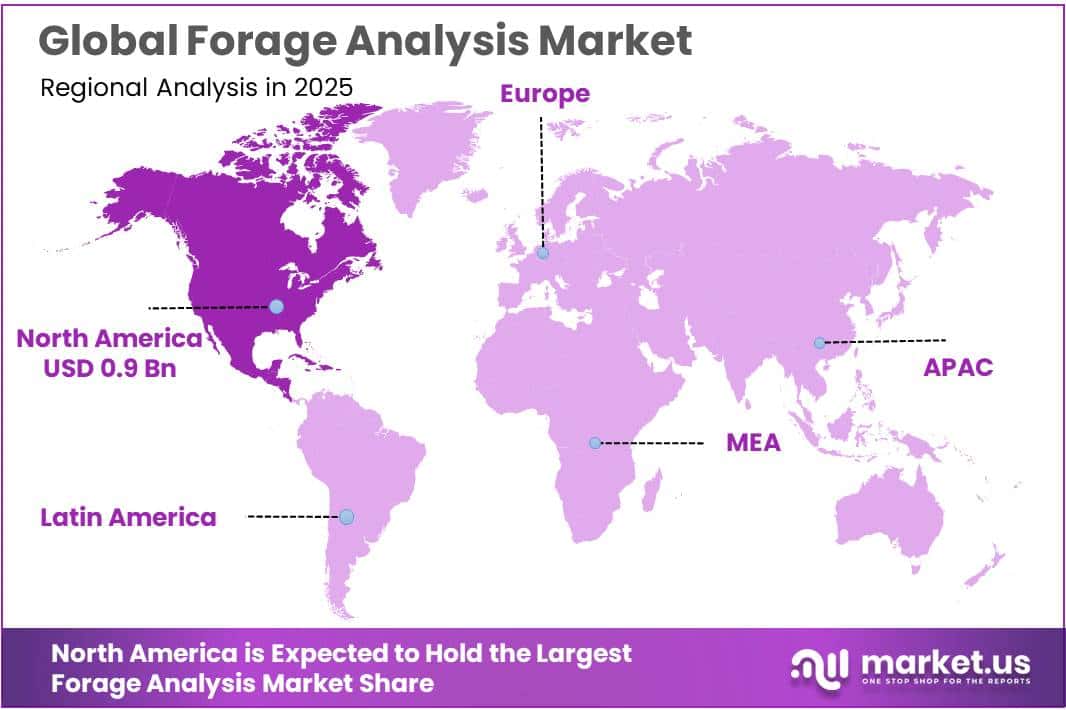
The Global Forage Analysis Market size is expected to be worth around USD 2.3 Billion by 2035, from USD 1.3 Billion in 2025, growing at a CAGR of 5.9% during the forecast period from 2026 to 2035. In 2025, North America held a dominant market position, capturing more than a 45.0% share, holding USD 0.9 Billion revenue.
Forage analysis has become an important part of modern livestock nutrition because the nutritional value of hay, silage, pasture, and other forage materials can change significantly with crop variety, harvest conditions, storage, and moisture. The scale of forage production creates a large requirement for routine laboratory testing.
- USDA reported that U.S. dry hay production reached 123 million tons, harvested from 49.6 million acres, with an average yield of 2.48 tons per acre. This large production base supports demand for testing of dry matter, protein, fiber, minerals, digestibility, and energy values before forage is used in commercial feeding programs.
Key Takeaways
- Forage Analysis Market size is expected to be worth around USD 2.3 Billion by 2035, from USD 1.3 Billion in 2025, growing at a CAGR of 5.9%.
- Cattle held a dominant market position, capturing more than a 64.00% share.
- Nutrients held a dominant market position, capturing more than a 47.00% share.
- Silage held a dominant market position, capturing more than a 41.00% share.
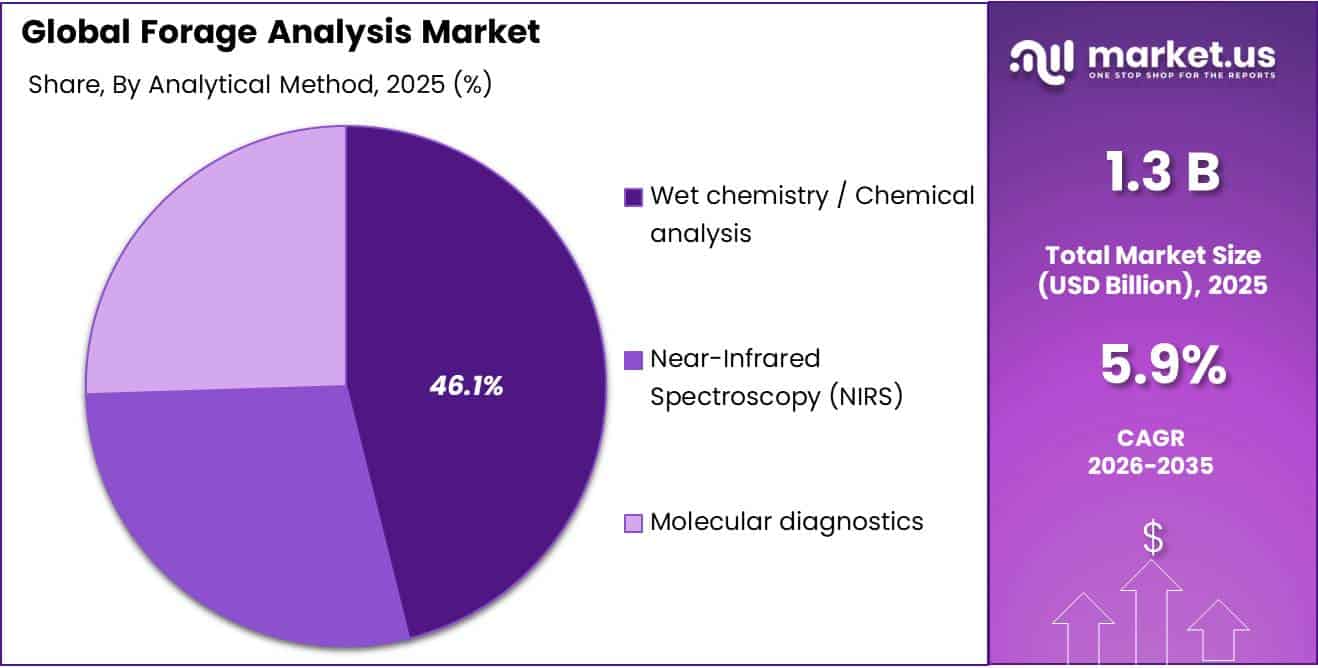
- Wet chemistry / Chemical analysis held a dominant market position, capturing more than a 46.00% share.
- North America dominates the forage analysis market with a 45.00% share, valued at about USD 0.90 billion.
The industrial scenario is also supported by the scale and technical requirements of the livestock feed industry. FEFAC expects EU compound feed production to reach approximately 152 million tonnes, including around 45.358 million tonnes of cattle feed and 51.588 million tonnes of poultry feed. Large feed volumes encourage producers and nutrition companies to maintain more consistent raw-material specifications and monitor nutritional variation before feed formulation.
- Higher livestock productivity is another major driving factor. USDA reported U.S. milk production of approximately 232 billion pounds, supported by an annual average dairy herd of about 9.50 million cows, while milk output averaged 24,390 pounds per cow. Such productivity levels increase the importance of accurately balancing forage protein, fiber, energy, moisture, and mineral content because small nutritional differences can influence milk output, feed intake, animal health, and purchased-feed requirements.
Laboratory standardization is strengthening the industry further. AOAC INTERNATIONAL maintains more than 3,000 validated analytical methods, while its current Official Methods framework added 35 First Action Methods and 19 Final Action Methods. These internationally recognized chemical and microbiological procedures help laboratories improve comparability, repeatability, and confidence in analytical results.
The European Commission states that the current Common Agricultural Policy is supported by €269.5 billion, with around 47% of its budget considered climate-relevant, while EU countries must reserve at least 35% of rural-development funding for environmental and climate-related practices. These priorities can encourage better nutrient efficiency, forage utilization, grassland management, and livestock productivity, creating long-term opportunities for laboratories offering faster, standardized, and digitally integrated forage analysis services.
By Target / Testing Parameter Analysis
Cattle dominates the forage analysis market with more than a 64.00% share, supported by its large feed and forage requirements.
In 2025, “Cattle” held a dominant market position, capturing more than a 64.00% share. The segment benefits from the large quantity of hay, silage, pasture, and other roughage required across dairy and beef operations. Regular forage analysis helps cattle producers understand protein, fiber, moisture, mineral, and energy levels and supports more accurate feed formulation.
- In July 2026, the USDA reported 94.2 million cattle and calves on U.S. farms, while the national milk-cow population reached 9.65 million head. This large livestock base creates continued demand for laboratories and feed-testing facilities that can check forage quality before it enters cattle feeding programs.
Equine represents an important livestock type within the forage analysis market because horses depend heavily on hay, pasture, and other fibrous feeds as part of their daily diets. Testing allows owners, breeding farms, veterinary professionals, and equine facilities to evaluate forage quality and identify changes in nutrients before feeding.
By Livestock Type Analysis
Nutrients dominate the forage analysis market with more than a 47.00% share, supported by the need for accurate livestock feed formulation.
In 2025, “Nutrients” held a dominant market position, capturing more than a 47.00% share. Nutrient testing remains widely used because forage quality can differ according to crop type, maturity, weather, harvesting, and storage conditions. Producers rely on laboratory analysis to understand the feeding value of hay and other forage before developing animal rations.
- USDA reported that U.S. dry hay production reached approximately 123 million tons in 2025 from around 49.6 million acres. This large forage volume strengthens the need for reliable nutrient testing across dairy, beef, and other livestock feeding operations.
Dry matter is an important testing parameter because removing the effect of water allows livestock producers and nutrition professionals to compare forage samples on a consistent basis. In its January 2026 Crop Production Summary, USDA explains its forage calculations using standardized dry-matter assumptions: 1 ton of dry hay represents 0.87 ton of dry matter, 1 ton of haylage represents 0.45 ton of dry matter, and 1 ton of greenchop represents 0.25 ton of dry matter.
By Forage Type Analysis
Silage dominates the forage analysis market with more than a 41.00% share, driven by its extensive use in livestock feeding.
In 2025, “Silage” held a dominant market position, capturing more than a 41.00% share. Silage requires regular testing because its moisture, fermentation quality, fiber, protein, and energy content can change with crop maturity, harvesting, and storage conditions.
- According to the USDA National Agricultural Statistics Service, U.S. corn silage production reached 135.54 million tons in 2025, while the average yield stood at 21.8 tons per acre.
Hay represents an important forage type in the forage analysis market because its nutritional quality can vary considerably depending on plant species, harvesting stage, weather, drying conditions, and storage practices. In 2025, USDA reported total U.S. dry hay production of 123.03 million tons, harvested from approximately 49.6 million acres, with an average yield of 2.48 tons per acre.
By Analytical Method Analysis
Wet chemistry / Chemical analysis leads with more than a 46.00% share, supported by its role in detailed and reference-grade forage testing.
In 2025, “Wet chemistry / Chemical analysis” held a dominant market position, capturing more than a 46.00% share. Wet chemistry remains widely used because it directly measures important forage characteristics such as crude protein, fiber, lignin, minerals, and other nutritional components, while also providing reference results needed to develop and validate faster analytical techniques.
- In its 2025 annual report, the USDA Agricultural Research Service stated that 413 ground alfalfa stem samples had undergone chemical analysis and NIR testing for the development of forage-quality prediction models. The same USDA program selected 400 alfalfa accessions for field evaluation, with stem material collected across 4 harvests for forage-quality analysis.
Near-Infrared Spectroscopy (NIRS) is increasingly used in forage analysis because it can rapidly estimate several nutritional properties from prepared forage samples while reducing the need for repeated chemical procedures. USDA Agricultural Research Service reported in 2025 that a new forage-quality testing laboratory was being established using NIRS, demonstrating the technology’s growing role in agricultural research.
The USDA program uses NIRS to evaluate important characteristics including crude protein, lignin, neutral detergent fiber, fiber digestibility, and relative forage quality. A separate USDA ARS study published in September 2025 evaluated 4 cool-season grass species through NIRS and assessed dry matter, crude protein, acid detergent fiber, neutral detergent fiber, digestibility, and soluble carbohydrates.
Key Market Segments
By Target / Testing Parameter
- Nutrients
- Dry matter
- Mycotoxins
- Others
By Livestock Type
- Cattle
- Equine
- Sheep and goats
By Forage Type
- Hay
- Silage
- Ration formulations
By Analytical Method
- Near-Infrared Spectroscopy (NIRS)
- Wet chemistry / Chemical analysis
- Molecular diagnostics
Driver Analysis
Precision Dairy Rationing
Feed is commonly the largest controllable cost line in dairy production, so volatile forage dry matter, protein and fiber values have an immediate economic effect on ration formulation, milk yield and purchased-concentrate use; forage analysis converts an uncertain on-farm inventory into measurable dry matter, crude protein, acid-detergent fiber, neutral-detergent fiber, starch, ash, mineral and digestibility inputs.
Extension guidance identifies dry matter, crude protein, ADF and NDF as the minimum analytical base, noting that high ADF lowers energy availability and high NDF constrains voluntary intake. For a 1,000-cow dairy feeding 22–26 kg of dry matter per lactating cow daily, a 1 percentage-point dry-matter or digestibility misread can distort daily ingredient loading by several tonnes of as-fed forage across the herd; even a 1–3% improvement in ration conversion, avoided shrink or milk solids can justify recurring analysis spend when daily feeding costs are roughly USD 5.50–8.50 per lactating cow and feed represents about 49% of milk-production cost in a typical U.S. commercial system.
Drivers Impact Analysis
| Driver | (~) % Impact on CAGR Forecast | Geographic Relevance | Impact Timeline |
|---|---|---|---|
| Precision dairy rationing | +2.2% | North America, EU, Oceania | Short term (≤2 years) |
| On-farm NIR deployment | +1.8% | North America, EU, APAC dairy hubs | Medium term (2–4 years) |
| Methane-accounting demand | +1.5% | EU, UK, North America, Oceania | Medium term (2–4 years) |
| Climate-risk forage monitoring | +1.3% | APAC, Europe, Latin America, Africa | Short term (≤2 years) |
| Commercial feed-mill QA | +1.1% | China, India, Southeast Asia, Latin America | Medium term (2–4 years) |
| Digital advisory subscriptions | +0.9% | North America, EU, advanced APAC farms | Long term (≥4 years) |
Restraint Analysis
Small-Farm Affordability Gap
Forage analysis remains economically compelling for large dairies, feedlots and commercial feed mills, but the commercial adoption ceiling is materially lower among farms with fewer than 50–100 productive animals, where annual forage use, cash flow and nutritionist access do not easily support repeat testing, portable NIR hardware or digital ration-management subscriptions; even a low-cost external NIR test can cost roughly USD 20–25 per sample with a three-business-day turnaround, while premium or expedited services can exceed USD 70–110 per sample, and meaningful lot management may require 6–20 tests per year across hay, silage, pasture and purchased feed.
When a small producer’s potential annual feed-efficiency gain is perceived at only USD 200–800, the cost of sampling tools, shipping, advisory support and repeated tests can consume 15–35% of expected benefit, suppressing adoption in South Asia, Africa and Latin America; this constrains laboratory sample volumes, prevents the fixed-cost absorption needed for decentralized testing networks, and forces suppliers to rely on larger commercial customers unless they build cooperative testing pools, dealer-bundled sampling, pay-per-use scanning, government cost-share or feed-supplier-funded service models.
Restraint Impact Analysis
| Restraint | (~) % Impact on CAGR Forecast | Geographic Relevance | Impact Timeline |
|---|---|---|---|
| Small-farm affordability gap | -1.7% | South Asia, Africa, Latin America | Long term (≥4 years) |
| Sampling quality inconsistency | -1.4% | Global; fragmented farm markets | Short term (≤2 years) |
| NIR calibration limitations | -1.3% | Global; tropical forage regions | Medium term (2–4 years) |
| Wet-chemistry cost burden | -1.0% | Emerging markets, remote regions | Medium term (2–4 years) |
| Sparse laboratory access | -1.2% | Africa, Latin America, rural APAC | Long term (≥4 years) |
| Uncertain ROI perception | -0.9% | Small and mid-sized dairies globally | Medium term (2–4 years) |
Opportunity Analysis
Carbon-Ready Forage Analytics
This is an untapped reporting and verification layer—not a current forage-testing driver—because most laboratories still sell nutrient panels, while the emerging premium lies in translating dry matter, NDF, ADF, starch, crude protein, digestibility, ration inclusion and feed-intake data into auditable enteric-methane and feed-carbon-intensity estimates. Research measuring Italian dairy farms found average daily enteric methane emissions of 0.20–0.21 kg CH₄ per animal unit, illustrating the scale of the measurement problem that diet-specific forage data can help model.
A laboratory or NIR platform can bundle carbon baselining, ration scenario modelling, feed-additive verification and processor-ready sustainability reporting at USD 1,000–10,000 annually for a commercial dairy or supply cooperative—versus USD 20–100 for a standard sample—creating a 60–75% gross-margin data service after initial model development; the white space arises because dairies, processors and brands are not yet uniformly paying for verified forage-linked methane data, but livestock methane is projected to rise by 10% by 2030 relative to 2020 even after accounting for expected interventions, increasing the commercial imperative for measurement.
Successful execution requires reference-method governance, nutritionist validation, traceable sampling and clear separation between modeled estimates and direct emissions claims, but could add approximately 2.0 percentage points to market CAGR above baseline.
Opportunity Impact Analysis
| Opportunity | (~) % Potential CAGR Upside | Geographic Relevance | Execution Window |
|---|---|---|---|
| Carbon-ready forage analytics | +2.0% | EU, UK, North America, Oceania | Medium term (2–4 years) |
| Satellite–NIR pasture intelligence | +1.7% | Australia, New Zealand, Latin America, Africa | Medium term (2–4 years) |
| Cooperative mobile testing hubs | +1.5% | India, Africa, Southeast Asia, Latin America | Short term (≤2 years) |
| Feed-mill QA platform integration | +1.3% | China, India, ASEAN, Latin America | Medium term (2–4 years) |
| Calibration-data network roll-up | +1.2% | North America, EU, APAC | Long term (≥4 years) |
| Drought-indexed advisory services | +1.0% | North America, Australia, Southern Africa | Short term (≤2 years) |
Challenges Analysis
Calibration-Model Drift
NIR-based forage analysis is only as reliable as its calibration population, yet forage spectra shift continuously with crop species, maturity, harvesting method, soil condition, drying profile, fermentation, storage, particle size, residual moisture and regional weather; a model trained primarily on temperate maize silage or alfalfa can become less robust when applied to drought-stressed tropical grasses, mixed pasture, novel cover-crop silages or high-ash forage.
This is a continuing technical challenge rather than a sales-stopping restraint because NIR remains valuable for screening, but model drift can force 5–15% of samples into outlier review, require 50–200 additional wet-chemistry reference samples for a meaningful local recalibration, and add 2–6 weeks before a new forage class is commercially reportable. Recent research illustrates the risk: a local NIRS model achieved adequate ash screening performance but poor predictive performance for dry matter and moisture where sample-preparation consistency and calibration variability were insufficient.
Providers must therefore maintain rolling reference libraries, cross-instrument standardization, outlier flags, seasonal recalibration and wet-chemistry confirmation, raising annual data-science and laboratory costs by an estimated 5–10% of revenue and exerting a 1.3-percentage-point drag on unconstrained market growth, especially in biologically diverse and climate-volatile forage regions.
Challenges Impact Analysis
| Challenge | (~) % CAGR Friction Drag | Geographic Relevance | Mitigation Horizon |
|---|---|---|---|
| Calibration-model drift | -1.3% | Global; tropical APAC, Africa, Latin America | Long term (≥4 years) |
| Reference-lab talent scarcity | -1.1% | North America, EU, APAC | Medium term (2–4 years) |
| Fragmented farm-data systems | -1.0% | Global; North America, EU, APAC | Long term (≥4 years) |
| Sample-chain logistics variability | -0.9% | Rural Africa, Latin America, APAC | Medium term (2–4 years) |
| Climate-driven forage heterogeneity | -1.2% | Europe, Oceania, Americas, Africa | Long term (≥4 years) |
| Method standardization gaps | -0.8% | Global export and multi-lab networks | Medium term (2–4 years) |
Geopolitical Impact Analysis
FAO reported in March 2026 that Ukraine’s 2025 cereal production was about 5% below average, while approximately 5.4 million hectares were planted with winter cereals for 2026, still below normal levels because the war continued to restrict access to farmland. Reduced grain availability and unstable feed costs encourage livestock producers to depend more carefully on locally available hay, silage, and pasture, increasing the value of nutrient, dry-matter, fiber, and contamination testing.
The Middle East conflict is creating another layer of uncertainty. FAO stated that disruption around the Strait of Hormuz is raising risks for global energy and fertilizer supplies, increasing agricultural production costs. At the same time, FEFAC expects EU compound-feed production to reach about 152 million tonnes in 2026, including 45.358 million tonnes of cattle feed. As commercial feed prices and ingredient availability fluctuate, livestock farms are likely to optimize home-grown forage more closely.
Regional Insights
North America dominates the forage analysis market with a 45.00% share, valued at about USD 0.90 billion, supported by a large cattle population, extensive hay production, and strong use of laboratory-based feed testing. In July 2026, the USDA reported 94.2 million cattle and calves on U.S. farms, including 9.65 million milk cows. USDA also estimated 2025 U.S. dry hay production at 123 million tons from 49.6 million acres. Canada strengthens the regional base, with Statistics Canada reporting 12.1 million cattle and calves in July 2026, up 3.2% year over year. These volumes sustain demand for nutrient, dry-matter, fiber, and silage testing.
Asia Pacific is emerging as the fastest-growing regional segment as commercial livestock production, dairy output, and feed-quality management expand across major agricultural economies. China’s National Bureau of Statistics reported 2025 beef production of 8.01 million tons, up 2.8%, while milk production reached 40.91 million tons. Australia also maintains a large forage-dependent livestock industry; the Australian Bureau of Statistics recorded 29.7 million cattle on holdings at the end of June 2025, including 27.6 million beef cattle and 2.1 million dairy cattle. Large herds, pasture-based feeding systems, and stronger focus on ration efficiency are encouraging laboratories and producers to adopt more frequent forage quality assessment.
Key Regions and Countries Insights
- North America
- US
- Canada
- Europe
- Germany
- France
- The UK
- Spain
- Italy
- Rest of Europe
- Asia Pacific
- China
- Japan
- South Korea
- India
- Australia
- Rest of APAC
- Latin America
- Brazil
- Mexico
- Rest of Latin America
- Middle East & Africa
- GCC
- South Africa
- Rest of MEA
Key Players Analysis
SGS S.A. holds a strong position in forage analysis through its accredited feed and forage testing services, covering nutritional constituents, mycotoxins, chemical residues, microbiology, particle size, NIR and wet chemistry. In 2025, SGS generated CHF 6.945 billion in sales, up 2.2%, while organic growth reached 5.6%. Adjusted operating income rose to CHF 1.108 billion, with a 16.0% margin.
Eurofins Scientific SE is a major forage analysis provider through Eurofins Agro Testing and its wider food and feed laboratory network. The company operates more than 300 food and feed testing laboratories and offers forage testing for energy, protein, minerals, preservation and fiber characteristics. In 2025, Eurofins reported revenue of EUR 7.296 billion, up 5.0%, while organic growth reached 3.7%.
Intertek Group plc supports the forage analysis market through agricultural, grain and feedstuff testing, inspection and quality-assurance services. Its laboratories assess feed materials using recognized international standards and support moisture, contaminants, composition and other quality parameters across feed supply chains. In 2025, Intertek recorded revenue of GBP 3.432 billion, while adjusted operating profit reached GBP 619.6 million and adjusted operating margin improved to 18.1%.
Top Key Players Outlook
- SGS S.A.
- Eurofins Scientific SE
- Intertek Group plc
- Cargill, Incorporated
- Cumberland Valley Analytical Services, Inc.
- Hill Laboratories Limited
- Cawood Scientific Limited
- ServiTech, Inc.
- Dairyland Laboratories, Inc.
- Dairy One Cooperative, Inc.
- Minnesota Valley Testing Laboratories, Inc.
- Massey Feeds Ltd.
- ALS Limited
- Rock River Laboratory, Inc.
- Bureau Veritas S.A.
Recent Developments
- In March 2026, its Global Mycotoxin Report covered 389,926 analyses across 41 countries, with 71% of samples testing positive for at least one mycotoxin.
- In September 2025, Cumberland Valley Analytical Services, Inc U.S. Department of Agriculture’s Agricultural Research Service awarded CVAS a chemical/biological analysis contract valued at about USD 16,000, showing its involvement in agricultural research testing.
Report Scope
| Report Features | Description |
|---|---|
| Market Value (2025) | USD 1.3 Bn |
| Forecast Revenue (2035) | USD 2.3 Bn |
| CAGR (2026-2035) | 5.9% |
| Base Year for Estimation | 2025 |
| Historic Period | 2020-2024 |
| Forecast Period | 2026-2035 |
| Report Coverage | Revenue Forecast, Market Dynamics, Competitive Landscape, Recent Developments |
| Segments Covered | By Target / Testing Parameter(Nutrients, Dry matter, Mycotoxins, Others), By Livestock Type (Cattle, Equine, Sheep and goats), By Forage Type (Hay, Silage, Ration formulations), By Analytical Method ( Near-Infrared Spectroscopy (NIRS), Wet chemistry / Chemical analysis, Molecular diagnostics) |
| Regional Analysis | North America – US, Canada; Europe – Germany, France, The UK, Spain, Italy, Rest of Europe; Asia Pacific – China, Japan, South Korea, India, Australia, Singapore, Rest of APAC; Latin America – Brazil, Mexico, Rest of Latin America; Middle East & Africa – GCC, South Africa, Rest of MEA |
| Competitive Landscape | SGS S.A., Eurofins Scientific SE, Intertek Group plc, Cargill, Incorporated, Cumberland Valley Analytical Services, Inc., Hill Laboratories Limited, Cawood Scientific Limited, ServiTech, Inc., Dairyland Laboratories, Inc., Dairy One Cooperative, Inc., Minnesota Valley Testing Laboratories, Inc., Massey Feeds Ltd., ALS Limited, Rock River Laboratory, Inc., Bureau Veritas S.A. |
| Customization Scope | Customization for segments, region/country-level will be provided. Moreover, additional customization can be done based on the requirements. |
| Purchase Options | We have three licenses to opt for: Single User License, Multi-User License (Up to 5 Users), Corporate Use License (Unlimited User and Printable PDF) |





































