


Report Overview
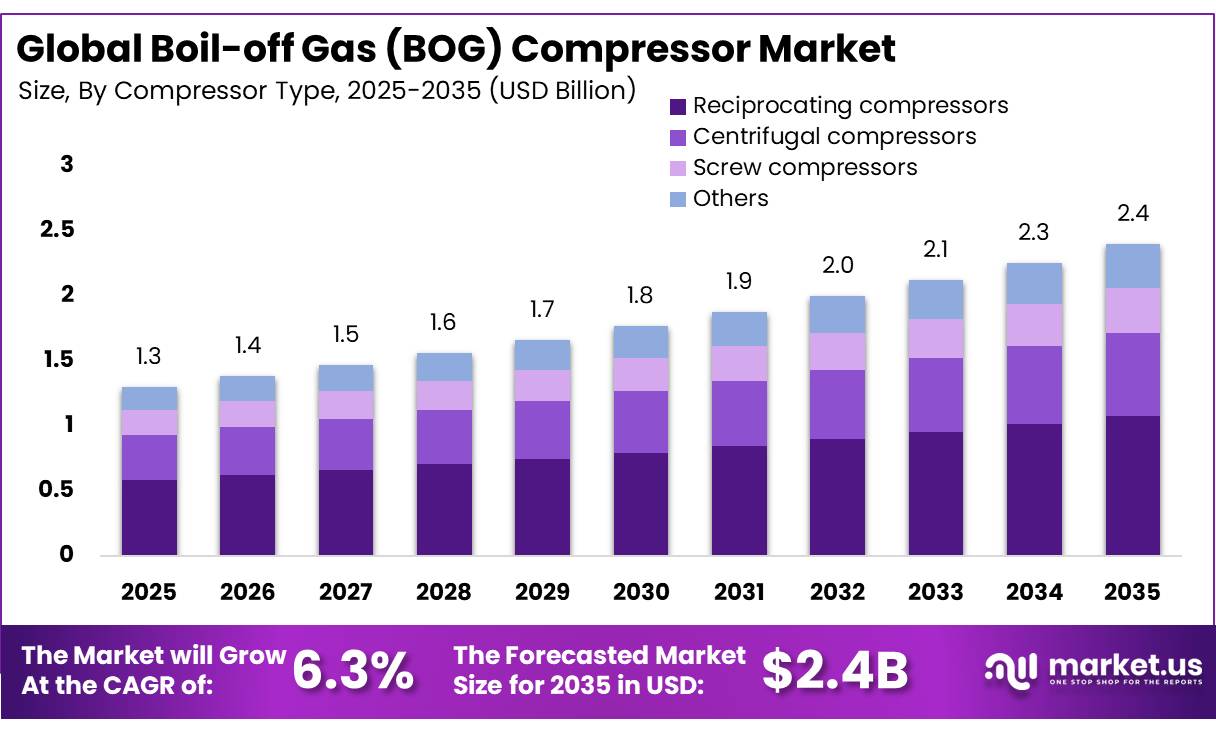
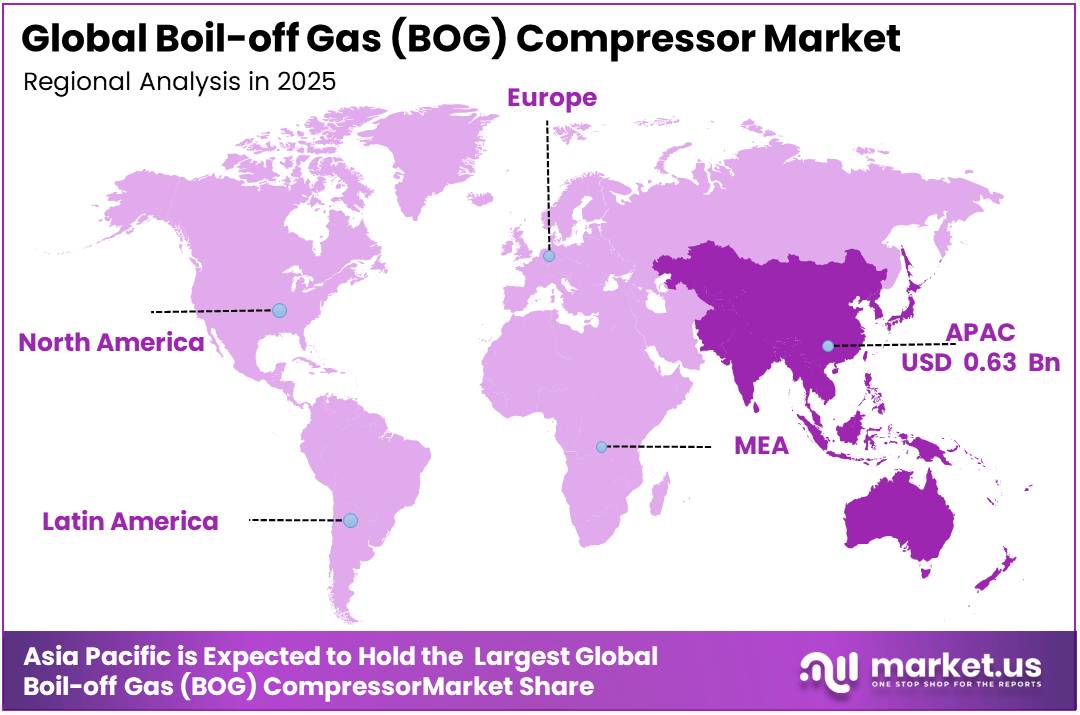
In 2025, the Global Boil-off Gas (BOG) Compressor Market was valued at USD 1.3 Billion, and between 2026 and 2035, this market is estimated to register a CAGR of 6.3%, reaching about USD 2.4 Billion by 2035. Asia Pacific held a dominant market position, capturing more than a 48.2% share, holding USD 0.63 Billion in revenue.
Boil-off Gas (BOG) refers to natural gas that evaporates from liquefied natural gas (LNG) cargo tanks due to heat ingress during storage and transport, and BOG compressors recover this vapor for reliquefaction, onboard fuel use, or pipeline reinjection rather than venting or flaring it.
- The relevance of this equipment is tied directly to the scale of global LNG trade, which grew 2.4% in 2024 to reach 411.24 million tonnes, connecting 22 exporting markets with 48 importing markets, according to the International Gas Union (IGU).
Key Takeaways
- The Global Boil-off Gas (BOG) Compressor Market was valued at USD 1.3 billion in 2025.
- The Global market is projected to grow at a CAGR of 6.3% and is estimated to reach USD 2.4 billion by 2035.
- On the basis of compressor type, Reciprocating Compressors dominated the market, constituting 45.1% of the total market share.
- Based on the application, Onshore LNG Terminals dominated the market, accounting for 30.2% of the total market share.
- Based on the pressure level, High-pressure BOG Compressors dominated the market, accounting for 70.2% of the total market share.
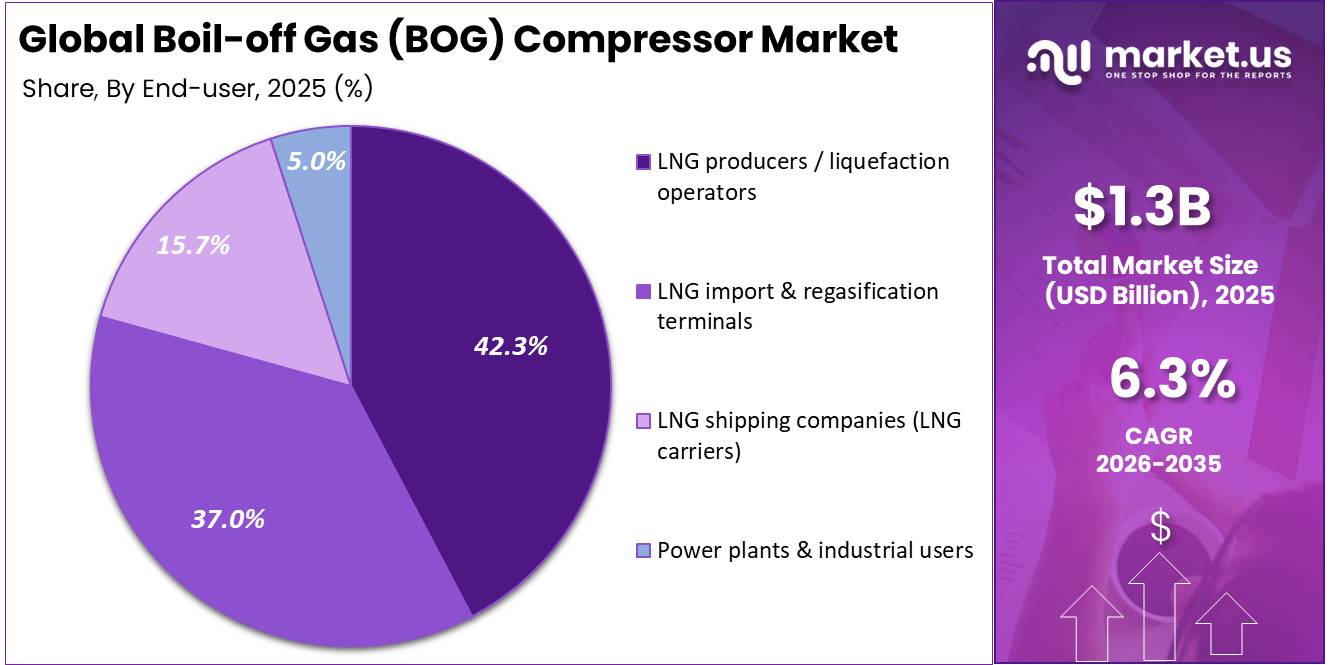
- Based on the end user, LNG Producers / Liquefaction Operators dominated the market, accounting for 42.3% of the total market share.
- In 2025, Asia Pacific was the most dominant region in the Boil-off Gas (BOG) Compressor market, accounting for 48.2% of the global market.
The industrial scenario reflects continued expansion of LNG shipping and export infrastructure that generates recurring BOG handling requirements across carriers, storage tanks, and regasification terminals. Global LNG trade volumes climbed further to a record 56.3 billion cubic feet per day (Bcf/d) in 2025, up 5.4% year on year, with United States exports rising 26% to 15.1 Bcf/d, according to the U.S. Energy Information Administration (EIA). The United States, Qatar, and Australia together accounted for 63% of global LNG exports in 2025, up from 60% in 2024, per the same EIA data.
- Driving factors and growth opportunities stem from projected continued export growth, with the EIA forecasting U.S. LNG exports reaching 17.4 Bcf/d in 2026 and 18.6 Bcf/d in 2027, sustaining demand for efficient BOG recovery systems across new carriers and terminals.
On government initiatives, the International Maritime Organization (IMO) adopted the 2023 Strategy on Reduction of Greenhouse Gas (GHG) Emissions from Ships at its Marine Environment Protection Committee 80 (MEPC 80) session, targeting net-zero GHG emissions from international shipping by or around 2050, with indicative checkpoints of at least 20% (striving for 30%) reduction by 2030 and 70%-80% by 2040, against a 2008 baseline, reinforcing pressure to minimize BOG venting and flaring through compression and reliquefaction.
By Compressor Type
Reciprocating compressors dominate with 45.1% share due to their reliable performance in high-pressure LNG operations.
In 2025, Reciprocating compressors held a dominant market position, capturing more than a 45.1% share in the Global Boil-off Gas (BOG) Compressor Market. Their strong position was supported by their ability to handle high-pressure boil-off gas efficiently while maintaining stable performance across LNG liquefaction plants, import terminals, storage facilities, and LNG carriers. These compressors are widely preferred for applications that require precise gas handling, operational flexibility, and dependable performance under varying load conditions.
Centrifugal compressors are expected to be the fastest-growing segment during the forecast period as LNG infrastructure continues to expand with larger processing capacities and higher throughput requirements. These compressors are increasingly selected for projects where continuous operation, lower vibration, and reduced maintenance are important considerations. Their ability to manage large gas volumes efficiently makes them well suited for modern LNG terminals and large-scale processing facilities.
By Application
Onshore LNG terminals lead with 30.2% share driven by expanding LNG import and storage infrastructure.
In 2025, Onshore LNG terminals held a dominant market position, capturing more than a 30.2% share in the Global Boil-off Gas (BOG) Compressor Market. Their leading position was supported by the growing need to safely recover and compress boil-off gas generated during LNG storage, unloading, and regasification activities. These terminals operate continuously and require dependable gas handling systems to maintain operational efficiency while minimizing product losses. Boil-off gas compressors play an essential role in returning evaporated gas to the process, supporting stable terminal operations and compliance with established LNG handling practices.
LNG liquefaction plants are expected to be the fastest-growing application segment during the forecast period as additional liquefaction capacity is developed to meet rising global LNG demand. These facilities depend on efficient boil-off gas management throughout the liquefaction process to improve operational performance and maximize gas recovery. As new liquefaction projects are commissioned and existing plants undergo capacity expansion, the need for advanced BOG compression systems is expected to increase.
By Pressure Level
High-pressure BOG compressors dominate with 70.2% share due to their critical role in LNG gas recovery and transfer.
In 2025, High-pressure BOG compressors held a dominant market position, capturing more than a 70.2% share in the Global Boil-off Gas (BOG) Compressor Market. Their leading position was supported by their essential role in compressing boil-off gas for reinjection, gas transfer, and efficient handling across LNG liquefaction plants, storage terminals, and LNG carriers. These compressors are widely used where reliable high-pressure gas movement is necessary to maintain stable LNG operations and reduce product losses.
Medium-pressure BOG compressors are expected to be the fastest-growing segment during the forecast period as LNG operators increasingly seek flexible compression solutions for a wider range of operating conditions. These compressors are gaining attention in applications where balanced pressure requirements, energy efficiency, and dependable gas handling are important. They are well suited for facilities looking to optimize operational performance while supporting safe boil-off gas recovery.
By End-user
LNG producers and liquefaction operators lead with 42.3% share as boil-off gas recovery remains essential during LNG production.
In 2025, LNG producer’s / liquefaction operators held a dominant market position, capturing more than a 42.3% share in the Global Boil-off Gas (BOG) Compressor Market. Their leading position was driven by the continuous need to recover and recompress boil-off gas generated during LNG production and liquefaction processes. BOG compressors are a vital part of liquefaction facilities, helping operators return evaporated gas back into the process, improve operational efficiency, and reduce product losses.
LNG import & regasification terminals are expected to be the fastest-growing end-user segment during the forecast period as more countries expand LNG import infrastructure to strengthen energy security and diversify natural gas supplies. These terminals rely on boil-off gas compressors to manage gas generated during unloading, storage, and regasification while maintaining smooth terminal operations. Growing investments in new import terminals and the modernization of existing facilities are increasing the need for efficient gas recovery systems.
Key Market Segments
By Compressor Type
- Reciprocating compressors
- Centrifugal compressors
- Screw compressors
- Others
By Application
- Onshore LNG terminals
- LNG liquefaction plants
- LNG transportation (LNG carriers)
- LNG storage (dedicated storage facilities)
- Small-scale / satellite & other LNG uses
By Pressure Level
- High-pressure BOG compressors
- Medium-pressure BOG compressors
- Low-pressure BOG compressors
By End-user
- LNG producers / liquefaction operators
- LNG import & regasification terminals
- LNG shipping companies (LNG carriers)
- Power plants & industrial users
Driver Analysis
Record LNG Carrier Newbuild Orderbook Lifting Shipboard BOG Compressor Demand
The global LNG carrier orderbook entering 2026 sits at roughly 44-47% of the existing operating fleet of approximately 715-850 vessels, the highest orderbook-to-fleet ratio of any major shipping segment and a level that surpasses the 2006-2008 historical peak. South Korea alone commands close to 66% of this orderbook by capacity, with Hyundai Heavy Industries, Samsung Heavy Industries and Hanwha Ocean absorbing the bulk of build slots, and delivery cadence is expected to run 100-130 vessels annually through 2027-2028.
This orderbook boom is structurally shifting compressor suppliers away from one-off spare-part transactions toward multi-year framework supply agreements bundled with shipyard block contracts, compressing per-unit margins but securing multi-year revenue visibility and pushing BOM cost-down targets of 8-12% over successive vessel series as yards standardize on GTT membrane containment specifications paired with WinGD dual-fuel engines.
Drivers Impact Analysis
| Driver | (~) % Impact on CAGR | Geographic Relevance | Impact Timeline |
|---|---|---|---|
| Record LNG carrier newbuild orderbook lifting shipboard BOG compressor demand | +1.6% | South Korea core (Hyundai/Samsung/Hanwha yards), Northeast Asia spill-over, Qatar/Gulf offtake corridors | Short term (≤2 years) |
| IMO Net-Zero Framework and tightening GHG Fuel Intensity rules accelerating retrofit and re-liquefaction upgrades | +1.2% | EU/EEA ports, global flag-state fleets, APAC transshipment hubs | Medium term (2-4 years) |
| Upstream US Gulf Coast and North American liquefaction capacity expansion driving onshore terminal compressor demand | +1.4% | US Gulf Coast core, Canada (BC) spill-over, Mexico corridor | Medium term (2-4 years) |
| FSRU and small-scale LNG import terminal proliferation in emerging import markets | +0.9% | South & Southeast Asia core, South America spill-over, Middle East/Africa emerging | Long term (≥4 years) |
| LNG bunkering vessel and dual-fuel fleet expansion requiring compact marine BOG handling systems | +0.7% | Europe core (Rotterdam), APAC (Singapore) core, Americas emerging | Short term (≤2 years) |
| Electrification and digital twin-based compressor efficiency retrofits reducing boil-off losses per cargo cycle | +0.5% | EU core, North America, APAC technology adopters | Long term (≥4 years) |
Restraint Analysis
High capex and lifecycle OPEX for cryogenic BOG trains
High capex and elevated lifecycle OPEX remain the most immediate brake on BOG compressor adoption because a modern LNG liquefaction or large import terminal can easily see BOG compression packages account for 8–12% of total rotating-equipment capex and 3–5% of total project EPC cost, translating into incremental upfront spends of USD 25–60 million for multi-train complexes where overall budgets already sit in the USD 8–15 billion range for mega LNG projects.
At the vessel level, shipboard BOG systems for large LNG carriers often add USD 8–12 million per hull when factoring in compressors, variable-frequency drives, control systems, and integration with re-liquefaction or dual-fuel engines, which is material against newbuild prices that have risen above USD 260–270 million per 174k–180k m³ carrier amid the current yard backlog and steel-cost inflation.
The combination of high capex line items, elevated running costs and the need for significant contingency in maintenance budgets pushes internal hurdle rates higher for marginal FIDs and leads operators especially state-owned or emerging-market buyers with constrained balance sheets to defer or down‑spec compressor-intensive designs, contributing to 0.5–1.0 percentage point drag on otherwise robust mid‑single‑digit market CAGR via project postponements, phased build-outs and a preference for smaller, modular units that stretch revenue realization over longer timelines rather than concentrated upfront orders.
Restraint Impact Analysis
| Restraint | (~) % Impact on CAGR | Geographic Relevance | Impact Timeline |
|---|---|---|---|
| High capex and lifecycle OPEX for cryogenic BOG trains | -1.0% | Global, sharper in emerging LNG importers | Short–Medium term (≤4 years) |
| Long lead times and capacity bottlenecks at compressor OEMs | -0.8% | Asia-Pacific yards, Europe, North America | Short term (≤2 years) |
| LNG price volatility delaying LNG/FID and carrier orders | -0.7% | North America, Europe, Asia-Pacific corridors | Short–Medium term (≤4 years) |
| Regulatory complexity and evolving IMO/GHG rules | -0.6% | Global fleets; EU and EEA ports core | Medium term (2–4 years) |
| Competition from low-BOG and compression-light technologies | -0.5% | Large terminals in EU, Middle East, APAC | Long term (≥4 years) |
| Skilled cryogenic maintenance and digital talent gap | -0.4% | Africa, South America, parts of South/Southeast Asia | Long term (≥4 years) |
Opportunity Analysis
SaaS-based digital twins for BOG fleets
With modern LNG carriers handling on the order of 50–60 tonnes/day of BOG for 174k m³ NEXT1-type containment designs under typical conditions and onshore tanks managing comparable per-tank flows, a 3–5% improvement in compressor specific energy consumption and 10–15% reduction in unplanned downtime through predictive maintenance could translate to energy cost savings of USD 200,000–400,000 per ship per year and USD 1–2 million per mid‑scale terminal, creating a natural willingness to pay of 5–10% of those savings for analytics subscriptions.
If even 25% of the roughly 700+ carrier fleet plus 100+ major terminals adopt such SaaS platforms by 2030, recurring software and analytics revenue could reach the low hundreds of millions of dollars annually, equivalent to 7–10% of current hardware revenues, adding an estimated 1.0–1.2 percentage points of CAGR upside versus a hardware-only trajectory by creating higher-margin, less cyclical revenue streams and deepening lock-in around OEM compressor control logic and models.
Opportunity Impact Analysis
| Opportunity | (~) % Potential CAGR | Geographic Relevance | Execution Window |
|---|---|---|---|
| SaaS-based digital twins for BOG fleets | +1.2% | North America, EU, mature APAC LNG hubs | Short–Medium term (≤4 years) |
| Modular BOG packages for small-scale LNG & bunkering | +1.0% | APAC emerging, Middle East, Europe ports | Short term (≤2 years) |
| Integrated BOG systems for next-gen containment & reliquefaction | +0.9% | Korea/China yards, EU owners, GCC export hubs | Medium term (2–4 years) |
| Expansion into hydrogen, bio-LNG and e-LNG cryogenic compression | +0.8% | EU, Japan/Korea, North America | Long term (≥4 years) |
| Performance-based contracts tied to GHG intensity and cargo retention | +0.7% | Global blue-chip fleets and Tier-1 terminals | Medium–Long term (≥3 years) |
| M&A roll-up of regional compressor service shops | +0.6% | Africa, South America, South/Southeast Asia | Medium term (2–4 years) |
Challenges Analysis
Volatile LNG project sanctioning cycles
Transit times from FID to mechanical completion average 48–60 months for mega‑projects, and EPC phasing of equipment orders typically lags FID by 6–18 months, so any 12‑month slip in FID timing can cascade into a 2–3 year delay in BOG compressor revenue recognition, with portfolio‑level standard deviation in yearly LNG capex commitments often exceeding 25–30% around the trend line.
This cyclicality imposes friction drag because OEMs must hold buffer capacity in high‑skill machining, testing bays and project engineering teams that can absorb full order waves yet remain cost‑effective during troughs, resulting in utilization dips into the 60–75% range in weak years and unit economics penalties of several percentage points on gross margin as fixed overhead is spread over fewer shipped trains.
Long‑term mitigation—using risk‑sharing supply contracts with yards, building more modular compressor platforms that can flex between LNG and adjacent markets, and integrating scenario‑based capacity planning that assumes ±30% swings in order intake will take at least one investment cycle to normalize, and until then this FID amplitude is likely to impose around 1.0–1.1 percentage points of friction drag on the maximum CAGR that the BOG compressor market could otherwise sustain in a smoother sanctioning environment.
Challenges Impact Analysis
| Challenge | (~) % CAGR Friction Drag | Geographic Relevance | Mitigation Horizon |
|---|---|---|---|
| Volatile LNG project sanctioning cycles | -1.1% | North America export, EU/Asia import hubs | Medium term (2–4 years) |
| OEM–yard integration and execution risk | -0.9% | Korea/China yards, EU/Japan owners | Medium term (2–4 years) |
| Cryogenic component and logistics complexity | -0.8% | APAC shipbuilding, global LNG corridors | Long term (≥4 years) |
| Cybersecurity and OT–IT convergence risk | -0.7% | Global Tier-1 fleets and terminals | Long term (≥4 years) |
| Talent depth and aging workforce in cryogenics | -0.6% | EU, Japan/Korea, emerging LNG states | Long term (≥4 years) |
| Technology path uncertainty beyond LNG | -0.6% | EU decarbonization hubs, OECD markets | Long term (≥4 years) |
Geopolitical Impact Analysis
Middle East conflict increases LNG supply risks, driving stronger demand for reliable BOG compressor systems.
The ongoing conflict in the Middle East has significantly affected the Boil-off Gas (BOG) Compressor Market by disrupting LNG production, shipping routes, and global gas trade. BOG compressors are essential for recovering and recompressing evaporated LNG during liquefaction, storage, transport, and regasification, making them increasingly important as supply chains face greater uncertainty.
- According to the International Energy Agency (IEA), the Strait of Hormuz handled about 19% of global LNG trade in 2025, while 93% of Qatar’s LNG exports and 96% of the UAE’s LNG exports moved through this route.
The IEA also states that disruptions to the Strait could remove almost 20% of global LNG supply, creating strong pressure on LNG infrastructure and increasing the need for efficient boil-off gas management. In its 2026 Gas Market Report, the IEA noted that the Middle East crisis delayed new LNG capacity, increased price volatility, and disrupted shipping through the Strait of Hormuz.
As LNG terminal operators and producers focus on reducing gas losses and maintaining operational stability, investment in dependable BOG compression systems is expected to remain a priority. The conflict has also encouraged many LNG operators to strengthen storage, improve gas recovery efficiency, and modernize critical equipment to improve energy security and operational resilience.
Regional Analysis
Asia Pacific Regional Analysis: Boil-off Gas (BOG) Compressor Market.
Asia Pacific stands as the dominant region in the Boil-off Gas (BOG) compressor market, holding a share of 48.2% and valued at 0.63 billion, reflecting the region’s central role in global liquefied natural gas (LNG) trade flows and shipping activity.
- This dominance is grounded in the region’s position as the world’s largest LNG exporting hub, with the International Gas Union (IGU) reporting that Asia Pacific exported 138.91 million tonnes (MT) of LNG in 2024, adding 4.10 MT over the previous year, out of a global total of 411.24 MT moved that year. This scale of export activity translates directly into sustained demand for BOG compressors across liquefaction terminals, storage facilities, and the carrier fleet serving these routes.
On the import side, Asian countries brought in 35.7 billion cubic feet per day (Bcf/d) of LNG in 2025, a 4% decline from the prior year, largely driven by China reducing purchases by 15%, or 1.5 Bcf/d, as it leaned more on pipeline gas and domestic output, according to the U.S. Energy Information Administration (EIA). Even with this dip, the sheer volume passing through Asian ports keeps boil-off management equipment in continuous operational use across the region’s terminals and vessels calling there.
Key Regions and Countries Covered
- North America
- The US
- Canada
- Europe
- Germany
- France
- The UK
- Spain
- Italy
- Russia & CIS
- Rest of Europe
- APAC
- China
- Japan
- South Korea
- India
- ASEAN
- Rest of APAC
- Latin America
- Brazil
- Mexico
- Rest of Latin America
- Middle East & Africa
- GCC
- South Africa
- Rest of MEA
Key Players Analysis
Boil-off Gas (BOG) compressor manufacturers focus on improving compressor efficiency, operational reliability, and long-term performance to strengthen their position in the LNG industry. A major priority is the development of advanced compressor systems capable of handling boil-off gas under varying pressure conditions while reducing energy consumption and minimizing gas losses. Companies continue to enhance reciprocating and centrifugal compressor technologies with improved sealing systems, digital monitoring, and predictive maintenance features to increase equipment availability and reduce operating costs.
Strategic partnerships with EPC contractors, LNG plant developers, and terminal operators have become increasingly common to secure long-term contracts. Companies are also investing in automation, remote diagnostics, and digital asset management solutions that improve equipment performance throughout its operating life, while strengthening customer relationships through maintenance agreements, technical support, and lifecycle service offerings.
Market Key Players
- Atlas Copco Gas and Process
- Burckhardt Compression AG
- Siemens Energy
- Baker Hughes
- Elliott Group
- MAN Energy Solutions
- SIAD Macchine Impianti
- IHI Corporation
- Wittig
- Elang Compressor
- Suzhou Lmart Energy Equipment
- Jereh Group
- AZS Compressor
- Keepwin
- SBW – Shenyang Blower Works Group
Key Development
- In March 2026, Burckhardt Compression AG secured a major order from Hanwha Ocean (South Korea) to supply 14 boil-off gas (BOG) compressors for seven 174,000 m³ LNG carriers. The order marks the first commercial deployment of the company’s new high-pressure BOG compressor generation, built for Everllence’s ME-GI propulsion system operating at 330-bar gas injection pressure, and is described by the company as the largest single order in its Marine segment’s history.
- In July 2026, Baker Hughes secured substantial equipment awards from Bechtel and Cheniere for the Sabine Pass LNG facility in Cameron Parish, Louisiana. The scope covers primary liquefaction equipment, including main refrigerant compressors and gas turbines, for Train 7 and a dedicated boil-off gas re-liquefaction unit, supporting more than 6 million tonnes per annum (MTPA) of additional LNG production capacity, with equipment including seven PGT25+ G4 gas turbines driving 15 centrifugal compressors.
Report Scope
| Report Features | Description |
|---|---|
| Market Value (2025) | USD 1.3 Bn |
| Forecast Revenue (2035) | USD 2.4 Bn |
| CAGR (2026 2035) | 6.3% |
| Base Year for Estimation | 2025 |
| Historic Period | 2020-2024 |
| Forecast Period | 2026-2035 |
| Report Coverage | Revenue Forecast, Market Dynamics, Competitive Landscape, Recent Developments |
| Segments Covered | By Compressor Type (Reciprocating Compressors, Centrifugal Compressors, Screw Compressors, Others), By Application (Onshore LNG Terminals, LNG Liquefaction Plants, LNG Transportation (LNG Carriers), LNG Storage (Dedicated Storage Facilities), Small-scale / Satellite & Other LNG Uses), By Pressure Level (High-pressure BOG Compressors, Medium-pressure BOG Compressors, Low-pressure BOG Compressors), By End User (LNG Producers / Liquefaction Operators, LNG Import & Regasification Terminals, LNG Shipping Companies (LNG Carriers), Power Plants & Industrial Users) |
| Regional Analysis | North America The US & Canada; Europe Germany, France, The UK, Spain, Italy, Russia & CIS, Rest of Europe; APAC China, Japan, South Korea, India, ASEAN & Rest of APAC; Latin America Brazil, Mexico & Rest of Latin America; Middle East & Africa GCC, South Africa, & Rest of MEA |
| Competitive Landscape | Atlas Copco Gas and Process, Burckhardt Compression AG, Siemens Energy, Baker Hughes, Elliott Group, MAN Energy Solutions, SIAD Macchine Impianti, IHI Corporation, Wittig, Elang Compressor, Suzhou Lmart Energy Equipment, Jereh Group, AZS Compressor, Keepwin, and SBW – Shenyang Blower Works Group |
| Customization Scope | Customization for segments, region/country level will be provided. Moreover, additional customization can be done based on the requirements. |
| Purchase Options | We have three licenses to opt for: Single User License, Multi User License (Up to 5 Users), Corporate Use License (Unlimited Users and Printable PDF) |





































