


Report Overview
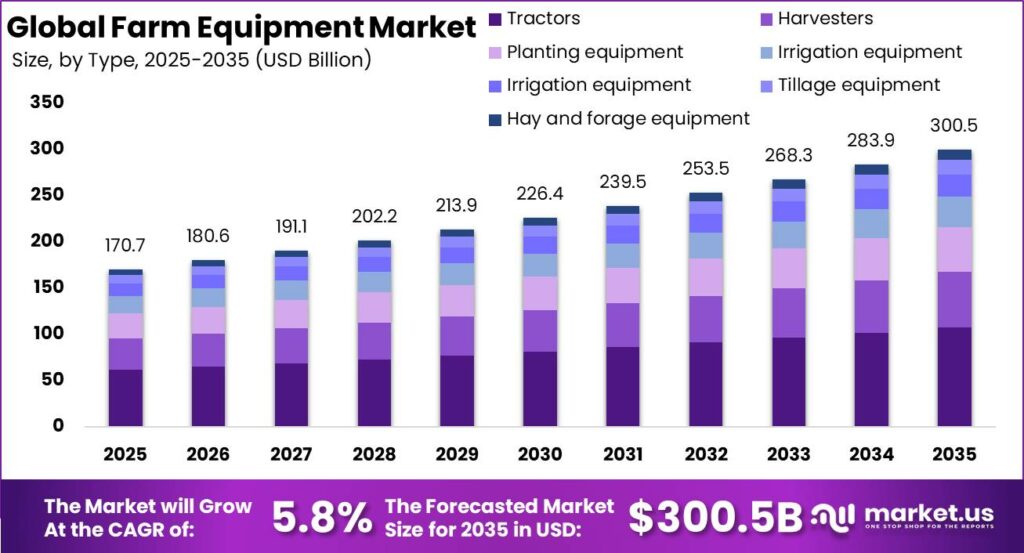
Global Farm Equipment Market size is expected to be worth around USD 300.50 Billion by 2035 from USD 170.70 Billion in 2025, growing at a CAGR of 5.8% during the forecast period 2026 to 2035. This growth path reflects steady replacement demand and rising mechanization across major farming economies. Equipment makers who align product cycles with this trajectory will capture durable share.
The farm equipment market covers autonomous tractors, tractors, harvesters, planting, irrigation, spraying, tillage, and hay and forage machines used across crop production. The market structures around type, application, technology, power source, and end user. This segmentation helps buyers match machine capability to farm size and task, giving vendors a clear map for targeted product positioning.
Key Takeaways
- Global Farm Equipment Market size reached USD 170.70 Billion in 2025 and will hit USD 300.50 Billion by 2035 at a CAGR of 5.8%.
- Tractors led the By Type segment with a 35.9% share, driven by broad multi-task field use.
- Harvesting and threshing dominated the By Application segment with a 40.1% share.
- Diesel held the largest By Power Source share at 56.7%, while Electric grew fastest.
- Large commercial farms controlled the By End-user segment with a 32.2% share.
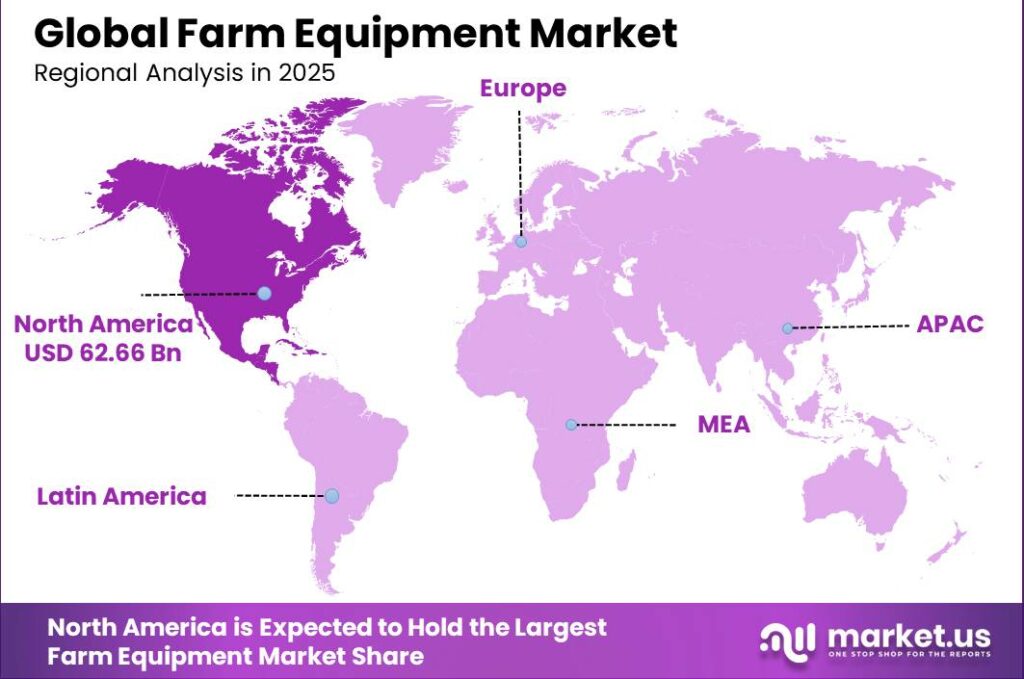
- North America led all regions with a 36.7% share, valued at USD 62.66 Billion.
Government mechanization support programs continue to widen equipment access across emerging economies. India shows how fast demand can climb when farm incomes and policy align. According to Tractor and Mechanization Association data reported in 2026, India recorded 1,090,281 domestic tractor sales in 2025, an increase of 19.8% over 910,155 units in 2024. This surge signals a fast-expanding buyer base that rewards vendors with strong dealer coverage.
Export demand reinforces this momentum for manufacturers based in India. Including exports, India’s 2025 tractor sales reached 1,195,287 units, up 18.6% from 1,007,900 units in 2024. This dual pull of domestic and export volume lets Indian producers scale output and lower per-unit cost. Companies that invest early in capacity here will hold a cost edge as global demand shifts toward affordable machines.
Product innovation now ties directly to rising farm productivity needs. In July 2025, Mahindra Tractors introduced its mLIFT precision-hydraulics system for tractor operations in farming and non-farming conditions. This feature raises task versatility and lifts machine value per unit sold. Manufacturers who add precision hydraulics can defend pricing as farmers demand more work from each tractor they own.
Type Analysis
Tractors dominate with 35.9% due to versatile multi task field capability.
In 2025, Tractors held a dominant market position in the By Type segment of Farm Equipment Market, with a 35.9% share. Data from Tractor and Mechanization Association reported in 2026 show India alone recorded 1,090,281 domestic tractor sales in 2025. This volume confirms tractors as the core mechanization entry point for most farms. Vendors that anchor lineups around versatile tractors secure the widest buyer funnel across farm sizes.
Harvesters serve the peak-season cutting and threshing role that farms cannot delay. CLAAS launched the JAGUAR 1000 Series forage harvesters in August 2025, comprising four models rated from 850 to 1,110 hp for throughput up to 500 tons per hour. This power range shows how harvesters target high-capacity commercial operations. Suppliers that push throughput gains win the fastest-growing segment share.
Planting, spraying, and tillage equipment fill specialized field tasks tied to crop timing. The CLAAS AXOS 3 tractor range introduced in 2025 comprises 4 models rated at 92, 103, 112, and 120 horsepower, showing the mid-power band that pairs with these implements. The Fendt 720 to 726 Vario Generation 7.1 range covers 203 to 263 horsepower, while the Fendt 728 reaches 303 horsepower. This spread lets farms match power to implement load precisely.
Irrigation and hay and forage equipment complete the lineup for water management and feed production. Case IH’s current Steiger tractor series spans 425 to 785 horsepower, quantifying the high-power range that drives these heavy-draft operations. Planting equipment, irrigation equipment, spraying equipment, tillage equipment, and hay and forage equipment together hold the remaining share. Vendors covering this full range can bundle systems and lift average order value.
Application Analysis
Harvesting and threshing dominates with 40.1% due to high value crop recovery timing.
In 2025, Harvesting and threshing held a dominant market position in the By Application segment of Farm Equipment Market, with a 40.1% share. New Holland’s next-generation CR combines use a 343 gallon fuel tank in the CR10 and a 396 gallon tank in the CR11 to reduce refuelling interruptions. This design targets uninterrupted harvest windows where every hour counts. Vendors that cut downtime win priority in this high-stakes application.
Land development and seedbed preparation ranks as the fastest-growing application as farms expand arable output. New Holland’s 2025 hybrid telehandler prototype offers a maximum lift height of 7 to 9 metres and a lifting capacity of 4.2 tonnes for material handling in these tasks. This capability speeds field readiness before planting. Suppliers serving prep-stage machinery capture demand at the start of every crop cycle.
Sowing and planting, weed cultivation, and plant protection cover the mid-cycle field tasks that protect yield. In 2025, John Deere launched automation, digital and machine enhancements for its model-year 2026 combines, including Harvest Settings Automation and predictive ground-speed technology. These tools raise input precision across the crop cycle. Vendors that automate mid-cycle tasks reduce labor need and lift buyer loyalty.
Post-harvest and agro-processing closes the application chain after grain leaves the field. Sowing and planting, weed cultivation, plant protection, and post-harvest and agro-processing together hold the remaining share below harvesting. This spread shows demand exists across the full crop cycle, not just at harvest. Vendors offering machines for each stage can lock in repeat purchases year round.
Technology Analysis
Fully automated equipment grows fastest with 37.4% due to labor saving autonomous operation gains.
In 2025, Fully automated equipment held a leading growth position in the By Technology segment of Farm Equipment Market, with a 37.4% share as the fastest-growing category. As per our research, US farms adopting guidance and autosteering crossed the majority threshold on major crop acreage by 2024. This shift proves automation demand is mainstream, not niche. Vendors that lead in autonomy features will capture the fastest revenue growth
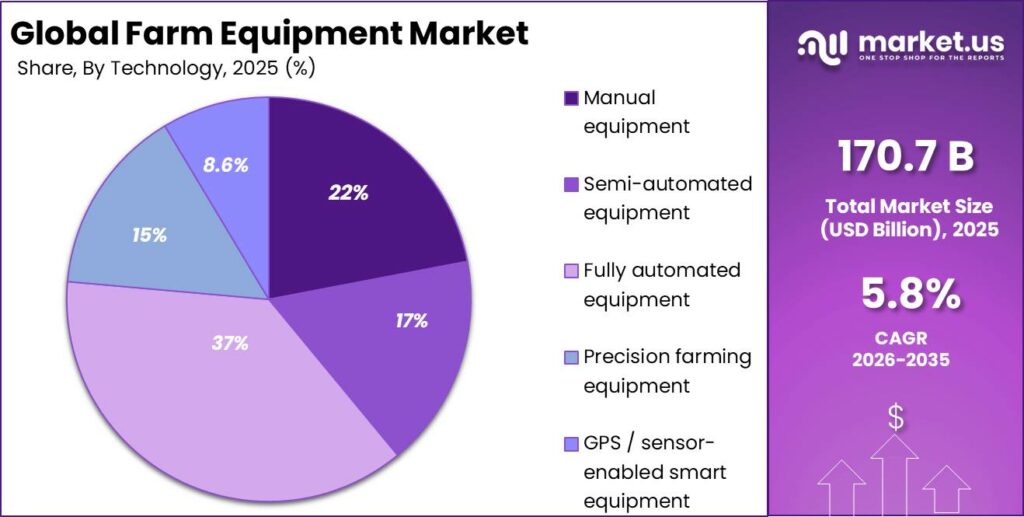
Precision farming equipment builds on data-led field management for higher yield accuracy. GPS and sensor-enabled smart equipment adds real-time positioning that guides seeding and spraying with tight margins. These technologies reduce input waste and raise per-hectare returns for farmers. Suppliers that embed connectivity can charge premium prices and earn recurring service revenue.
Manual and semi-automated equipment still serve cost-sensitive and small-scale operations worldwide. Manual equipment and semi-automated equipment together hold demand where capital budgets stay tight. This split shows a clear price ladder from basic to autonomous machines. Vendors that offer entry-tier models keep a foothold in emerging markets while upselling automation over time.
Power Source Analysis
Diesel dominates with 56.7% due to proven torque and refuelling reach.
In 2025, Diesel held a dominant market position in the By Power Source segment of Farm Equipment Market, with a 56.7% share. The New Holland T7.270 Methane Power tractor produces 270 horsepower and peak torque of 1,160 Nm from its 6.7 litre engine, showing the power bar alternative fuels must match. This benchmark keeps diesel the default for heavy field work. Vendors must match diesel torque before farmers switch fuels at scale.
Electric equipment ranks as the fastest-growing power source as farms target lower running costs. New Holland’s hybrid agricultural telehandler achieved up to 70% lower energy consumption than diesel alternatives during 2025 field tests. This efficiency gain directly cuts fuel spend per hour of operation. Early movers in electric drivetrains will capture buyers focused on operating cost and emissions rules.
Hybrid systems bridge diesel reliability with electric efficiency for transitional buyers. The same hybrid telehandler demonstrated 30% better performance, efficiency, and operating autonomy than a comparable diesel vehicle. This gain lets farms cut fuel use without full battery dependence. Vendors offering hybrids can win cautious buyers who want savings without range anxiety.
End-user Analysis
Large commercial farms dominate with 32.2% due to high capacity fleet purchasing power.
In 2025, Large commercial farms held a dominant market position in the By End-user segment of Farm Equipment Market, with a 32.2% share. As per our research, large operators adopt precision and yield-mapping tools far more than smaller farms. This scale advantage lets them justify high-cost automated fleets. Vendors targeting large farms secure the highest per-order revenue in the market.
Medium farms rank as the fastest-growing end-user group as mechanization spreads downward. These buyers seek versatile mid-power machines that handle multiple tasks affordably. This demand rewards vendors who offer flexible, mid-range lineups. Suppliers that serve medium farms tap the fastest-expanding buyer pool in the segment.
Small farms and agricultural contractors round out the end-user base with distinct buying needs. Small farms favor low-cost entry machines, while agricultural contractors buy for shared high-utilization service work. Small farms and agricultural contractors together hold the remaining share. Vendors that price for small farms and build durability for contractors can serve both without one product line.
Key Market Segments
By Type
- Tractors
- Harvesters
- Planting equipment
- Irrigation equipment
- Spraying equipment
- Tillage equipment
- Hay and forage equipment
By Application
- Land development and seedbed preparation
- Sowing and planting
- Weed cultivation
- Plant protection
- Harvesting and threshing
- Post-harvest and agro-processing
By Technology
- Manual equipment
- Semi-automated equipment
- Fully automated equipment
- Precision farming equipment
- GPS / sensor-enabled smart equipment
By Power Source
- Diesel
- Electric
- Hybrid
By End-user
- Small farms
- Medium farms
- Large commercial farms
- Agricultural contractors
Regional Analysis
North America Dominates the Farm Equipment Market with a Market Share of 36.7%, Valued at USD 62.66 Billion
North America led the Farm Equipment Market in 2025 with a 36.7% share, valued at USD 62.66 Billion. High labor costs and large farm sizes push growers toward automated, high-capacity machines. This structure supports premium equipment demand and strong replacement cycles. Vendors that lead in automation and dealer service will hold this profitable region against new entrants.
Asia Pacific ranks as the fastest-growing region on the back of rising mechanization. In June 2025, CNH introduced an integrated AI-based spraying system for Case IH, New Holland, and Miller sprayers that detects weeds through camera sensing and applies inputs selectively. This technology suits large acreage where input savings scale fast. Vendors that localize such systems can win share as regional farms modernize equipment fleets.
Key Regions and Countries
North America
- US
- Canada
Europe
- Germany
- France
- The UK
- Spain
- Italy
- Rest of Europe
Asia Pacific
- China
- Japan
- South Korea
- India
- Australia
- Rest of APAC
Latin America
- Brazil
- Mexico
- Rest of Latin America
Middle East and Africa
- GCC
- South Africa
- Rest of MEA
Market Dynamics
Market Opportunity Analysis - Underserved power sources, medium farms, and emerging regions offer clear entry points for new players
Electric equipment stands out as an underexploited By Power Source segment despite its fastest-growing status. Diesel still holds 56.7% of the market, leaving electric with room to convert cost-focused buyers over time. This gap favors early entrants who build reliable electric drivetrains now. Instead of chasing diesel head-on, new players can own the electric niche before incumbents fully commit capacity.
Medium farms represent an underserved By End-user group between low-cost small farms and premium large operators. Large commercial farms hold 32.2% of the segment, yet medium farms grow fastest with less vendor focus. This creates open space for flexible mid-range machines priced for growing operations. New entrants that target medium farms can build loyalty before these buyers scale to premium fleets.
Asia Pacific remains an underexploited region relative to North America’s 36.7% lead worth USD 62.66 Billion. Rising mechanization there outpaces vendor presence, leaving share open for localized players. This gap rewards firms that adapt products to regional farm sizes and budgets. Consequently early movers who localize now can capture the fastest-growing regional demand ahead of global brands.
Technology and Innovation Landscape - Autonomy, AI sensing, and alternative-power drivetrains redefine competitive edges
Autonomous machines now lead the innovation race as fully automated equipment grows fastest at 37.4% share. John Deere introduced second-generation autonomy kits for 9RX tractors and autonomous 5ML orchard tractors in 2025. This shift lets farms cut labor need and run longer field hours. Manufacturers that master autonomy will set the pace for premium pricing and buyer lock-in.
AI-based sensing reshapes input application across spraying and harvesting tasks. CNH introduced an integrated AI spraying system that detects weeds through camera sensing and applies inputs selectively. This precision cuts chemical waste and lowers per-hectare cost for farmers. Vendors that embed AI sensing can charge premiums and defend margin as buyers seek measurable input savings.
Alternative-power drivetrains open a new innovation front as electric ranks fastest-growing by power source. New Holland’s hybrid telehandler cut energy consumption by up to 70% and lifted 4.2 tonnes in 2025 tests. This proves clean drivetrains can match heavy-duty demands. Early movers in hybrid and electric power will win emissions-focused buyers before diesel loses its cost edge.
Drivers
Precision functionality is shifting farm-equipment economics from one-time machinery sales toward premium hardware, software-enabled upgrades, connectivity services, and recurring support revenue. USDA Economic Research Service data show that guidance and autosteering systems were used by 52% of midsize and 70% of large-scale US crop farms in 2023, while yield and soil-mapping tools reached 68% of large farms. USDA acreage analysis also found guidance systems operating across more than 50% of corn, soybean, cotton, and winter-wheat acreage by the start of the 2024 to 2025 grounding period.
According to the European Commission, national Common Agricultural Policy plans continued supporting agricultural digitalization during 2024 and 2025, while the EU Data Act became applicable on 12 September 2025, strengthening farmers’ access to data from connected machinery. These milestones widen retrofit and factory-installed adoption and support an estimated 3% to 7% equipment price premium. Therefore this driver plausibly adds 1.4 percentage points to the baseline 5.8% CAGR.
| Driver | (~) % Impact on CAGR Forecast | Geographic Relevance | Impact Timeline |
|---|---|---|---|
| Precision Technology Integration | +1.4% | North America, Western Europe, Australia | Short term (2 years or less) |
| Rising Agricultural Labor Costs | +1.1% | North America, Europe, East Asia | Short term (2 years or less) |
| Mechanization Support Programs | +0.9% | India, Southeast Asia, Africa | Medium term (2 to 4 years) |
| Equipment Replacement Cycle | +0.7% | North America, Europe, Japan | Medium term (2 to 4 years) |
| Farm Consolidation | +0.5% | Americas, Europe, Australia | Long term (4 years or more) |
| Harvest Efficiency Requirements | +0.4% | Global Grain-Producing Regions | Short term (2 years or less) |
Restraints
Lower crop returns and high operating expenses are forcing farmers to preserve liquidity, extend machine lives, and defer fleet replacement. USDA National Agricultural Statistics Service data put total US farm production expenditure in 2024 at 0.9% below 2023, with tractors and self-propelled machinery representing 4.4% of spending. USDA-linked analysis projected inflation-adjusted net cash income for US corn and soybean farms to fall about 35% and 36% between 2023 and 2024.
CEMA recorded only 144,400 agricultural-tractor registrations in Europe during 2024, a 10 year low, while US tractor sales stayed under pressure through 2025. This cash-flow contraction pushes replacement intervals out by an estimated 12 to 24 months and can compress manufacturer operating margins by roughly 100 to 250 basis points. As a result this restraint produces an estimated 1.5 percentage-point deduction from the baseline 5.8% CAGR.
| Restraint | (~) % Impact on CAGR Forecast | Geographic Relevance | Impact Timeline |
|---|---|---|---|
| Weak Farm Purchasing Power | -1.5% | North America, Europe, Latin America | Short term (2 years or less) |
| Elevated Equipment Financing Costs | -1.2% | Global Credit-Dependent Markets | Short term (2 years or less) |
| High Upfront Acquisition Cost | -0.8% | Emerging Markets, Smallholder Regions | Medium term (2 to 4 years) |
| Used-Equipment Substitution | -0.6% | North America, Europe, South Asia | Short term (2 years or less) |
| Fragmented Landholdings | -0.5% | South Asia, Southeast Asia, Africa | Long term (4 years or more) |
| Uncertain Subsidy Disbursement | -0.3% | Selected Emerging Economies | Medium term (2 to 4 years) |
Challenges
Farm equipment’s growing dependence on controllers, sensors, positioning modules, and displays has created a broader bill-of-materials risk than mechanical platforms carried. USDA Economic Research Service data show guidance systems installed at 52% of midsize and 70% of large US crop farms in 2023, showing the electronics dependence entering 2024 to 2025. CEMA’s 2024 registration total of 144,400 agricultural tractors illustrates how modest component disruptions can affect a weakened production base.
A shortage affecting components representing only 2% to 4% of unit cost can delay a full machine by roughly 4 to 12 weeks and raise expedited-logistics costs by an estimated 0.5% to 1.5% per unit. Therefore manufacturers need multi-sourced electronics, modular control units, and regional safety stocks covering 8 to 16 weeks. This residual friction is estimated to reduce maximum CAGR potential by 0.9 percentage points.
| Challenge | (~) % CAGR Friction Drag | Geographic Relevance | Mitigation Horizon |
|---|---|---|---|
| Electronics Supply Volatility | -0.9% | Global Manufacturing Hubs | Medium term (2 to 4 years) |
| Dealer Technician Shortages | -0.8% | North America, Europe, Australia | Long term (4 years or more) |
| Mixed-Fleet Interoperability Gaps | -0.7% | North America, Europe, Latin America | Medium term (2 to 4 years) |
| Parts Availability Variability | -0.6% | Africa, Latin America, Southeast Asia | Medium term (2 to 4 years) |
| Seasonal Demand Volatility | -0.4% | Global | Short term (2 years or less) |
| Emissions Compliance Complexity | -0.3% | Europe, North America, Japan | Long term (4 years or more) |
Opportunities
Equipment-as-a-service remains future white space because small, fragmented farms need mechanized operations for only brief seasonal windows and cannot support full asset ownership. The World Bank defines mechanization intensity through tractors per 100 square kilometers of arable land and links machinery use with expanded planted area. USDA precision-adoption evidence shows sharply lower technology use among farms below 350,000 in annual gross cash income than among larger operators.
European Commission analysis recognizes contractor and cooperative access as a practical route for precision-equipment use, confirming shared-capacity models without every farm owning machinery. Fleet pooling and pay-per-acre pricing could raise annual machine utilization from roughly 20% to 35% up to 50% to 70% and lower cost per hectare by an estimated 15% to 30%. This creates plausible upside of 1.2 percentage points beyond the baseline 5.8% CAGR.
| Opportunity | (~) % Potential CAGR Upside | Geographic Relevance | Execution Window |
|---|---|---|---|
| Equipment-as-a-Service Platforms | +1.2% | South Asia, Southeast Asia, Africa, Latin America | Medium term (2 to 4 years) |
| Autonomous Specialty-Crop Equipment | +1.0% | North America, Europe, Japan | Long term (4 years or more) |
| Connected Aftermarket Services | +0.8% | North America, Europe, Australia | Medium term (2 to 4 years) |
| Smallholder Modular Machinery | +0.7% | India, Africa, Southeast Asia | Medium term (2 to 4 years) |
| Alternative-Power Equipment | +0.5% | Europe, North America, East Asia | Long term (4 years or more) |
| Refurbishment Network Expansion | +0.4% | Emerging Markets | Short term (2 years or less) |
Key Company Insights
Deere & Company anchors its position through precision and harvesting technology that lifts output per machine. John Deere reports its current harvesting-equipment technology can deliver up to 48% more harvesting productivity, while HarvestLab 3000 grain sensing records data across 8 crops on newer combines. This data-led approach locks farmers into a connected ecosystem. However, heavy reliance on premium technology exposes the firm to buyers who defer high-cost purchases during weak farm income cycles.
CNH Industrial N.V. competes through a broad multi-brand lineup spanning Case IH and New Holland machines. Its Case IH Steiger series covering high-horsepower field work and New Holland alternative-power tractors give it reach across price and power tiers. This breadth lets CNH serve both premium and cost-sensitive buyers under one group. However, managing many brands and platforms raises complexity and can slow the pace of unified technology rollouts across its portfolio.
Key Players
- Deere & Company (John Deere)
- CNH Industrial N.V.
- AGCO Corporation
- Kubota Corporation
- CLAAS KGaA mbH
- Mahindra & Mahindra Limited
- Yanmar Co., Ltd
- SAME Deutz-Fahr
- Iseki & Co
- Escorts Kubota Limited
- JCB
- TAFE
- LOVOL
- Rostselmash
- Argo Tractors
Recent Developments
- January 2025: John Deere unveiled its second-generation autonomy kit for 9RX tractors and introduced autonomous 5ML orchard tractors at CES 2025.
- June 2025: John Deere launched the F8 and F9 Series self-propelled forage harvesters with new automation, crop-analysis and operator-assistance technologies.
- July 2025: CLAAS unveiled an upgraded LEXION combine-harvester range with an additional model, larger grain-tank options, new engines and an updated cab.
- July 2025: John Deere launched an enhanced digital self-repair tool that enables equipment owners to maintain, diagnose and repair connected machines.
- August 2025: CLAAS launched the JAGUAR 1000 Series forage harvesters, comprising four models rated from 850 to 1,110 hp and designed for throughput of up to 500 tons per hour.
Geopolitical Impact Analysis
Global trade tensions are reshaping farm-equipment supply chains as makers depend on cross-border electronics and steel. According to the WTO, world merchandise trade growth stayed near 2.7% in 2025, keeping component flows tight for machinery producers. As reported by the IMF, global inflation near 4.2% lifted financing and input costs for equipment factories. These pressures raise per-unit build costs and push manufacturers toward regional sourcing to protect delivery timelines.
Shipping disruptions further strain the movement of tractors, combines, and spare parts across regions. Data from the World Shipping Council show container rerouting around key chokepoints added roughly 10 to 14 days to some transit times during 2025. The World Bank notes energy price swings near 15% raised diesel and logistics costs for farm operations. Therefore equipment firms are building regional safety stocks and diversifying ports to shield harvest-season deliveries.
Report Scope
| Report Features | Description |
|---|---|
| Market Value (2025) | USD 170.70 Billion |
| Forecast Revenue (2035) | USD 300.50 Billion |
| CAGR (2026-2035) | 5.8% |
| Base Year for Estimation | 2025 |
| Historic Period | 2020-2024 |
| Forecast Period | 2026-2035 |
| Report Coverage | Revenue Forecast, Market Dynamics, Market Opportunity Analysis, Technology and Innovation Landscape, Competitive Landscape, Recent Developments |
| Segments Covered | By Type (Tractors, Harvesters, Planting equipment, Irrigation equipment, Spraying equipment, Tillage equipment, Hay and forage equipment), By Application (Land development and seedbed preparation, Sowing and planting, Weed cultivation, Plant protection, Harvesting and threshing, Post-harvest and agro-processing), By Technology (Manual equipment, Semi-automated equipment, Fully automated equipment, Precision farming equipment, GPS / sensor-enabled smart equipment), By Power Source (Diesel, Electric, Hybrid), By End-user (Small farms, Medium farms, Large commercial farms, Agricultural contractors) |
| Regional Analysis | North America (US and Canada), Europe (Germany, France, The UK, Spain, Italy, and Rest of Europe), Asia Pacific (China, Japan, South Korea, India, Australia, and Rest of APAC), Latin America (Brazil, Mexico, and Rest of Latin America), Middle East and Africa (GCC, South Africa, and Rest of MEA) |
| Competitive Landscape | Deere & Company (John Deere), CNH Industrial N.V., AGCO Corporation, Kubota Corporation, CLAAS KGaA mbH, Mahindra & Mahindra Limited, Yanmar Co., Ltd, SAME Deutz-Fahr, Iseki & Co, Escorts Kubota Limited, JCB, TAFE, LOVOL, Rostselmash, Argo Tractors |
| Customization Scope | Customization for segments, region / country-level will be provided. Additional customization can be done based on requirements. |
| Purchase Options | We have three licenses to opt for: Single User License | Multi-User License (Up to 5 Users) | Corporate Use License (Unlimited User and Printable PDF) |





































