


Report Overview
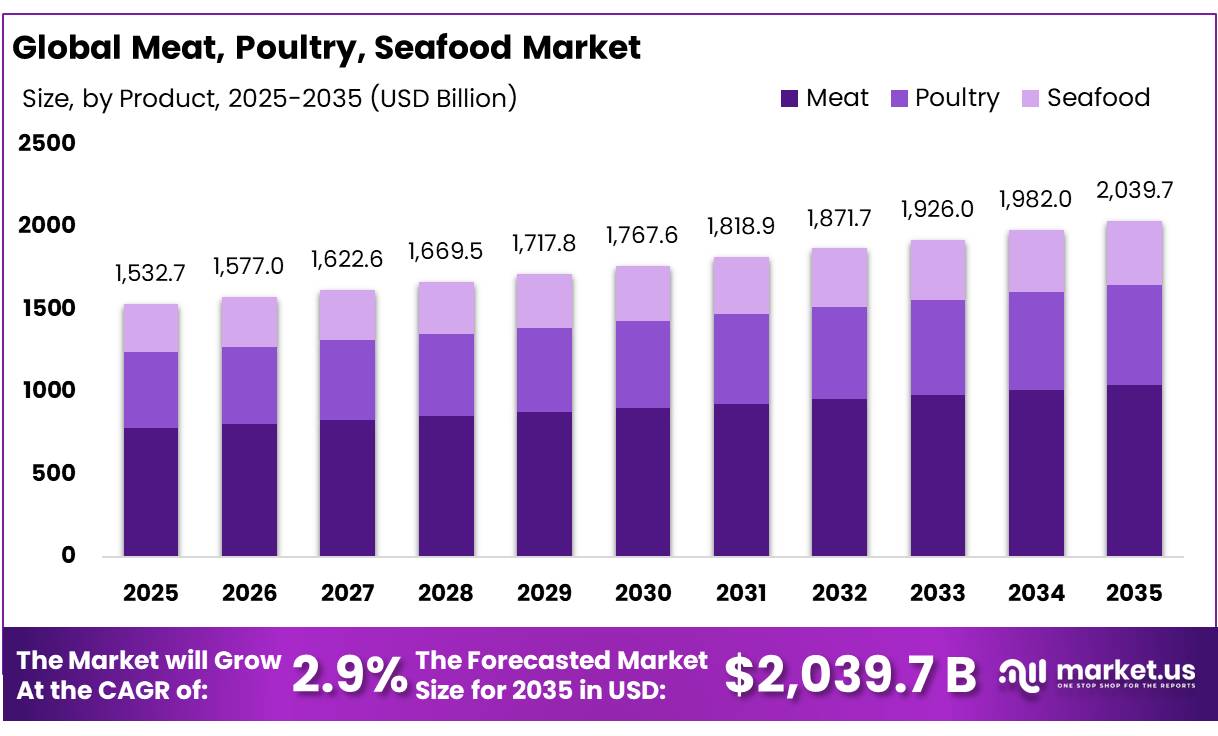
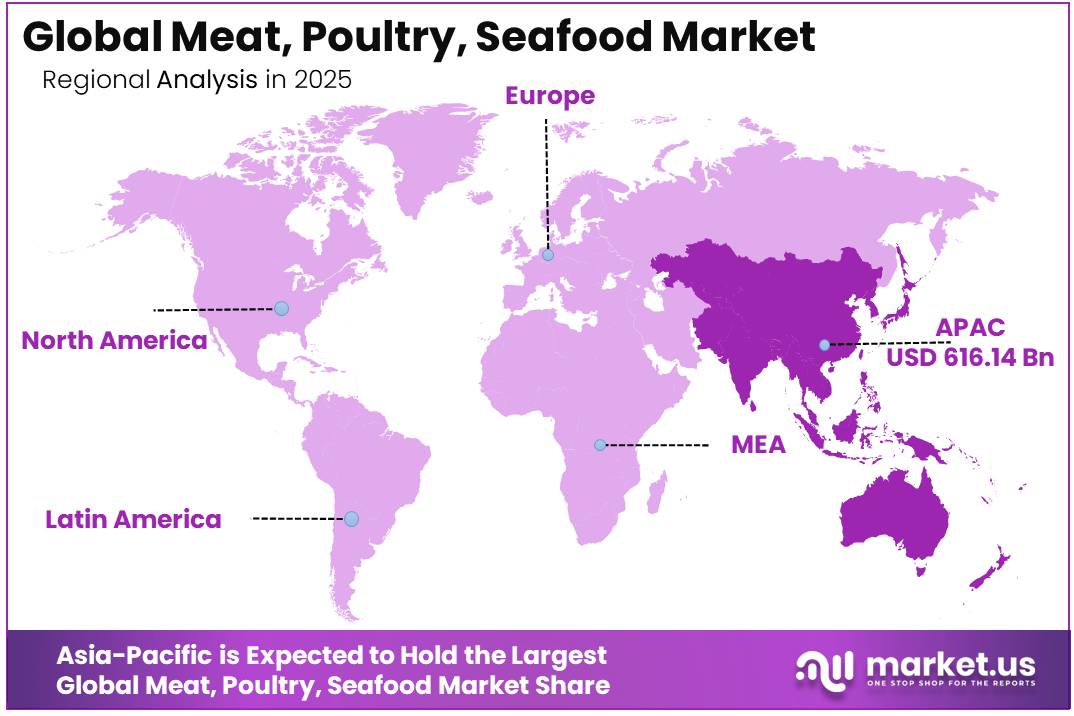
In 2025, the Global Meat, Poultry, Seafood Market was valued at USD 1,532.7 billion, and between 2026 and 2035, this market is estimated to register a CAGR of 2.9%, reaching about USD 2,039.7 billion by 2035. Asia Pacific held a dominant market position, capturing more than a 40.2% share, holding USD 616.14 billion in revenue.
The global meat, poultry, and seafood market remains one of the largest and most resilient segments within the food industry, supported by steady consumer demand for animal protein across both developed and emerging economies. While consumption patterns continue to evolve, protein remains a staple category, driving consistent demand through retail, foodservice, and food processing channels. Market growth is increasingly being supported by investments in production efficiency, modern processing facilities, cold-chain infrastructure, and value-added product development, enabling producers to improve margins while meeting changing consumer expectations.
- In the United States, USDA ERS projected that 226 pounds of red meat and poultry would be available per consumer in 2025, rising to 227 pounds in 2026. Broiler meat remained the most consumed animal protein, with per-capita availability projected at 102.7 pounds in 2025 and 102.8 pounds in 2026. Beef availability was projected at 58.5 pounds in 2025 and 56.9 pounds in 2026, while pork availability was projected at 49.7 pounds in 2025 and 50.9 pounds in 2026.
Key Takeaways
- The global meat, poultry, and seafood market was valued at USD 1,532.7 billion in 2025.
- The market is projected to grow at a CAGR of 2.9% and is estimated to reach USD 2,039.7 billion by 2035.
- On the basis of Product, Meat dominated the market, constituting 51.1% of the total market share.
- Based on the Type, the Conventional type dominated the Meat, Poultry, Seafood Market with a substantial market share of around 94.8%.
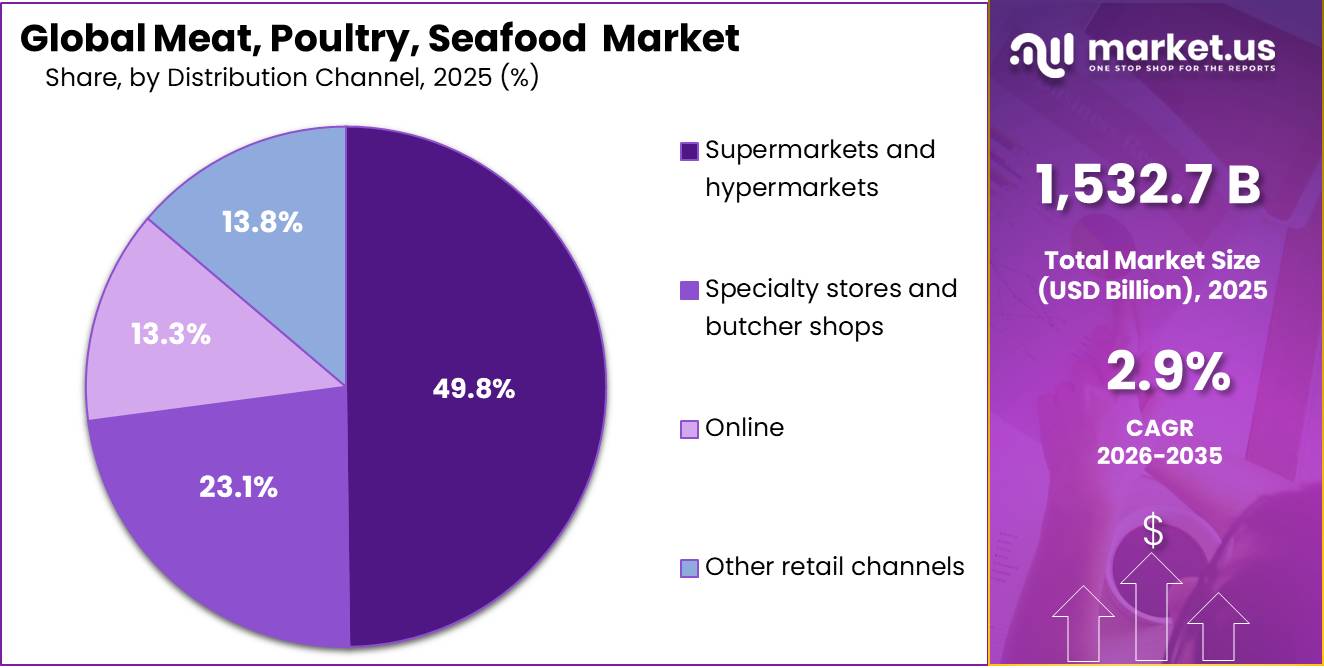
- Based on the Distribution Channel, Supermarkets and hypermarkets led the market, comprising 49.8% of the total market.
- Based on Forms, the fresh products dominated the Meat, Poultry, Seafood Market with a substantial market share of around 57.8%.
- In 2025, the Asia Pacific was the most dominant region in the global meat, poultry, and seafood market, accounting for 40.2% of the total global consumption.
Competition across the industry is intensifying as leading processors focus on strengthening scale, operational efficiency, and product diversification. Companies are investing in higher-value protein categories such as ready-to-cook and ready-to-eat products, which offer stronger profitability and align with growing consumer demand for convenience.
- According to the Food and Agriculture Organization (FAO), the FAO Meat Price Index averaged 131.0 points in June 2026, increasing by 0.5 points (0.4%) from May 2026 and by 5.0 points (4.0%) compared with June 2025, reaching a new record high. FAO stated that the increase was mainly driven by higher international poultry meat prices.
Looking ahead, the market is expected to benefit from rising protein consumption in developing regions, expansion of modern retail formats, and continued growth in convenience-focused food categories. At the same time, producers are increasingly focusing on supply chain resilience, sustainability initiatives, and regional manufacturing investments to strengthen their market positions. As a result, companies that successfully combine scale, efficient operations, and differentiated product portfolios are expected to be best positioned to capture future growth opportunities in the global meat, poultry, and seafood market.
- In the United Kingdom, government poultry data for May 2026 showed that total poultry meat production stood at 177.4 thousand tonnes. UK broiler chick placings reached 97.7 million chicks, up 0.3%.
Product Analysis
Meat Represents the Dominant Product Segment in the Global Meat, Poultry, and Seafood Market.
Meat accounts for 51.1% of the global meat, poultry, and seafood market, making it the largest product segment. Its dominance is driven by widespread consumption across households, foodservice establishments, and food processing industries, supported by established supply chains and extensive product availability. The segment also benefits from higher value realization through premium cuts, processed products, and branded offerings, which contribute significantly to overall market revenue.
- According to the Food and Agriculture Organization (FAO) in its Food Outlook (June 2026), global meat production is forecast to increase by 1.0% year-on-year, reaching approximately 391.3 million tonnes in 2026, reflecting continued growth in livestock production and steady global demand for meat products.
The segment’s leadership is further supported by large-scale vertically integrated operations that enhance production efficiency, supply reliability, and cost competitiveness. Strong demand for processed and convenience-oriented meat products continues to create additional growth opportunities, particularly as retailers and foodservice operators expand their value-added protein offerings. These advantages allow meat producers to maintain a strong position across both mature and developing markets. Industry investments continue to reinforce the segment’s market leadership.
Type Analysis
Conventional Products Maintain Market Leadership Across Production Types.
Conventional products account for 94.8% of the global meat, poultry, and seafood market, reflecting their strong cost competitiveness, production scalability, and widespread availability across retail and foodservice channels. The segment benefits from highly established livestock and aquaculture production systems that enable processors to meet large-volume demand while maintaining operational efficiency and consistent product supply. Its affordability compared to premium alternatives also makes conventional protein the preferred choice across both developed and emerging markets.
- According to the Food and Agriculture Organization (FAO) in its Food Outlook, Biannual Report on Global Food Markets (June 2026), global fisheries and aquaculture production is projected to reach 200.5 million tonnes in 2026, supported by a 2.9% increase in aquaculture output, highlighting the continued strength of conventional seafood production and supply chains.
While organic products are gaining attention among health- and sustainability-focused consumers, their higher production costs, certification requirements, and limited supply continue to restrict large-scale adoption compared with conventional offerings.
Distribution Channel Analysis
Supermarkets and Hypermarkets Account for the Largest Distribution Channel Share in the Market.
Supermarkets and hypermarkets lead the global meat, poultry, and seafood market, accounting for 49.8% of total distribution. Their dominance stems from extensive product assortments, strong cold-chain capabilities, and the ability to offer fresh, frozen, and processed protein products under a single retail platform. High footfall, competitive pricing, and established supplier networks further reinforce their position, making them a preferred channel for both branded and private-label protein.
The continued expansion of organized retail in developing economies strengthens supermarkets and hypermarkets as the backbone of global protein distribution. Simultaneously, specialty stores, butcher shops, and online platforms are gaining traction by targeting premium products, convenience-focused consumers, and direct-to-consumer sales, creating complementary growth channels.
Form Analysis
Fresh Products Represent the Dominant Form Segment in the Market.
Fresh products dominate the global meat, poultry, and seafood market with a 57.8% share, driven by strong consumer preference for minimally processed protein perceived as higher quality, taste, and nutrition. Fresh protein remains central to daily household consumption and foodservice operations, where texture, appearance, and cooking versatility influence purchase decisions. Compared to frozen or processed alternatives, fresh offerings benefit from higher purchase frequency, stronger shelf visibility, and broad acceptance across developed and emerging markets, making them the core revenue driver despite rising demand for convenience-oriented frozen and processed formats.
- FMI’s 2025 Power of Meat report stated that meat in the fresh perimeter recorded USD 105 billion in sales in 2024, reached 98.2% household penetration, and generated around 54 shopping trips per year, indicating that fresh meat remains a regular grocery basket item rather than an occasional purchase.
This dominance is reinforced by investments in cold-chain infrastructure, refrigerated transportation, and temperature-controlled retail, reducing spoilage risks and expanding distribution reach. Producers are increasingly integrating upstream processing facilities near consumption centers to ensure rapid delivery and product integrity. Leading players, such as Marfrig Global Foods S.A., have scaled South American fresh beef operations through automated chilling and carcass-portioning upgrades, driving increase in fresh beef volume. These measures highlight how strategic infrastructure and supply-chain optimization sustain fresh protein’s market leadership while supporting growth in high-frequency, premium consumption segments.
Key Market Segments
By Product Type
- Meat
- Poultry
- Seafood
By Type
- Conventional
- Organic
By Distribution Channel
- Supermarkets and hypermarkets
- Specialty stores and butcher shops
- Online
- Other retail channels
By Form
- Fresh
- Frozen
- Others
Driver Analysis
Poultry substitution gains versus red meat inflation
USDA-linked 2026 food outlook reporting indicates beef and veal prices are expected to rise materially in 2026, while poultry prices are projected to remain relatively flat and pork to increase only modestly, creating a clear relative-price advantage for chicken in household and foodservice menus. In the EU, poultry meat output reached 14.1 million tonnes in 2024, more than double bovine meat volume at 6.6 million tonnes, and the rebound accelerated from 2.3% growth in 2023 to 6.0% in 2024, showing the category already has the industrial base to capture substitution demand.
Drivers Impact Analysis
| Driver | (~) % Impact on CAGR Forecast | Geographic Relevance | Impact Timeline |
|---|---|---|---|
| Protein demand resilience across retail-foodservice channels | +1.1% | North America core, EU urban markets, APAC metro corridors | Short term (≤ 2 years) |
| Poultry substitution gains versus red meat inflation | +0.9% | EU, North America, Middle East import markets, APAC mass retail | Medium term (2-4 years) |
| Tight cattle supply and premium beef price pass-through | +0.7% | U.S., Canada, Latin America export links, East Asia premium demand | Medium term (2-4 years) |
| Seafood trade normalization and compliant import realignment | +0.8% | U.S. import market, Latin America, South Asia, ASEAN seafood corridors | Short term (≤ 2 years) |
| Feed-cost easing and margin recovery in animal protein chains | +0.6% | U.S., EU, Brazil-linked export basins, APAC integrators | Short term (≤ 2 years) |
| Biosecurity and regulatory modernization reshaping supply economics | +0.5% | U.S., EU, global export-certified producers | Long term (≥ 4 years) |
Restraint Analysis
Animal disease and biosecurity disruptions
Animal disease and biosecurity disruptions, including recurrent outbreaks of avian influenza, African swine fever, and localized foot-and-mouth disease, are estimated to shave about 1.9 percentage points off the baseline CAGR by creating cyclical supply shocks that are increasingly frequent and geographically dispersed.
FAO and OECD meat outlook data for 2024–2025 show global meat production growing only about 1.3% year-on-year to around 365 million tonnes, with elevated uncertainty in poultry and pig meat linked explicitly to disease-related culling and movement restrictions, and FAO reporting that market uncertainty tied to disease and geopolitical tensions has already lifted global meat prices in 2025 beyond fundamental cost trends.
From an operational perspective, large integrated producers face biosecurity opex inflation of roughly 5–8% per annum, as they upgrade farm-level hygiene protocols, invest in controlled-atmosphere transport, and expand disease surveillance, while unplanned culling episodes can eliminate 3–7% of regional herd or flock inventories within a quarter, forcing slaughterhouses to run at 70–80% utilization instead of optimal 85–90%, thereby eroding fixed-cost absorption and clipping margins by 100–200 basis points.
Restraint Impact Analysis
| Restraint | (~) % Impact on CAGR Forecast | Geographic Relevance | Impact Timeline |
|---|---|---|---|
| Geopolitical trade and tariff volatility | -2.2% | North America, EU, East Asia, MENA | Medium term (2-4 years) |
| Animal disease and biosecurity disruptions | -1.9% | Global livestock hubs, Latin America, Asia-Pacific | Short to medium term (≤ 4 years) |
| Environmental and climate regulation tightening | -1.7% | EU core, UK, North America, OECD fisheries | Long term (≥ 4 years) |
| High capital intensity and processing cost inflation | -1.5% | North America core, EU, emerging Asia | Medium term (2-4 years) |
| Fisheries stock depletion and quota constraints | -1.4% | EU, North Atlantic, Asia-Pacific coastal | Long term (≥ 4 years) |
| Shifting consumption and sustainability pressures | -1.3% | EU, urban North America, advanced Asia | Long term (≥ 4 years) |
Opportunity Analysis
Digital direct‑to‑consumer protein ecosystems
Government and intergovernmental datasets indicate that per‑capita meat consumption in many OECD markets is plateauing or declining on a volume basis, while total food consumption continues to grow by roughly 1.0–1.2% annually due to population and income, implying a shift toward higher‑value, convenience‑oriented formats rather than pure volume expansion.
On this baseline, D2C ecosystems integrating subscription boxes, algorithmic meal planning, provenance‑verified sourcing and dynamic pricing represent white‑space monetization of existing demand: for example, if 10–15% of urban households in North America, Western Europe and tier‑1 APAC cities migrate 25–30% of their meat and seafood purchases into digital channels with 4–6 percentage‑point higher gross margins and 15–20% lower customer acquisition cost per recurring order, integrated players could realistically add around 2.0 percentage points of CAGR upside above the current trajectory by 2030, primarily through increased basket value and reduced churn.
This is not a current driver because the majority of meat and seafood e‑commerce today is either experimental, limited to niche premium boxes or constrained by cold‑chain reliability, and the required full‑stack orchestration real‑time inventory, dynamic routing, and micro‑fulfilment tailored to perishable proteins remains underdeveloped, leaving substantial uncaptured TAM in urban D2C protein spending conservatively modeled at 8–10% of baseline market value in the next decade.
Opportunity Impact Analysis
| Opportunity | (~) % Potential CAGR Upside | Geographic Relevance | Execution Window |
|---|---|---|---|
| Digital direct-to-consumer protein ecosystems | +2.0% | North America, EU, urban APAC | Short term (≤ 2 years) |
| High-margin value-added and functional meat/seafood | +1.8% | North America, EU, East Asia | Medium term (2-4 years) |
| Climate-linked premium and low-footprint protein portfolios | +1.5% | EU, UK, Canada, Oceania | Medium term (2-4 years) |
| Integrated emerging-market cold chain and last-mile platforms | +2.3% | South & Southeast Asia, Africa, LatAm | Long term (≥ 4 years) |
| Data-driven supply optimization and waste monetization | +1.2% | Global, especially EU and APAC | Short–Medium term (≤ 4 years) |
| Cross-border M&A roll-ups and portfolio rationalization | +1.0% | Global consolidators | Medium–Long term (≥ 3 years) |
Challenges Analysis
Volatile feed cost pass-through
Volatile feed cost pass-through remains a structural friction because livestock producers are navigating highly variable real input prices even as OECD‑FAO projections suggest feed costs ease relative to their 2022–2023 peaks, with broader operating costs staying elevated and slowing meat supply growth. At the operational level, broiler and pork producers are typically exposed to feed cost swings of 8–15% year‑on‑year, while total feed represents 55–70% of farm‑gate production cost, creating a 2–3 percentage point variability band in gross margins and forcing frequent adjustments to stocking densities, slaughter weights, and contract terms.
Quantitatively, this volatility translates into a modeled friction drag of about 1.2 percentage points on achievable CAGR, as producers absorb cost spikes through shorter pricing cycles, increased hedging expenses (raising financial overhead by 0.5–1.0% of revenue), and cautious capacity expansion, which lengthens investment payback periods from an average 6–7 years to 8–9 years in new integrated meat complexes.
Strategically, firms must scale data‑driven feed procurement and risk management, including broader futures hedging, multi‑grain ration optimization, and dynamic feed conversion ratio monitoring (targeting incremental improvements of 2–3% per cycle), while retailers co‑design flexible pricing bands to smooth consumer price shocks, thereby gradually reducing the pass‑through volatility and enabling more stable 3–4% annual output growth despite structurally higher non‑feed operating costs.
Challenges Impact Analysis
| Challenge | (~) % CAGR Friction Drag | Geographic Relevance | Mitigation Horizon |
|---|---|---|---|
| Volatile feed cost pass-through | -1.2% | North America, EU, LATAM, Emerging Asia | Medium term (2-4 years) |
| Chronic cold-chain and logistics gaps | -1.0% | Emerging Asia, Africa, LATAM coastal, India export hubs | Long term (≥ 4 years) |
| Tight animal health and food safety compliance | -0.9% | EU regulatory hubs, North America core, East Asia import nodes | Medium term (2-4 years) |
| Fisheries overexploitation and stock variability | -0.8% | Global capture fisheries, key seafood export corridors | Long term (≥ 4 years) |
| Skilled labor and veterinary talent deficits | -0.7% | EU processing belts, North America plants, Asia urban clusters | Medium term (2-4 years) |
| ESG, welfare, and traceability upgrade burden | -0.6% | EU, UK, North America, high-income APAC | Long term (≥ 4 years) |
Geopolitical Impact Analysis
Geopolitical Drivers and Conflict-Related Impacts on Global Protein Supply Chains.
Geopolitical developments and conflicts between 2024 and 2026, including the Russia Ukraine war, continue to disrupt global protein supply chains and key feed commodity markets. Restrictions and volatility in Black Sea grain exports have increased global prices for corn, wheat, and oilseeds, raising production costs for poultry, pork, and aquaculture industries.
This has strengthened the need for diversified sourcing strategies and more resilient procurement models among integrated protein producers. At the same time, ongoing trade tensions between the United States and China have altered traditional protein trade flows, encouraging exporters to expand regional processing capacity and diversify export destinations to reduce dependency on single corridors.
These geopolitical pressures have also accelerated food security focused policy responses across importing regions, particularly in the Middle East and North Africa. Governments in markets such as Saudi Arabia and Egypt are increasing investments in cold chain infrastructure, local processing capabilities, and import diversification programs to reduce exposure to global supply disruptions.
Regional Analysis
Asia Pacific Held the Largest Share of the Global Meat, Poultry, Seafood Market.
Asia Pacific is the dominant region in the global meat, poultry, and seafood market, accounting for 40.2% of total market revenue. The region’s leadership is driven by its large and growing population, rising disposable incomes, and increasing urbanization, which together support higher per capita protein consumption. Strong demand is further amplified by the rapid expansion of organized retail networks, modern cold-chain infrastructure, and growing foodservice penetration, which enable wider availability of fresh, frozen, and value-added protein products.
Other regions are demonstrating steady expansion but remain smaller in scale relative to Asia Pacific. North America continues to grow through investments in operational efficiency, branded product development, and value-added protein offerings, while Europe is adapting to sustainability and regulatory pressures that influence production and trade competitiveness. The Middle East and Africa represent emerging opportunities driven by import dependence, expanding cold-chain infrastructure, and rising protein consumption. These markets provide strategic avenues for exporters targeting high-growth demand segments beyond established mature markets.
Key Regions and Countries Covered
- North America
- The US
- Canada
- Europe
- Germany
- France
- The UK
- Spain
- Italy
- Russia & CIS
- Rest of Europe
- APAC
- China
- Japan
- South Korea
- India
- ASEAN
- Rest of APAC
- Latin America
- Brazil
- Mexico
- Rest of Latin America
- Middle East & Africa
- GCC
- South Africa
- Rest of MEA
Key Players Analysis
The global meat, poultry, and seafood market is characterized by a concentrated competitive structure led by a small group of large multinational protein processors that hold strong positions in global supply chains through scale, integration, and geographic diversification. JBS S.A., Tyson Foods, and Cargill hold leading positions across key protein categories, supported by extensive processing networks, strong procurement capabilities, and broad participation across fresh, frozen, and value-added segments. Their dominance is reinforced by control over vertically integrated operations spanning livestock sourcing, processing, packaging, and global distribution, enabling cost efficiencies and consistent supply reliability across multiple end markets including retail, foodservice, and industrial channels.
Alongside these global leaders, companies such as WH Group, BRF S.A., Marfrig Global Foods, and Minerva Foods maintain strong competitive positions through export-oriented strategies and regional specialization, particularly across Asia Pacific, North America, and the Middle East. These players continue to strengthen their market presence through capacity expansion, international trade networks, and growing participation in higher-margin processed and branded protein segments. The overall market structure reflects sustained consolidation at the top tier, with competitive advantage increasingly driven by integrated supply chains, value-added product innovation, and access to diversified global demand centers rather than purely commodity-based production scale.
The Major Players in The Industry
- JBS S.A.
- Tyson Foods, Inc.
- Cargill, Incorporated
- WH Group Limited / Smithfield Foods
- BRF S.A
- Marfrig Global Foods S.A.
- Minerva Foods S.A.
- Danish Crown A/S
- Hormel Foods Corporation
- Conagra Brands, Inc.
- NH Foods Ltd.
- Vion Food Group
- Perdue Farms Inc.
- Pilgrim’s Pride Corporation
- Sysco Corporation
- Others
Key Development
- In June 2026, Tyson Foods, Inc. further expanded Chicken Cups with 3 new flavors Garlic & Herb, BBQ, and Harissa and the company employed about 133,000 people as of September 27, 2025.
- In March 2026, JBS S.A. strengthened its Middle East strategy through an US$150 million Oman joint venture with Oman Food Capital, taking an 80% stake in a new food holding company for beef, poultry, and lamb production, with expected capacity of 300,000 tons per year and over 3,000 direct jobs within five years.
Report Scope
| Report Features | Description |
|---|---|
| Market Value (2025) | USD 1,532.7 Bn |
| Forecast Revenue (2035) | USD 2,039.7 Bn |
| CAGR (2026-2035) | 2.9% |
| Base Year for Estimation | 2025 |
| Historic Period | 2020-2024 |
| Forecast Period | 2026-2035 |
| Report Coverage | Revenue Forecast, Market Dynamics, Competitive Landscape, Recent Developments |
| Segments Covered | By Product Type (Meat, Poultry, Seafood), By Type (Conventional, Organic), By Distribution Channel (Supermarkets and hypermarkets, Specialty stores and butcher shops, Online, Other retail channels), By Form (Fresh, Frozen, Others) |
| Regional Analysis | North America – The US & Canada; Europe – Germany, France, The UK, Spain, Italy, Russia & CIS, Rest of Europe; APAC– China, Japan, South Korea, India, ASEAN & Rest of APAC; Latin America– Brazil, Mexico & Rest of Latin America; Middle East & Africa– GCC, South Africa, & Rest of MEA |
| Competitive Landscape | JBS S.A., Tyson Foods, Inc., Cargill, Incorporated, WH Group Limited / Smithfield Foods, BRF S.A, Marfrig Global Foods S.A., Minerva Foods S.A., Danish Crown A/S, Hormel Foods Corporation, Conagra Brands, Inc., NH Foods Ltd., Vion Food Group, Perdue Farms Inc., Pilgrim’s Pride Corporation, Sysco Corporation, and Other Players. |
| Customization Scope | Customization for segments, region/country-level will be provided. Moreover, additional customization can be done based on the requirements. |
| Purchase Options | We have three licenses to opt for: Single User License, Multi-User License (Up to 5 Users), Corporate Use License (Unlimited Users and Printable PDF) |





































