


Report Overview
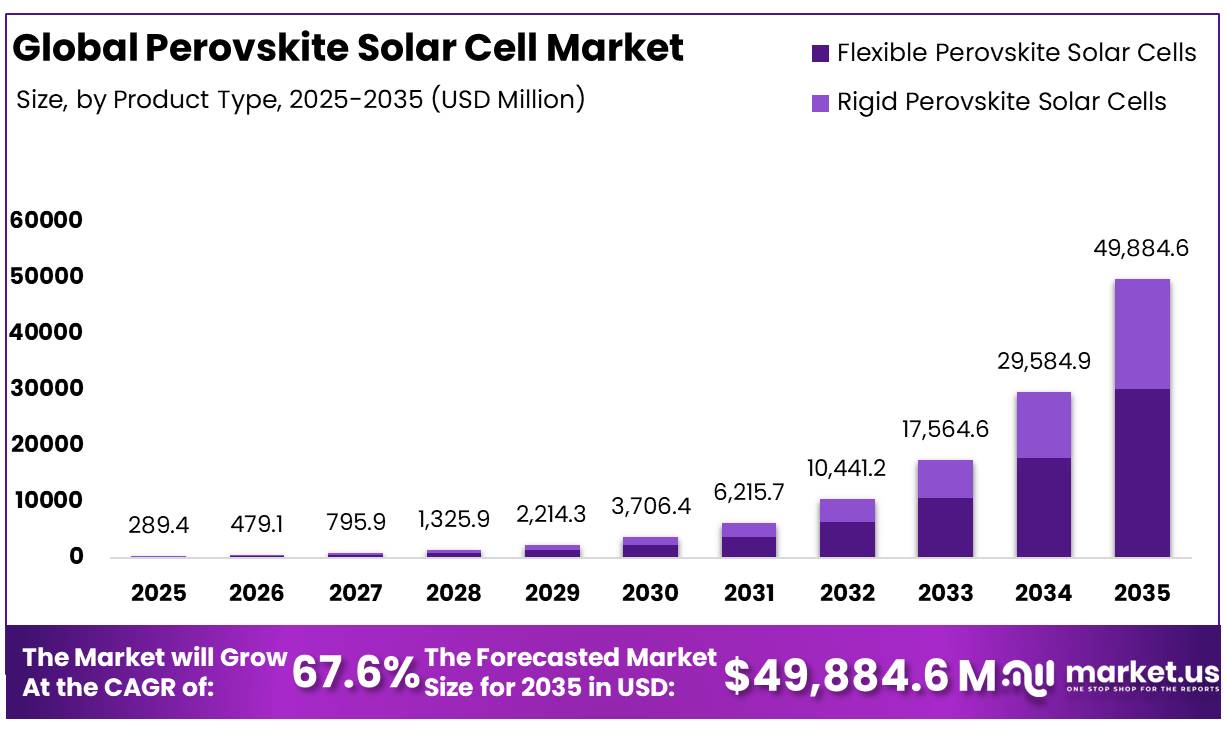
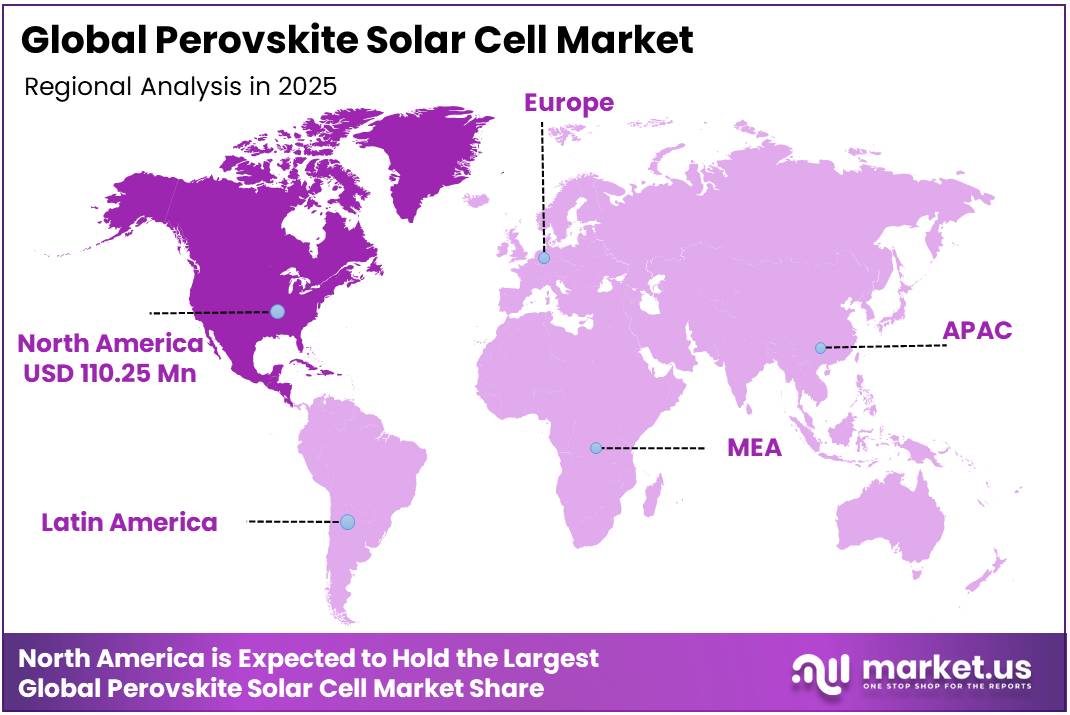
In 2025, the Global Perovskite Solar Cell Market was valued at USD 289.4 million, and between 2026 and 2035, this market is estimated to register a CAGR of 67.6%, reaching about USD 49,884.6 million by 2035. In 2025, North America led the market, achieving over 38.1% share with a revenue of US$110.25 million.
Perovskite solar cells are next-generation photovoltaic devices that use metal-halide perovskites as the main light-absorbing layer. Their industrial value lies in strong light absorption, tunable bandgaps, thin-film processing and compatibility with silicon in tandem structures.
- According to the U.S. Department of Energy, 2026, small-area perovskite-cell efficiency rose from about 3% in 2009 to above 26%, while perovskite-silicon tandem cells approached 34%. This rapid improvement has positioned the technology as a potential route to higher power density, although commercial expansion still depends on better stability, large-area efficiency, repeatable manufacturing, validation and bankability.
Key Takeaways
- The Global Perovskite Solar Cell Market was valued at USD 289.4 million in 2025.
- The market is projected to grow at a CAGR of 67.6% and is estimated to reach US$49,884.6 million by 2035.
- On the basis of structure, Planar Perovskite Solar Cells dominated the market, constituting 62.4% of the total market share.
- Based on the product type, Flexible Perovskite Solar Cells dominated the market, with a substantial market share of around 60.5%.
- Based on the technology, Single-Junction led the market, comprising 58.1% of the total market.
- On the basis of application, Utilities dominated the market, constituting 45.2% of the total market share.
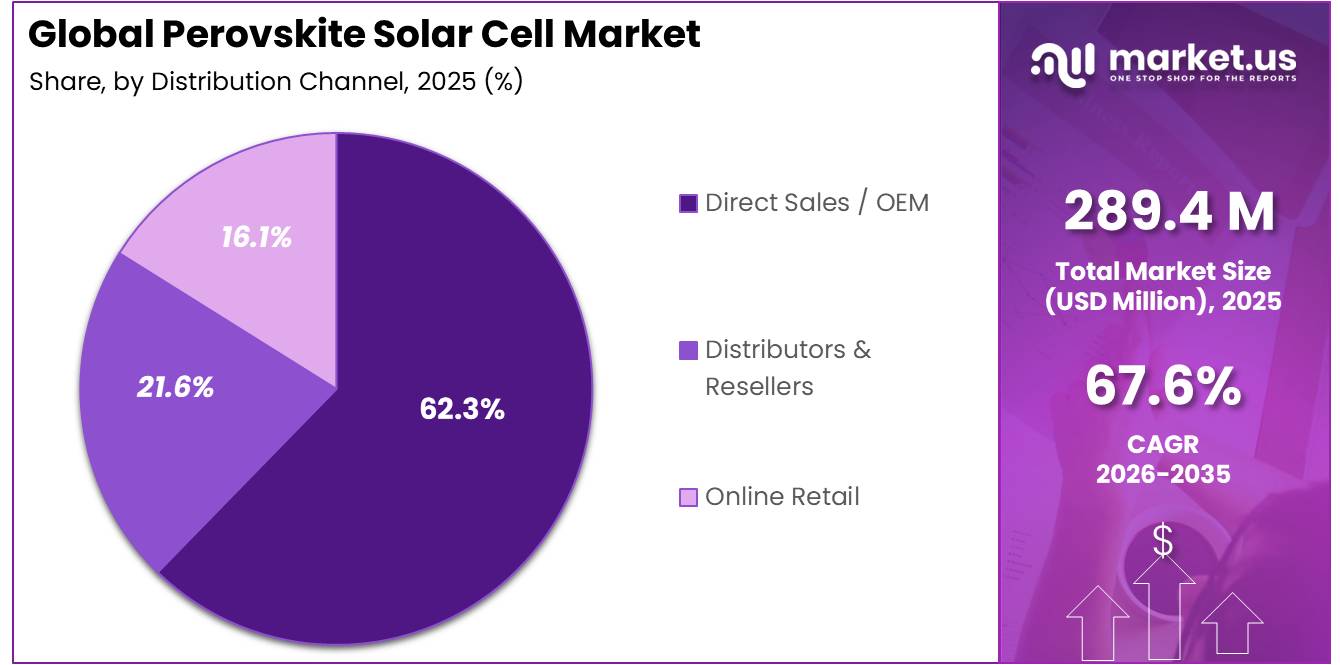
- Based on the distribution channel, Direct Sales / OEM dominated the market, with a substantial market share of around 62.3%.
- In 2025, North America was the most dominant region in the market, accounting for 38.1% of the total global consumption.
The broader solar sector provides a large addressable industrial base. According to the International Energy Agency’s Global Energy Review 2026, global solar PV additions increased by around 12% in 2025 and exceeded 600 GW for the first time, raising cumulative capacity to approximately 2,800 GW. The same IEA 2026 report stated that solar represented more than three-quarters of the record 800 GW of renewable capacity added during the year.
- According to the International Energy Agency’s Renewables 2025 report, almost 4,600 GW of renewable capacity growth is expected between 2025 and 2030, with utility-scale and distributed solar supplying nearly 80% of the expansion. This pipeline supports technologies that generate more electricity from constrained roof, land, façade and infrastructure surfaces.
According to Fraunhofer ISE, May 2026, placing a perovskite cell only 500 nanometers thick over a conventional silicon cell can increase the theoretical efficiency limit from 29.4% to 43.3%. Fraunhofer ISE also reported in 2026 that its new industrial research platform can process formats up to 210 by 210 millimeters, while laboratory devices using its hybrid manufacturing route have exceeded 33% efficiency. According to Oxford PV, September 2024, the company shipped its first tandem panels to a U.S. customer, with available products delivering 24.5% module efficiency and up to 20% more energy than a standard silicon panel.
- According to the U.S. Department of Energy in May 2024, CubicPV was selected for a project focused on scalable and durable four-terminal perovskite-silicon tandem modules. The DOE project page listed a rounded funding amount of $6 million and an awardee cost share of $1.5 million.
Future opportunities are expected in high-efficiency tandem modules, lightweight and flexible products, semi-transparent building façades, floating solar, agrivoltaics, urban installations, vehicles and indoor power generation. European government-supported programs are helping perovskite manufacturers move from laboratory cells toward industrial modules. According to the European Commission’s CORDIS LAPERITIVO project record, 2024, the project is targeting 22% efficiency for 900 cm² opaque perovskite modules and 20% efficiency for semi-transparent modules with more than 95% bifaciality.
The same European Commission source stated that the program plans the design of a 200 MW pilot manufacturing line and is assessing a potential expansion pathway toward 5 GW of European production capacity. These targets highlight opportunities in large-area modules, building-integrated photovoltaics, agrivoltaics and perovskite-silicon tandem systems.
Structure Analysis
Planar Perovskite Solar Cells lead with a 62.3% share, supported by improving efficiency and durability
In 2025, Planar Perovskite Solar Cells held a dominant market position, capturing more than a 62.3% share. In April 2025, the U.S. National Renewable Energy Laboratory reported that an inverted perovskite cell achieved 26.1% initial efficiency. The improved cell maintained 26% efficiency with only about 2% degradation after 2,100 operating hours at 65°C. Another device recorded 25.5% efficiency and about 5% degradation after 1,500 hours at 85°C. NREL also developed a 6 cm² minimodule containing four subcells, which reached 23% efficiency and experienced less than 9% degradation after 2,200 hours at 55°C.
Mesoporous Perovskite Solar Cells is the fastest growing segment. The structure is gaining commercial interest because its porous scaffold supports perovskite material integration and offers strong stability potential in printed cell designs. In 2026, the European Commission-backed PriMe-Ferro project started advancing printed triple mesoscopic perovskite solar cells toward commercial production. The program focuses on reducing charge-carrier recombination and voltage losses through ferroelectric nanocomposites while maintaining easier manufacturing, improved stability and lower production costs.
Product Type Analysis
Flexible Perovskite Solar Cells lead the product landscape with a 60.5% share, supported by lightweight and scalable production.
In 2025, Flexible Perovskite Solar Cells held a dominant market position, capturing more than a 60.5% share. Their leading position was supported by their lightweight structure, bendability, and ability to generate electricity on curved or weight-sensitive surfaces. Solution-based manufacturing allows perovskite layers to be deposited on flexible substrates through scalable methods such as blade coating and slot-die coating. This makes the product suitable for building-integrated solar systems, vehicles, portable electronics, wearable devices, and Internet of Things applications.
- In 2025, the European Commission’s PEARL project reported that flexible perovskite solar cells with a metal top electrode achieved 21.6% power-conversion efficiency during the project’s first 18 months. These results support the segment’s commercial potential because they show measurable progress in both high-performance metal-electrode designs and lower-cost printable carbon structures.
Rigid Perovskite Solar Cells are the fastest-growing segment. Their growth is supported by their suitability for conventional rooftop systems, utility solar installations, and tandem modules that require a stable glass-based structure. Rigid designs provide stronger physical protection for sensitive perovskite layers and make encapsulation, transportation, installation, and standardized performance testing easier.
Technology Analysis
Single-Junction technology leads the market due to simpler manufacturing and wider commercial readiness
In 2025, Single-Junction held a dominant market position in the Perovskite Solar Cell Market. Its leadership was supported by a relatively simple cell structure, lower production complexity, and easier integration with established thin-film manufacturing processes. Manufacturers and research institutions continued to prefer this technology for pilot production because it requires fewer layers and offers better control over material deposition. Its lightweight design, strong light absorption, and suitability for flexible surfaces also supported adoption across building-integrated solar products, portable devices, and other emerging photovoltaic applications.
Multi-Junction / Tandem is the fastest-growing segment in the Perovskite Solar Cell Market. The technology combines different light-absorbing materials to capture a broader portion of the solar spectrum and improve overall energy conversion. Its ability to work with existing silicon cells makes it attractive for manufacturers seeking better performance without completely replacing current production systems. Continued progress in layer stability, material compatibility, and large-area manufacturing is helping tandem cells move closer to commercial use, particularly in high-efficiency rooftop, utility-scale, and space-based solar applications.
Application Analysis
Utilities lead the Perovskite Solar Cell Market with more than a 45.2% share, supported by rising grid-scale solar deployment.
In 2025, Utilities held a dominant market position, capturing more than a 45.2% share. The segment benefited from the growing construction of grid-connected solar plants and the need to generate more electricity from available project land. Perovskite technology offers strong potential for utility projects because it can be combined with silicon in tandem modules to improve power output. Government data released by the U.S. Energy Information Administration in March 2026 showed that utility-scale solar facilities generated 296,000 GWh of electricity during 2025, representing an annual increase of 34%.
Commercial & Industrial is the fastest-growing segment. During 2026, the segment is expected to gain momentum from corporate rooftops, factories, warehouses, hospitals, offices, and retail buildings seeking additional space for on-site clean power generation. Thin-film perovskite cells can be produced using relatively low-temperature processes and may be integrated into building roofs and façades, giving them potential in properties where conventional panels are difficult to install. The U.S. Department of Energy identifies corporate offices, retail buildings, educational facilities, hospitals, public buildings, and light industrial sites as promising areas for building-integrated photovoltaic deployment.
Distribution Channel Analysis
Direct Sales / OEM dominates with a 62.3% share as manufacturers control early commercial supply
In 2025, Direct Sales / OEM held a dominant market position, capturing more than a 62.3% share. Perovskite solar technology remained in an early commercialization stage, making direct engagement between manufacturers, solar-module producers, project developers, and equipment suppliers important. This channel allows buyers to discuss module design, production volume, performance testing, system integration, warranties, and technical support directly with the producer.
- In January 2025, a U.S. Department of Energy national laboratory study modelled direct OEM manufacturing of perovskite-silicon tandem modules at 3 GW of annual production capacity and 25% module efficiency. At this scale, the estimated sustainable manufacturing price was $0.428 per watt for two-terminal modules, highlighting the large production volumes and close buyer–manufacturer coordination supporting the Direct Sales / OEM channel.
Distributors & Resellers is the fastest growing segment in the perovskite solar cell market. During 2026, this channel is expected to gain importance as manufacturers progress from pilot production toward standardized and commercially deployable modules. Distributors can help producers reach regional installers, building-integrated photovoltaic companies, electronics manufacturers, research institutions, and smaller commercial buyers that may not purchase directly from an OEM. They can also provide local inventory management, customer support, product demonstrations, and connections with system integrators.
Key Market Segments
By Structure
- Planar Perovskite Solar Cells
- Mesoporous Perovskite Solar Cells
By Product Type
- Flexible Perovskite Solar Cells
- Rigid Perovskite Solar Cells
By Technology
- Single-Junction
- Multi-Junction / Tandem
- Bifacial
By Application
- Utilities
- Commercial & Industrial
- Residential
- Others
By Distribution Channel
- Direct Sales / OEM
- Distributors & Resellers
- Online Retail
Driver Analysis
Tandem efficiency step-up
The strongest 2026 growth driver is the efficiency premium of perovskite-based tandem architectures, because U.S. Department of Energy material states that perovskite-silicon tandem cells have reached almost 34% efficiency while single-junction perovskite cells moved from roughly 3% in 2009 to above 26% on small-area devices, dramatically compressing the historical innovation cycle relative to incumbent PV technologies.
The incremental CAGR effect is estimated at about +3.2 percentage points because efficiency is the clearest trigger for customer adoption, partner licensing, and project finance discussions, especially as DOE-backed projects are already targeting manufacturable tandem modules and one selected U.S. project explicitly targets 27% efficient tandem modules, narrowing the gap between lab credibility and commercial product roadmaps.
Driver Impact Analysis
| Driver | (~) % Impact on CAGR Forecast | Geographic Relevance | Impact Timeline |
|---|---|---|---|
| Tandem efficiency step-up | +3.2 pp | North America core, EU, APAC advanced PV corridors | Short term (≤ 2 years) |
| Public manufacturing de-risking | +2.7 pp | U.S. core, EU strategic programs, APAC spill-over | Short term (≤ 2 years) |
| Durability validation progress | +2.3 pp | North America core, EU, Japan, Korea | Medium term (2-4 years) |
| Low-temperature process economics | +1.9 pp | APAC manufacturing corridors, U.S. pilot lines, EU niche production | Medium term (2-4 years) |
| Energy security and domestic supply policy | +1.6 pp | U.S. core, EU, India spill-over | Medium term (2-4 years) |
| Commercialization-focused EU innovation pipeline | +1.4 pp | EU core, associated European supply chain markets | Long term (≥ 4 years) |
Restraint Analysis
Stability degradation
Stability remains the most technically destructive restraint because DOE states that cell lifetime improvement is still a central commercialization objective and that stability and durability must be solved simultaneously with efficiency and manufacturability before perovskites become commercially competitive, despite small-area efficiencies above 26% and tandem efficiencies near 34%.
For market forecasting, that translates into accelerated performance-risk assumptions such as annual degradation bands that can still sit 2 to 4 times above the roughly bankable expectations for incumbent PV in harsh climates, plus encapsulation, barrier-film, and reliability-testing overheads that can add 5% to 12% to module manufacturing cost and extend qualification lead times by 6 to 18 months; these factors are most punitive in hot-humid and high-UV corridors such as India, Southeast Asia, and MENA, where premature output loss would erode PPA economics, reduce warranty confidence, and justify a 2.8-point drag on CAGR through the main 2026-2030 commercialization window.
Restraint Impact Analysis
| Restraint | (~) % Impact on CAGR Forecast | Geographic Relevance | Impact Timeline |
|---|---|---|---|
| Bankability gap | -3.2% | North America core, EU, Japan, Korea | Short term (≤ 2 years) |
| Stability degradation | -2.8% | Global utility markets, MENA, India, SE Asia | Medium term (2-4 years) |
| Lead and EoL compliance | -1.9% | EU, UK, North America core | Medium term (2-4 years) |
| Upstream import dependence | -2.4% | US, EU, India, APAC ex-China | Short term (≤ 2 years) |
| Scale-up yield losses | -2.1% | US pilot lines, EU scale-up hubs, Korea, Japan | Medium term (2-4 years) |
| Policy qualification delays | -1.6% | US federal projects, EU public procurement | Short term (≤ 2 years) |
Opportunity Analysis
Automated 100 MW roll-ups
Automated 100 MW roll-up platforms represent an opportunity because most perovskite activity remains fragmented across pilot lines, research programs, and single-technology ventures, leaving room for a consolidation strategy that aggregates equipment IP, pilot manufacturing, and regional project access into scalable commercial entities.
DOE-backed manufacturing work has pointed to coating speeds of 100 feet per minute with potential output sufficient for 4 GW of electricity generation per year, while the IEA’s energy innovation tracker identifies a 100 MW fully automated perovskite solar cell production line as a commercialization milestone; taken together, these signals support a roll-up thesis in which investors assemble deposition-tool vendors, encapsulation specialists, and pilot-module developers into integrated platforms that can lower capex per effective watt by 15% to 25%, improve yield learning curves by 20% to 30%, and accelerate revenue realization by standardizing bankability testing across acquired assets.
Opportunity Impact Analysis
| Opportunity | (~) % Potential CAGR Upside | Geograp hic Relevance | Execution Window |
|---|---|---|---|
| BIPV facades & glass | +2.4% | EU, Japan, South Korea, North America core | Medium term (2-4 years) |
| Tandem retrofit licensing | +2.1% | China, EU, U.S., India | Short term (≤ 2 years) |
| Indoor IoT micro-power | +1.7% | EU, U.S., Japan, APAC advanced | Short term (≤ 2 years) |
| Space-grade ultralight PV | +1.3% | U.S., EU selective | Long term (≥ 4 years) |
| Encapsulation/IP materials stack | +1.9% | U.S., EU, APAC manufacturing hubs | Short term (≤ 2 years) |
| Automated 100 MW roll-ups | +2.8% | EU, U.S., India, Southeast Asia | Medium term (2-4 years) |
Challenges Analysis
Long‑term field stability gap
The perovskite solar cell market in 2026 remains structurally constrained by the gap between lab‑scale accelerated tests and the 20–30‑year operational lifetimes targeted by public agencies for bankable PV assets, with most perovskite devices still demonstrating extrapolated lifetimes in the 5–12‑year range under simulated outdoor stress profiles combining light, heat, and voltage cycles.
Government programs such as the U.S. DOE Solar Energy Technologies Office (SETO) explicitly call out moisture, oxygen, thermal and UV‑induced decomposition as concurrent failure modes, leading to degradation rates that can exceed 2–4% of initial output per year in early outdoor prototypes versus <0.8% typical for mature silicon modules, and to significant performance hysteresis where short‑term power output can vary by 5–10% based on recent irradiance and bias history rather than instantaneous conditions.
This reliability gap forces developers in Europe and North America to cap perovskite exposure in portfolios, treat installations as higher‑risk demonstration assets, and apply risk‑adjusted discount rates that are 150–300 basis points higher than for Tier‑1 silicon, effectively shaving around 2.0 percentage points from potential CAGR that could be realized if perovskite modules matched incumbent stability metrics.
Challenges Impact Analysis
| Challenge | (~) % CAGR Friction Drag | Geographic Relevance | Mitigation Horizon |
|---|---|---|---|
| Long-term field stability gap | -2.0% | EU, North America, East Asia | Long term (≥ 4 years) |
| Scale-up manufacturing yield loss | -1.6% | China core, US pilot lines, EU demo fabs | Medium term (2-4 years) |
| Bankability and data standardization | -1.2% | Global utility & C&I finance hubs | Medium term (2-4 years) |
| Critical materials and supply concentration | -1.0% | APAC manufacturing belts, EU import-dependent | Long term (≥ 4 years) |
| Talent and test infrastructure deficit | -0.9% | Emerging PV clusters, India R&D hubs | Medium term (2-4 years) |
| Tandem integration and BOS complexity | -0.8% | EU rooftop, US utility-scale, India pilots | Long term (≥ 4 years) |
Geopolitical Impact Analysis
Impact of Ongoing Wars on the Perovskite Solar Cell Market
The ongoing Russia-Ukraine war and conflict in the Middle East are creating a mixed outlook for the perovskite solar cell market. Attacks on energy infrastructure, restricted shipping near the Red Sea and Strait of Hormuz, and longer routes are raising fuel, insurance, freight, and delivery costs for chemicals, coated glass, electrodes, tools, and production equipment. These pressures can delay pilot lines and make commercial modules more expensive, especially for developers that depend on international suppliers.
The effect is stronger because solar manufacturing remains highly concentrated in Asia, while perovskite technology is still moving from laboratory efficiency records toward stable, scalable manufacturing. Companies may therefore postpone expansion, carry larger inventories, or choose regional suppliers to reduce exposure. Research partnerships can also slow when equipment, samples, or specialists cannot move easily across borders.
Regional Analysis
North America Leads the Perovskite Solar Cell Market
In 2025, North America held the dominant position in the Perovskite Solar Cell Market, capturing 38.1% of global revenue, valued at USD 110.25 million. The region benefits from strong laboratory research, public funding, pilot manufacturing, and demand for higher-efficiency solar modules.
- The United States ended 2025 with about 209.3 GW of total solar photovoltaic capacity, creating a large future testing and commercialization base for advanced tandem products. Federal support also strengthens development, as the U.S. Department of Energy awarded USD 44 million to thin-film photovoltaic projects, including perovskite tandem technologies aimed at improving durability, scale, efficiency, and domestic manufacturing readiness.
Asia Pacific is the fastest-growing regional segment, supported by large solar markets, expanding manufacturing capacity, and government-backed commercialization programs. China commissioned nearly 370 GW of solar photovoltaic capacity in 2025, providing a broad industrial ecosystem for materials, equipment, modules, and next-generation cell production.
Japan is also building a focused perovskite supply chain, targeting approximately 20 GW of cumulative deployment by 2040 and a gigawatt-scale production system by 2030. Its strategy is supported by domestic iodine availability, with Japan holding about 30% of global production, which may improve material security and encourage investment in lightweight, flexible perovskite modules for urban installations.
Key Regions and Countries Covered
- North America
- The US
- Canada
- Europe
- Germany
- France
- The UK
- Spain
- Italy
- Russia & CIS
- Rest of Europe
- APAC
- China
- Japan
- South Korea
- India
- ASEAN
- Rest of APAC
- Latin America
- Brazil
- Mexico
- Rest of Latin America
- Middle East & Africa
- GCC
- South Africa
- Rest of MEA
Key Players Analysis
Swift Solar is advancing perovskite-silicon tandem modules for utility-scale, commercial, defence, and space applications. In November 2025, it partnered with Eni Plenitude to evaluate tandem modules targeting conversion efficiencies of 28% or higher, with the potential to generate approximately 40% more power from the same installation footprint than conventional silicon modules.
Energy Materials Corporation focuses on high-speed, roll-to-roll production of flexible perovskite photovoltaic modules. Its GigaSpeed platform prints all seven functional solar-cell layers at production speeds exceeding 30 metres (100 feet) per minute. The company positions this process as a pathway toward terawatt-scale manufacturing to support future global solar deployment.
Power Roll develops lightweight perovskite solar film using its patented Microgroove architecture for roofs and other surfaces unsuitable for conventional panels. The company holds 23 patent families covering more than 100 individual patent rights. A £4.3 million funding round included £1.5 million from the Northern Powerhouse Investment Fund II. Power Roll is targeting an initial manufacturing capacity of 100 MW, with a roadmap to scale production to 1 GW.
Sekisui Chemical is commercializing lightweight, flexible film-type perovskite solar cells through its sealing, coating, materials, and roll-to-roll manufacturing capabilities. The company demonstrated 15.0% conversion efficiency using a 30-cm-wide roll-to-roll manufacturing process and reported accelerated durability equivalent to approximately 10 years of outdoor operation. It is constructing a 100 MW production line and targets expansion to approximately 1 GW by 2030.
The Major Players in the Industry
- Oxford PV
- Hanwha Qcells
- Microquanta Semiconductor
- Saule Technologies
- Swift Solar
- CubicPV
- Energy Materials Corporation
- EneCoat Technologies
- GCL Perovskite
- Power Roll
- Greatcell Energy
- Solaronix SA
- Panasonic Corporation
- Sekisui Chemical Co., Ltd.
- Tandem PV
- Other Key Players
Key Development
- In April 2025, Oxford PV signed an exclusive patent licensing agreement with Trinasolar covering the manufacture and sale of perovskite photovoltaic products in China, including sublicensing rights. The agreement provided access to a Chinese solar market valued at more than $50 billion annually, which is expected to reach $100 billion by 2030.
- In January 2025, Microquanta Semiconductor its 810 cm² perovskite module received certification for 21.86% conversion efficiency, supporting the company’s move toward larger commercial products.
Report Scope
| Report Features | Description |
|---|---|
| Market Value (2025) | USD 289.4 Mn |
| Forecast Revenue (2035) | USD 49,884.6 Mn |
| CAGR (2026-2035) | 67.6% |
| Base Year for Estimation | 2025 |
| Historic Period | 2020-2024 |
| Forecast Period | 2026-2035 |
| Report Coverage | Revenue Forecast, Market Dynamics, Competitive Landscape, Recent Developments |
| Segments Covered | By structure (Planar Perovskite Solar Cells, Mesoporous Perovskite Solar Cells), By product type (Flexible Perovskite Solar Cells, Rigid Perovskite Solar Cells), By technology (Single-Junction, Multi-Junction / Tandem, Bifacial), By application (Utilities, Commercial and Industrial, Residential, Others), and By distribution channel (Direct Sales / OEM, Distributors and Resellers, Online Retail) |
| Regional Analysis | North America – The US & Canada; Europe – Germany, France, The UK, Spain, Italy, Russia & CIS, Rest of Europe; APAC– China, Japan, South Korea, India, ASEAN & Rest of APAC; Latin America– Brazil, Mexico & Rest of Latin America; Middle East & Africa– GCC, South Africa, & Rest of MEA |
| Competitive Landscape | Oxford PV, Hanwha Qcells, Microquanta Semiconductor, Saule Technologies, Swift Solar, CubicPV, Energy Materials Corporation, EneCoat Technologies, GCL Perovskite, Power Roll, Greatcell Energy, Solaronix SA, Panasonic Corporation, Sekisui Chemical Co., Ltd., Tandem PV, Other Key Players |
| Customization Scope | Customization for segments, region/country-level will be provided. Moreover, additional customization can be done based on the requirements. |
| Purchase Options | We have three licenses to opt for: Single User License, Multi-User License (Up to 5 Users), Corporate Use License (Unlimited Users and Printable PDF) |





































