


Report Overview
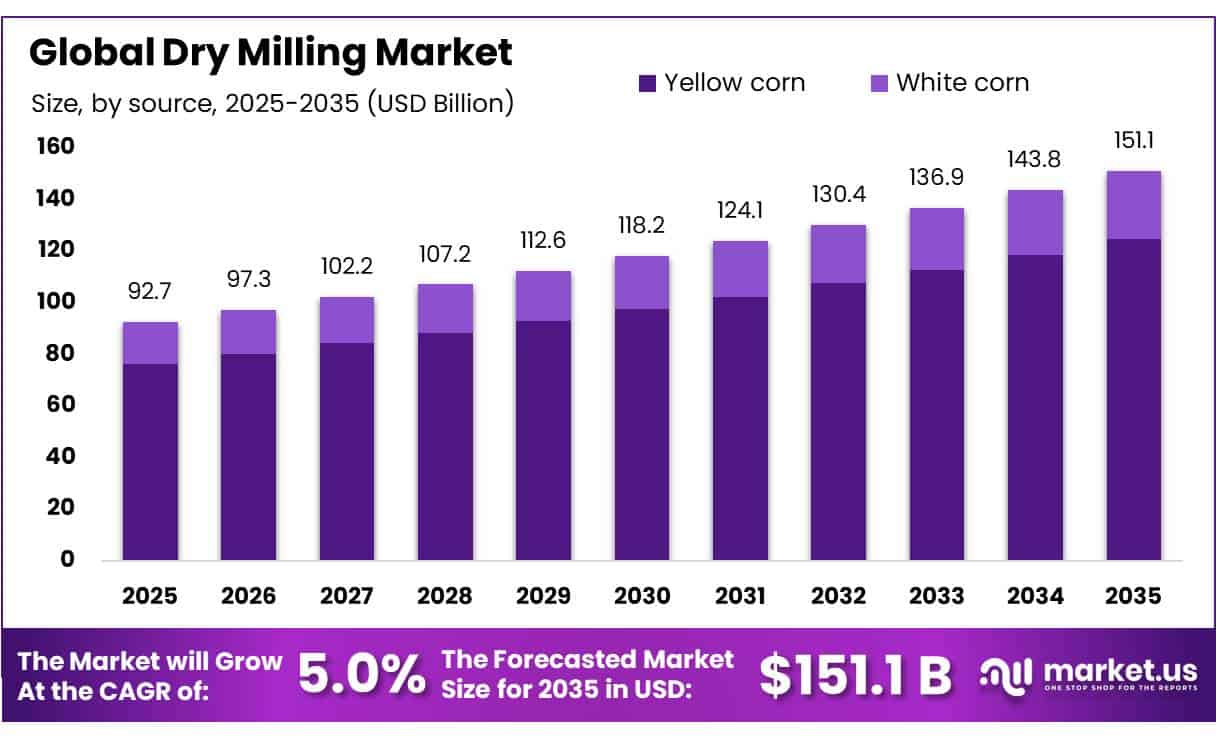
The Global Dry Milling Market size is expected to be worth around USD 151.1 Billion by 2035, from USD 92.7 Billion in 2025, growing at a CAGR of 5.0% during the forecast period from 2026 to 2035. In 2025, North America held a dominant market position, capturing more than a 40.00% share, holding USD 0.80 Billion revenue.
Dry milling is a major grain-processing route that mechanically converts corn, wheat, rye, and other cereals into flour, meal, grits, flakes, and fermentation feedstock without the extensive liquid separation used in wet milling. In the United States, USDA states that corn accounts for more than 95% of total feed-grain production and use, while food, seed, and industrial applications represent close to 60% of domestic corn use. Dry millers supply cereal flakes, corn flour, corn grits, corn meal, and brewers’ grits, linking the industry with packaged foods, brewing, animal nutrition, and biofuels.
- FAO estimated worldwide cereal production at 3.043 billion tonnes in 2025, increasing 6.1% from 2024, while cereal utilization reached 2.952 billion tonnes and global cereal trade was estimated at 508.6 million tonnes. In the United States, USDA projected corn production of 16.013 billion bushels for 2026/27 and food, seed, and industrial consumption of 6.955 billion bushels, including 5.600 billion bushels for ethanol and by-products.
Fuel ethanol remains one of the strongest industrial drivers for dry milling. USDA reported that 520 million bushels of corn were consumed for alcohol and other uses in June 2026, including about 467 million bushels for fuel alcohol. Dry mills represented 92.6% of corn used for fuel production, showing their central position in the ethanol supply chain. U.S. fuel-ethanol operable production capacity reached 18.374 billion gallons per year in May 2026, according to the Energy Information Administration.
Coproduct economics further strengthen the industry’s operating model. USDA recorded 1.82 million tons of distillers dried grains with solubles, 381,034 tons of distillers dried grains, and 212,805 tons of corn distillers oil from dry mills in June 2026. These coproducts give processors additional revenue while supplying protein– and energy-rich materials to animal-feed industries. U.S. flour mills also produced 103.464 million hundredweight of wheat flour and 1.593 million tons of millfeed during the second quarter of 2026, showing continued demand for dry-milled food and feed ingredients.
Key Takeaways
- Dry Milling Market size is expected to be worth around USD 151.1 Billion by 2035, from USD 92.7 Billion in 2025, growing at a CAGR of 5.0%.
- Yellow corn held a dominant market position, capturing more than a 82.00% share.
- Ethanol held a dominant market position, capturing more than a 52.00% share.
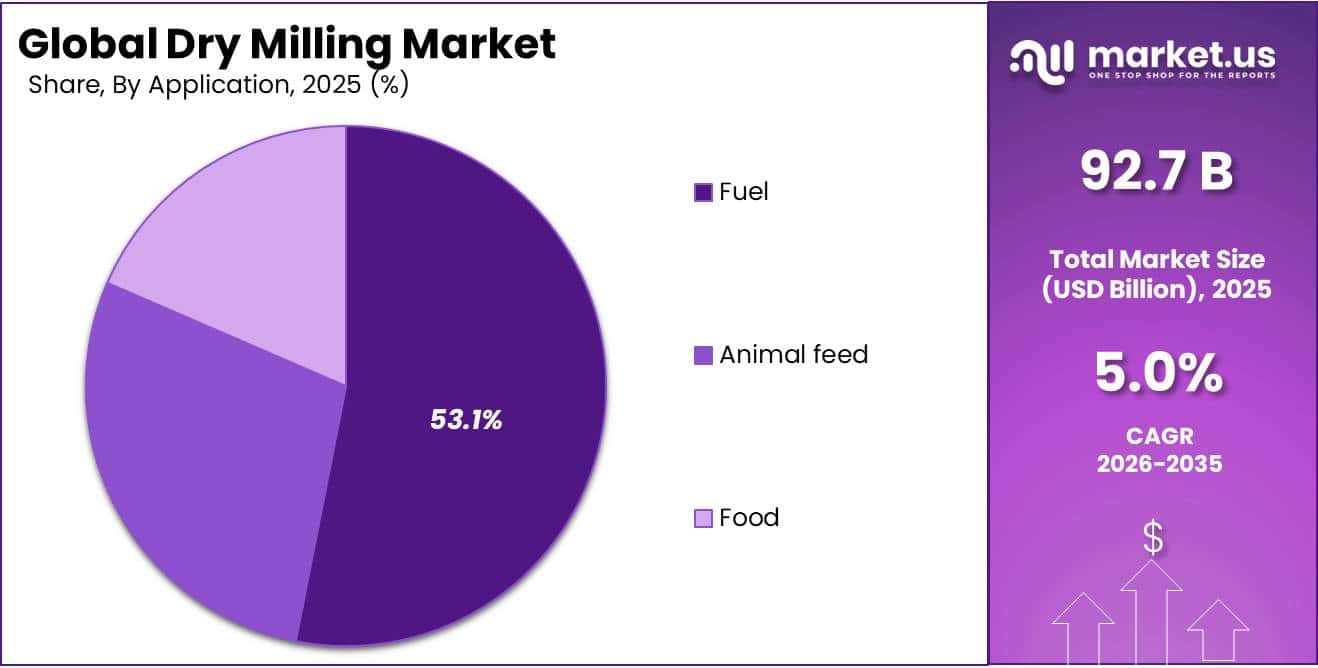
- Fuel held a dominant market position, capturing more than a 53.00% share.
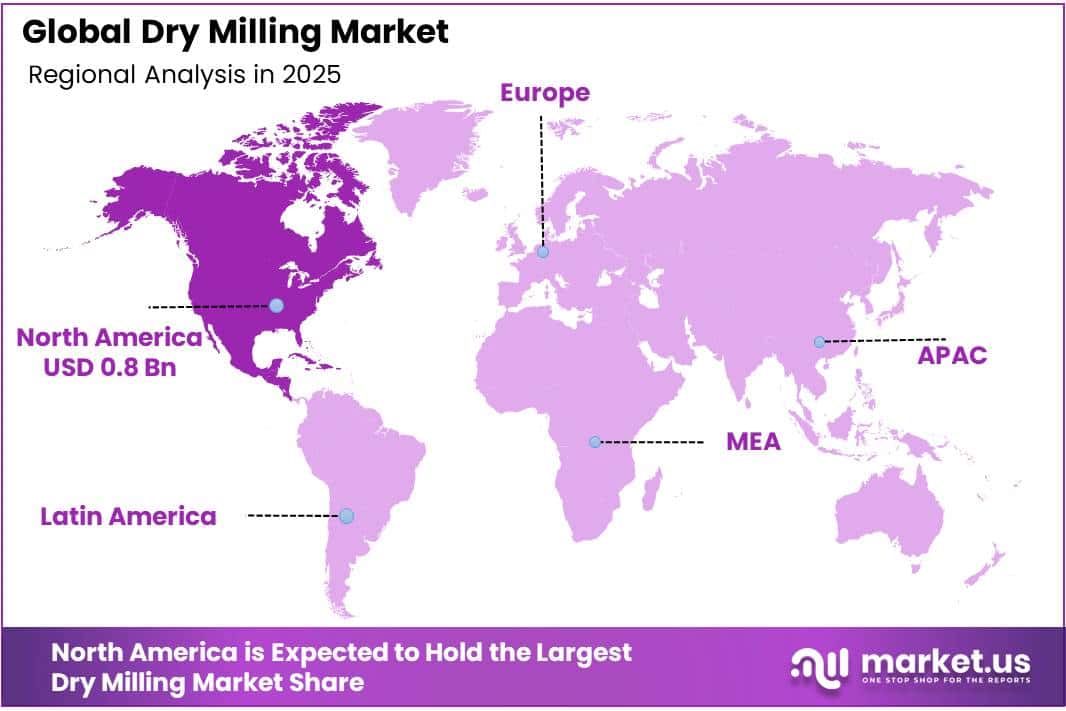
- North America maintained a dominant position in the Dry Milling Market in 2025, capturing more than a 40.00% share and generating about USD 0.80 billion.
By Source Analysis
Yellow Corn dominates the Dry Milling Market with an 82.00% share
In 2025, “Yellow corn” held a dominant market position, capturing more than a 82.00% share. Yellow corn remains the preferred raw material for large-scale dry milling because it offers consistent starch content, good processing efficiency, and broad use across animal feed, corn meal, grits, flour, ethanol, and other industrial products.
- Government data also show the strength of its downstream demand. For the 2025/26 cycle, Mexico’s Ministry of Agriculture reported that yellow corn used by the livestock sector reached 22.5 million tonnes, representing 81.5% of total yellow-corn demand.
White corn continues to hold an important position in the Dry Milling Market because it is mainly processed into food-grade products such as corn flour, meal, masa, tortillas, and other cereal-based foods. Its demand is therefore more closely linked with human food consumption than with large-volume feed applications. In 2026, Mexico’s Ministry of Agriculture estimated white-corn production at 20.6 million tonnes for the 2025/26 cycle, compared with domestic consumption of 19.3 million tonnes.
lThis placed domestic production at 107.2% of national consumption requirements, showing a strong supply base for food processors and dry millers. Separately, official government data reported that white-corn production reached 3.7 million tonnes in May 2026, representing an increase of 38.4% from the same month in 2025. The higher production availability supports continued use of white corn in specialized food milling where grain color, texture, and product quality are important purchasing factors.
By End Product Analysis
Ethanol dominates the Dry Milling Market with a 52.00% share
In 2025, “Ethanol” held a dominant market position, capturing more than a 52.00% share. Ethanol remains the leading end product of dry milling because corn-based fuel plants process large volumes of grain and also generate valuable co-products for animal feed and other industries.
In June 2026, the U.S. Department of Agriculture reported that 467 million bushels of corn were consumed for fuel alcohol, while dry mills accounted for 92.6% of corn used for fuel production. Dry mills also produced 1.82 million tons of distillers dried grains with solubles during the month, showing how ethanol production creates an additional revenue stream from milling residues. These strong operating volumes continue to support ethanol’s leading role in the dry milling industry.
Corn Flour remains an important end-product segment of the Dry Milling Market because it is widely used in bakery foods, snacks, cereals, coatings, tortillas, and other processed food applications. The U.S. Department of Agriculture specifically identifies corn flour as one of the products made by dry corn millers, along with corn meal, corn grits, cereal flakes, and brewers’ grits.
In its August 2026 outlook, USDA projected U.S. corn production at 16.013 billion bushels for 2026/27, providing a large raw-material base for food and industrial processors. Food, seed, and industrial corn use was projected at 6.955 billion bushels, compared with 6.905 billion bushels estimated for 2025/26. This substantial processing base supports stable availability of corn for flour manufacturing and strengthens the role of corn flour across food-grade dry-milling applications.
By Application Analysis
Fuel dominates the Dry Milling Market with a 53.00% share
In 2025, “Fuel” held a dominant market position, capturing more than a 53.00% share. Fuel remains the leading application of dry milling because dry-milled corn is widely used as the main feedstock for ethanol production.
In June 2026, the U.S. Department of Agriculture reported that 467 million bushels of corn were consumed for fuel alcohol, which was 4% higher than in June 2025. Dry mills accounted for 92.6% of the corn used for fuel alcohol production during the month, showing how strongly ethanol manufacturing depends on the dry-milling process.
The U.S. Environmental Protection Agency also set the 2025 total renewable-fuel requirement at 22.33 billion ethanol-equivalent gallons, supporting continued use of corn-based renewable fuels. These conditions continue to strengthen the Fuel segment through stable ethanol demand and high processing volumes.
Food continues to represent an important application of the Dry Milling Market because the process converts corn directly into cereal flakes, corn flour, corn grits, corn meal, and brewers’ grits. Raw-material availability also remained strong in 2025, when U.S. corn-for-grain production reached a record 17.0 billion bushels, increasing 14% from the previous year.
Average corn yield reached 186.5 bushels per acre, while harvested area totaled 91.3 million acres. This large corn supply provides food processors with a reliable base for producing flour, meal, grits, breakfast cereals, snacks, and other corn-based foods, supporting the Food segment’s established role within dry milling.
Key Market Segments
By Source
- Yellow corn
- White corn
By End Product
- Ethanol
- DDGS
- Corn Flour
- Cornmeal and Corn Grits
By Application
- Food
- Animal feed
- Fuel
Driver Analysis
Nationwide E15/E10 Fuel-Blending Waivers Expanding Ethanol Offtake
On March 25, 2026, the EPA issued its first-ever nationwide emergency fuel waiver permitting E15 (15% ethanol blend) sales year-round across all 50 states at a common 10 psi Reid Vapor Pressure standard, effective May 1-20, 2026, with the agency signaling intent to renew consecutive 20-day waivers to sustain the policy through the summer driving season. This directly expands the addressable throughput for the roughly 91-92% of US corn-based ethanol that runs through dry-mill facilities, as confirmed by USDA grain-crushing data showing dry mills processing between 91.5% and 92.7% of total grain used for fuel ethanol from mid-2025 through mid-2026.
Structurally, this shifts dry-mill economics from a volume-capped model — where plants historically throttled output around the 10% “blend wall” toward a demand-elastic model in which incremental capacity utilization and second-shift running hours become the primary margin lever, rather than new capital expansion.
Growth Energy projects an additional 1,200 E15 retail locations coming online in 2026 alone, on top of roughly 5,000 existing sites, while a parallel legislative push seeks to make the waiver permanent, which would remove the annual regulatory-renewal risk that currently forces ethanol producers to hedge forward contracts conservatively.
Opponents estimate that permanent year-round E15 could drive a roughly 50% expansion in ethanol demand, which — even discounted for advocacy bias — signals a material upside skew to dry-mill utilization rates and corn-draw volumes through 2027-2028.
Drivers Impact Analysis
| Driver | (~) % Impact on CAGR Forecast | Geographic Relevance | Impact Timeline |
|---|---|---|---|
| Nationwide E15/E10 fuel-blending waivers expanding ethanol offtake | +1.6% | North America core (US Corn Belt), spill-over to Canada | Short term (≤2 years) |
| Corn oil diversion into Sustainable Aviation Fuel (SAF) feedstock pathways | +1.3% | North America core, EU aviation corridors | Medium term (2-4 years) |
| Rising DDGS/co-product export demand for livestock feed | +0.9% | APAC (Vietnam, Indonesia, India), Mexico, North America supply base | Short term (≤2 years) |
| Yield-efficiency gains from fractionation and enzyme technology upgrades | +1.1% | North America core, EU retrofit corridors | Medium term (2-4 years) |
| Processed-food and snack demand growth in emerging economies | +0.8% | APAC (India, China, Southeast Asia), South America spill-over | Long term (≥4 years) |
| Policy uncertainty and blend-wall/food-price pushback | -0.7% | North America core, EU regulatory bodies | Short term (≤2 years) |
Restraint Analysis
Feedstock (Corn) Price Volatility Compressing Crush Margins
Corn constitutes roughly 80% of the direct variable cost structure at a dry-mill ethanol facility, and 2025 futures swung from below $4.00 per bushel to nearly $5.00 per bushel within a single crop year, dragging weekly net production profit across a wide band from a loss of $0.05 per gallon to a peak gain of $0.56 per gallon before settling at a full-year average of roughly $0.21 per gallon; this single-input dependency means every $0.25/bushel swing in corn typically moves plant-level operating margin by an estimated $0.02-0.03 per gallon, a magnitude large enough to flip a mid-sized 100-million-gallon-per-year plant between an annualized $2 million profit and a comparable loss position within a single quarter, forcing smaller, non-vertically-integrated operators without forward corn-basis contracts to curtail run-rates, delay maintenance CapEx, and rely on co-product (DDGS, corn oil) revenue as a margin buffer rather than a growth lever.
Restraint Impact Analysis
| Restraint | (~) % Impact on CAGR | Geographic Relevance | Impact Timeline |
|---|---|---|---|
| Feedstock (corn) price volatility compressing crush margins | -1.4% | North America core, EU importers | Short term (≤2 years) |
| Steel/equipment tariffs inflating retrofit and CapEx costs | -1.0% | North America core, UK/EU derivative-trade corridors | Medium term (2-4 years) |
| Natural gas and utility cost exposure at processing plants | -0.6% | North America core, EU spill-over | Short term (≤2 years) |
| Food-vs-fuel political and regulatory pushback | -0.8% | North America core, EU policy bodies | Medium term (2-4 years) |
| Water usage and wastewater discharge compliance burden | -0.5% | North America core, APAC water-stressed states | Long term (≥4 years) |
| E15 waiver renewal uncertainty and retail infrastructure gap | -0.7% | North America core | Short term (≤2 years) |
Opportunity Analysis
45Q Carbon Capture Monetization via CO2 Pipeline Offtake
Unlike the SAF and E15 drivers already embedded in baseline volume forecasts, carbon capture monetization represents an entirely new, non-ethanol revenue line that most dry-mill operators have not yet activated at scale, since the federal 45Q credit — locked at $85 per metric ton for point-source geologic storage under the 2025 reconciliation bill, with inflation indexing beginning in 2027 off a 2025 base year only becomes commercially attractive once a plant secures pipeline access, and Summit Carbon Solutions’ Midwest project, which has grown to include 57 partner ethanol facilities after years of permitting delays, is now targeting operational start in 2026, unlocking an estimated $15-25 million in annual incremental credit revenue for a cluster of mid-sized plants that previously vented fermentation CO2 as a zero-value byproduct; because the qualifying-facility construction deadline was extended to January 1, 2026, plants that have not yet contracted pipeline capacity face a closing strategic window, making this a genuine white-space capital-allocation decision rather than a currently monetized driver, with early movers positioned to convert an emissions liability into a margin-accretive credit stream worth an estimated $0.08-0.12 per gallon once fully scaled.
Opportunity Impact Analysis
| Opportunity | (~) % Potential CAGR Upside | Geographic Relevance | Execution Window |
|---|---|---|---|
| 45Q carbon capture monetization via CO2 pipeline offtake | +1.5% | North America core (Iowa, Nebraska, Minnesota, South Dakota) | Medium term (2-4 years) |
| Corn fiber-to-cellulosic ethanol bolt-on conversion | +1.2% | North America core, EU retrofit-eligible plants | Medium term (2-4 years) |
| Corn protein isolate pivot into food/pharma-grade ingredients | +1.0% | North America core, EU specialty-ingredient buyers, APAC emerging demand | Long term (≥4 years) |
| Roll-up M&A consolidation of independent dry-mill assets | +0.9% | North America core, fragmented mid-tier operator base | Short term (≤2 years) |
| Greenfield dry-mill capacity build-out in APAC maize belts | +1.4% | APAC (India, Vietnam, Indonesia), South America spill-over | Long term (≥4 years) |
| Long-term SAF feedstock supply contracts with refiners | +1.1% | North America core, EU aviation-fuel buyers | Medium term (2-4 years) |
Challenges Analysis
Skilled Operator and Maintenance Talent Gap
The structural vulnerability originates in an aging technical workforce compounded by a broader manufacturing recruitment crisis, with 79% of manufacturing leaders citing skilled labor as their top operational challenge entering 2026, a figure up 9 percentage points from the prior year, and this shortage directly hits dry-mill plants that require specialized instrumentation technicians, fermentation biochemists, and boiler-certified operators who cannot be trained on standard community-college timelines shorter than 12-18 months; quantitatively, an estimated 15-20% vacancy rate for skilled maintenance roles at rural Corn Belt facilities forces plants to rely on overtime premiums that can inflate labor cost per gallon by 6-10%, delay preventive-maintenance cycles by an estimated 2-4 weeks per quarter, and constrain the pace at which newly commissioned 45Q or SAF-adjacent retrofit lines can be staffed and ramped to full capacity; the long-term corporate adjustment required is a shift from reactive local hiring toward structured apprenticeship pipelines, cross-training programs, and in some cases remote-monitoring/automation investment to offset headcount gaps, a resolution path that realistically spans four-plus years given training-cycle and workforce-demographic realities.
Challenges Impact Analysis
| Challenge | (~) % CAGR Friction Drag | Geographic Relevance | Mitigation Horizon |
|---|---|---|---|
| Skilled operator and maintenance talent gap | -0.8% | North America core, APAC greenfield sites | Long term (≥4 years) |
| Rail car and grain logistics bottlenecks | -0.9% | North America core (Upper Midwest corridors), export ports | Medium term (2-4 years) |
| Corn yield variability from shifting weather patterns | -1.0% | North America core, South America spill-over | Long term (≥4 years) |
| OT/IT cybersecurity exposure at connected plants | -0.5% | North America core, EU critical-infrastructure zones | Medium term (2-4 years) |
| Basis and freight-surcharge cost unpredictability | -0.6% | North America core, Mexico export corridor | Short term (≤2 years) |
| Cross-border project execution and permitting delays | -0.7% | APAC (India), EU regulatory hubs | Long term (≥4 years) |
Geopolitical Impact Analysis
Ongoing Wars Increase Grain and Cost Pressure on Dry Milling
The Russia–Ukraine war and conflict around Middle Eastern shipping routes are keeping the Dry Milling Market exposed to grain, fertilizer, energy, and freight volatility. Ukraine remains an important supplier of corn and other grains, so damage to Black Sea infrastructure, port interruptions, and slower shipments can tighten raw-material availability and raise procurement costs.
- The European Commission reported in July 2026 that around 255 million tonnes of Ukrainian grain, oilseeds, and related products had been exported since May 2022 through EU Solidarity Lanes and Ukrainian Black Sea ports, showing how global grain flows still depend on secure transport corridors.
Price pressure has also returned. FAO reported that world maize prices increased 3.6% in July 2026, partly because firmer energy markets and geopolitical tensions affected commodity sentiment. UNCTAD also reported that ship transits through the Strait of Hormuz had fallen by about 95% during the 2026 disruption, lifting oil, gas, freight, marine-fuel, and insurance costs.
Regional Insights
North America dominates the Dry Milling Market with a 40.00% share, valued at around USD 0.80 billion.
North America maintained a dominant position in the Dry Milling Market in 2025, capturing more than a 40.00% share and generating about USD 0.80 billion. The region benefits from a large corn base, mature ethanol infrastructure, established feed demand, and extensive food-processing capacity. USDA data show that North American corn production was estimated at 472.9 million metric tons for 2025/26, while regional corn imports reached 28.95 million metric tons.
- The strength of dry milling is particularly visible in the U.S. ethanol industry. USDA reported that dry mills accounted for 92.0% of corn used for fuel-alcohol production in April 2026, when 428 million bushels of corn went into fuel alcohol. Canada further supports regional raw-material availability, producing 14.9 million tonnes of grain corn in 2025. These volumes provide reliable corn supplies for ethanol, DDGS, flour, meal, grits, and other dry-milled products.
Asia Pacific is emerging as the fastest-growing regional opportunity for dry milling, supported by expanding corn output, feed manufacturing, packaged foods, and higher-value grain processing. China provides the clearest industrial base. FAO estimated Chinese maize production at a record 299 million tonnes in 2025, with around 80% of the national crop produced in the North China Plain.
USDA Foreign Agricultural Service reported that China’s corn-processing capacity reached about 130 million metric tons by the end of 2025, with more than 70% of capacity focused on starch-based processing. The sector consumed more than 80 million metric tons of corn in 2025, equal to 26% of total corn use. USDA also projected China’s 2026/27 corn production at 306 million metric tons. This expanding processing base creates opportunities for dry-milled food ingredients, feed products, fermentation inputs, and value-added corn derivatives.
Key Regions and Countries Insights
- North America
- US
- Canada
- Europe
- Germany
- France
- The UK
- Spain
- Italy
- Rest of Europe
- Asia Pacific
- China
- Japan
- South Korea
- India
- Australia
- Rest of APAC
- Latin America
- Brazil
- Mexico
- Rest of Latin America
- Middle East & Africa
- GCC
- South Africa
- Rest of MEA
Key Players Analysis
Archer Daniels Midland Company (ADM) holds a strong position in dry milling through its corn processing and ethanol operations. In 2025, ADM generated USD 80.27 billion in revenue. Its Vantage Corn Processors business, which includes corn dry-milling ethanol operations, reported USD 127 million operating profit in Q1 2026 and USD 85 million in Q2 2026.
Cargill, Incorporated maintains a broad position in grain processing through corn ingredients, food products, and agricultural supply chains. In fiscal 2025, the company generated USD 154 billion in revenue, employed more than 155,000 people, operated across 70 countries, and served 125 markets. Its dry-milled corn portfolio includes corn flour, corn meal, and corn grits used in cereals, snacks, bakery products, beer, and baby foods.
Grain Craft is one of the largest independent millers in the United States and has built a strong position in flour and grain ingredient processing. The company operates 21 milling locations across its current network and has more than 100 years of milling experience. Its portfolio includes wheat flour, masa flour, and milled corn products, with corn-processing facilities in 3 U.S. states.
Top Key Players Outlook
- Archer Daniels Midland Company (ADM)
- Cargill, Incorporated
- Grain Craft
- SunOpta Inc.
- Grain Millers, Inc.
- SEMO Milling, LLC
- LifeLine Foods, LLC
- Didion Inc.
- Green Plains Inc.
- Alto Ingredients, Inc.
- Valero Energy Corporation
- Flint Hills Resources, LLC
- C.H. Guenther & Son, LLC
- Grain Processing Corporation
- Ingredion Incorporated
Recent Developments
- In June 2026, SunOpta also opened an expanded production line at its Omak, Washington facility after investing more than USD 25 million, increasing fruit-snack capacity by 25%. The site employs more than 260 people, while SunOpta operates 7 manufacturing facilities across 6 markets.
- In 2026, LifeLine reached its 25th year in corn milling and continued operating its 750,000-square-foot St. Joseph, Missouri facility. Its integrated processing system uses 100% of each corn kernel, supporting dry-milled flour, grits, snack meal, pregelatinized flour, masa, ethanol, distillers grains, and corn oil.
- In August 2026, Green Plains reported that its platform included 9 biorefineries capable of processing about 287 million bushels of corn annually and producing around 850 million gallons of ethanol, showing the scale of its dry-milling footprint.
Report Scope
| Report Features | Description |
|---|---|
| Market Value (2025) | USD 92.7 Bn |
| Forecast Revenue (2035) | USD 151.1 Bn |
| CAGR (2026-2035) | 5.0% |
| Base Year for Estimation | 2025 |
| Historic Period | 2020-2024 |
| Forecast Period | 2026-2035 |
| Report Coverage | Revenue Forecast, Market Dynamics, Competitive Landscape, Recent Developments |
| Segments Covered | By Source (Yellow corn, White corn), By End Product (Ethanol, DDGS, Corn Flour, Cornmeal and Corn Grits), By Application (Food, Animal feed, Fuel) |
| Regional Analysis | North America – US, Canada; Europe – Germany, France, The UK, Spain, Italy, Rest of Europe; Asia Pacific – China, Japan, South Korea, India, Australia, Singapore, Rest of APAC; Latin America – Brazil, Mexico, Rest of Latin America; Middle East & Africa – GCC, South Africa, Rest of MEA |
| Competitive Landscape | Archer Daniels Midland Company (ADM), Cargill, Incorporated, Grain Craft, SunOpta Inc., Grain Millers, Inc., SEMO Milling, LLC, LifeLine Foods, LLC, Didion Inc., Green Plains Inc., Alto Ingredients, Inc., Valero Energy Corporation, Flint Hills Resources, LLC, C.H. Guenther & Son, LLC, Grain Processing Corporation, Ingredion Incorporated |
| Customization Scope | Customization for segments, region/country-level will be provided. Moreover, additional customization can be done based on the requirements. |
| Purchase Options | We have three licenses to opt for: Single User License, Multi-User License (Up to 5 Users), Corporate Use License (Unlimited User and Printable PDF) |





































