
Quick Navigation
Report Overview
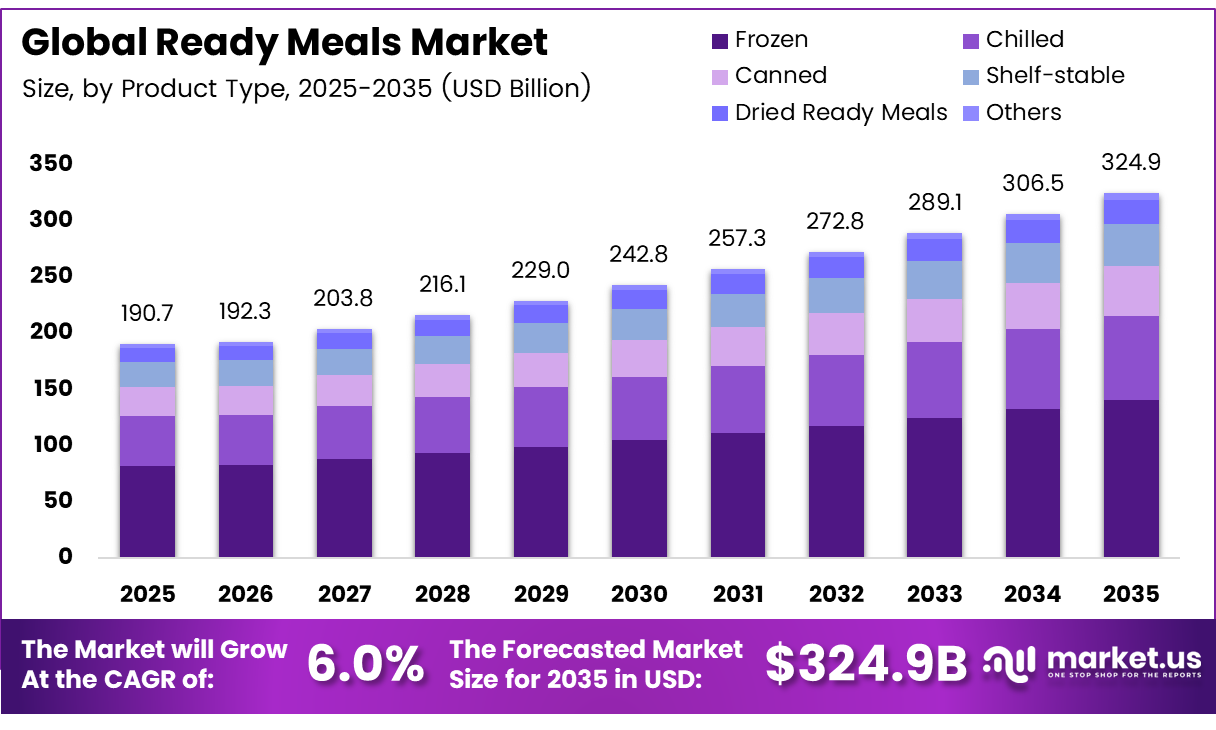
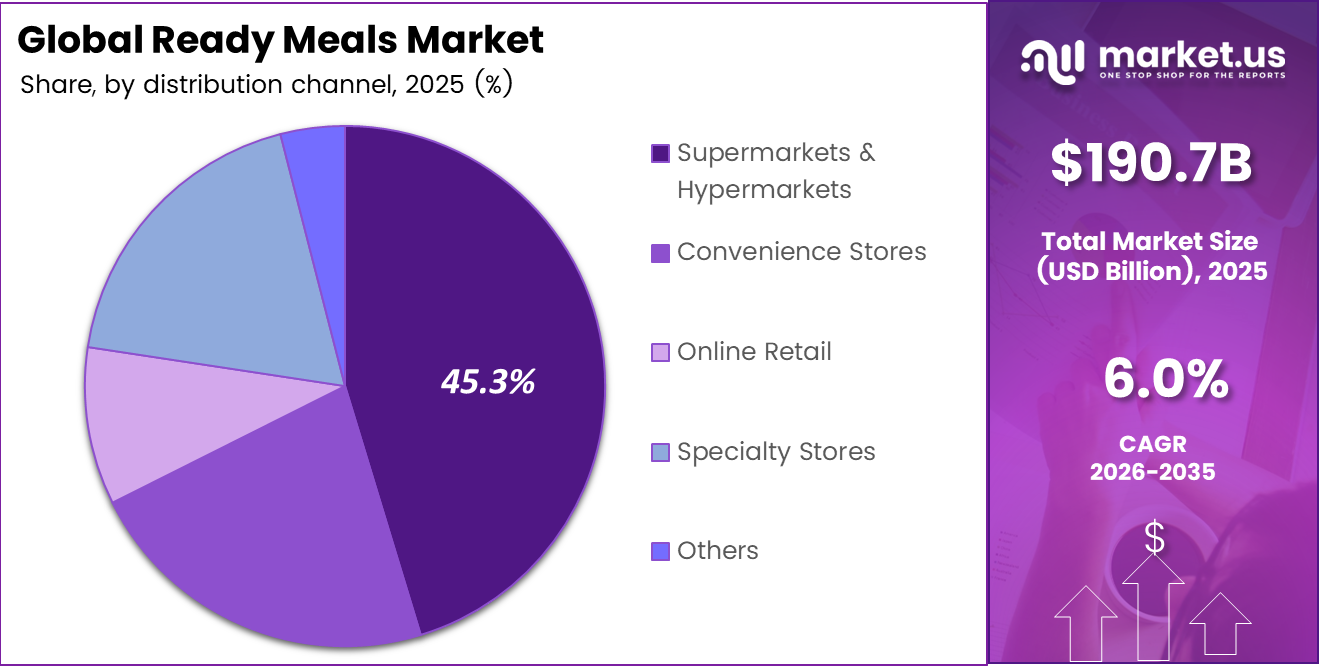
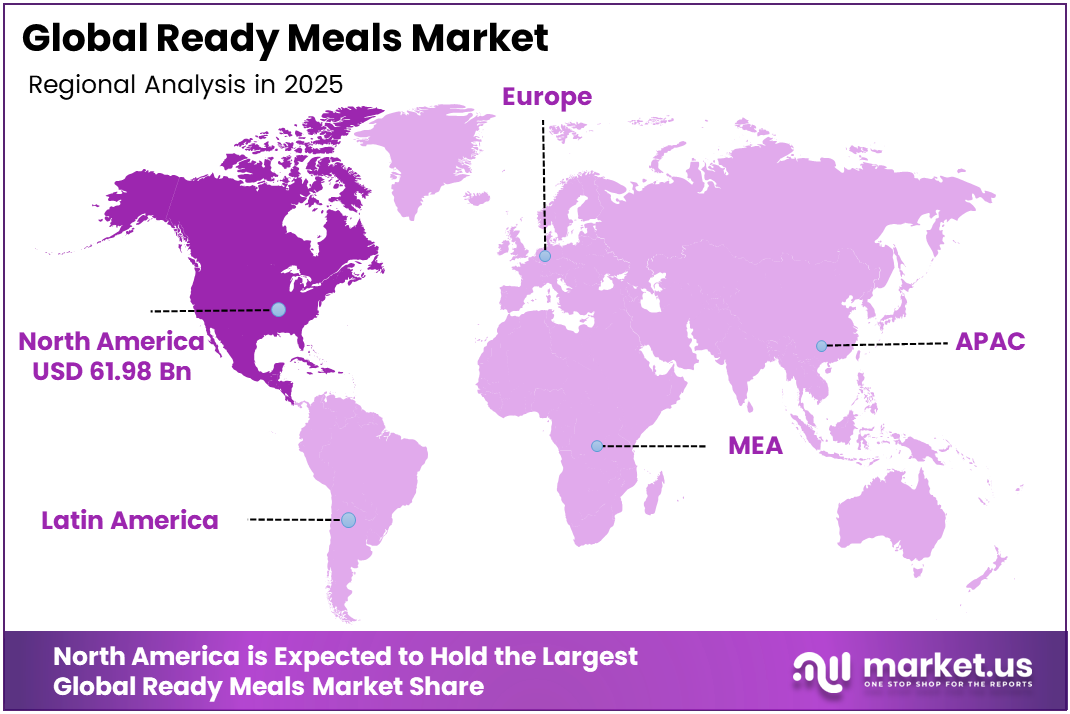
The Global Ready Meals Market was valued at USD 190.7 billion in 2025 and is expected to grow to USD 324.9 billion in 2035. Between 2025 and 2035, this market is estimated to register a CAGR of 6.0%. In 2025, the North America market achieved over 32.5% share with a revenue of US$ 61.98 billion.
The scale of production and consumption demonstrates how deeply ready meals have become embedded in modern food systems. During its 2025 financial year, Greencore produced 148 million chilled ready meals through a network that included 16 manufacturing sites and 17 distribution centres in the UK. Bakkavor’s dedicated pasta facility also manufactured 1.43 million M&S meals in a single week after the company invested in new equipment and employee training. These figures highlight the importance of high-capacity production, efficient distribution, and workforce development in meeting growing retailer and consumer demand.
Subscription-based ready-meal services are also benefiting from consumers’ preference for convenient and regularly delivered food. UK ready-to-eat meal provider Frive supplied more than 170,000 meals per week to over 23,000 subscribers. The company reported a customer lifetime-value-to-acquisition-cost ratio of 5.5 times, indicating that effective customer retention and repeat purchasing can support the commercial viability of direct-to-consumer ready-meal platforms.
The global ready meals market continues to expand as consumers seek convenient, time-saving food options that require minimal preparation. Ready meals are pre-cooked and pre-packaged products designed for easy consumption at home, making them particularly suitable for busy professionals, students, and families.
Manufacturers are increasingly adopting automation and artificial intelligence to improve production speed, consistency, and scalability. Chef Robotics raised $43.1 million to expand its AI-enabled robotic meal-assembly systems. The funding included $20.6 million in equity and $22.5 million in equipment-financing debt for its Robotics-as-a-Service model. Such investments show how ready-meal producers are using advanced technology to manage labour constraints, increase throughput, and maintain product quality as demand grows.
Key Takeaways
- The Ready Meals Market was valued at US$ 190.7 billion in 2025.
- The Ready Meals Market is projected to grow at a CAGR of 6.0% and is estimated to reach US$ 324.9 billion by 2035.
- In terms of product Type, Frozen Ready Meals dominate the market with a share of 43.2%, followed by Chilled at 23.2%.
- By meal type, Non-vegetarian holds the largest share at 51.2%, followed by Vegetarian (34.2%) and Vegan (14.6%).
- Supermarkets & Hypermarkets are the leading distribution channel, accounting for 45.3% of the total market.
- In terms of end user, the Residential segment dominates with a significant share of 61.4%.
- North America remains the largest regional market, holding 32.5% share of the global ready meals market.
By Product Analysis
Global Ready Meals Market Share Analysis by Product Type
The Ready Meals Market in the Global industry can be divided based on different Product Types. Among those, the Frozen Ready Meals occupy the biggest market share. With an outstanding 43.2% market share, it remains the most significant category in the segment. One of the reasons behind its popularity is the longevity of these meals; they can be stored easily and do not need much effort.
Chilled Ready Meals are another category, taking up 23.2% of the market share. They remain in high demand because of the better quality that they provide to consumers. In particular, people prefer chilled meals because of their freshness. Thus, these products become more similar to homemade ones and are preferred by a certain audience. Other segments include Canned (13.5%), Shelf-stable (11.6%), Dried Ready Meals (6.7%), and Others (1.8%).
Meals Type Analysis
Global Ready Meals Market Analysis by Dietary Preference
The global ready meals market is hugely influenced by the type of diet that people adopt. The largest market share of Ready Meals belongs to the Non-vegetarian sector, occupying 51.2%. It is a popular segment owing to the significance of meals centred on meat products, such as chicken, beef, and seafood dishes. These foods remain an integral part of many cultures and are very much sought after for their high protein content and pleasant flavour.
People appreciate the convenience of a complete and protein-rich meal that can be consumed immediately without having to procure, prepare, and cook raw meat products. The vegetarian segment is the second largest, with its share of the market being 34.2%. Its success has been boosted by the growing trend towards healthier lifestyles and a variety of cultural/religious preferences, among other things.
The Vegan segment remains constant at 14.6% of market share and is an indication of a fast-evolving market that experiences rapid changes. The market is characterised by increasing ethical concerns, increased environmental awareness, and consumers switching to a pure plant-based diet due to health or allergic reasons. There are innovations in terms of superior quality plant-based protein and dairy-free products to maintain the taste and texture of such meals. All of these trends are an indication of an effective market reaction to changes in consumer needs and health demands.
Distribution Channel Analysis
Global Ready Meals Market Analysis by Distribution Channel
The supermarkets and hypermarkets are the most dominant distribution channels in the ready meals industry. They account for a substantial 45.3% of the total market share. The success of the two distribution channels is attributed largely to the convenience offered by providing an array of goods within one setting when shoppers are purchasing other groceries. Also, there is a preference for the physical store since the customer can view and select the best food products on their own.
Supermarket and hypermarket giants like the huge retail chains provide consumers with easy access to ready meals through their routine purchases in the form of a wide range of choices all available at one place. Likewise, online retailing sites that deliver food to their consumers have become popular because they provide consumers with the facility to order their ready meals right at home.
End User Analysis
Residential and Food Service Demand in the Ready Meals Market
The Residential segment clearly leads the market, holding a substantial share of 61.4%. This strong performance is mainly driven by busy households, working professionals, and students who prefer convenient meal solutions that are quick to prepare at home. As lifestyles become faster, more families are choosing ready meals as an easy and practical alternative to cooking from scratch every day.
The Food Services segment, which includes restaurants, catering companies, offices, and institutional kitchens, accounts for the remaining share. This segment is important for serving large groups and meeting the demand for quick meals outside the home. While it is smaller than the residential segment, it continues to grow steadily as more food service providers look for high-quality, time-saving meal options.
Key Market Segments
By Product Type
- Frozen
- Chilled
- Canned
- Shelf-stable
- Dried Ready Meals
- Others
By Meal Type
- Vegetarian
- Non-vegetarian
- Vegan
By Distribution Channel
- Supermarkets & Hypermarkets
- Convenience Stores
- Online Retail
- Specialty Stores
- Others
By End-User
- Residential
- Food Services
Market Dynamics
Opportunity
GLP-1-oriented nutrition represents an emerging opportunity rather than an established market driver. Ready-meal manufacturers are beginning to develop high-protein, micronutrient-dense frozen products for medication users and the broader weight-management population instead of treating these consumers as part of a general health segment. Potential products could provide 20–30 grams of protein and 6–10 grams of fibre within controlled calorie and portion ranges.
These formulations may support price premiums of 12%–25%, encourage repeat purchases, and attract consumers shifting spending from restaurant meals toward health-focused grocery options. A broader platform covering frozen bowls, breakfast products, and snack-sized meals could add approximately 1.4 percentage points to category CAGR in markets with high prescription uptake, dedicated retail health sections, and strong digital-wellness merchandising.
| Opportunity | (~) % Potential CAGR Upside | Geographic Relevance | Execution Window |
|---|---|---|---|
| GLP-1 nutrition platforms | +1.4% | North America core, UK, Western Europe | Short term (≤ 2 years) |
| High-protein value tiers | +1.1% | North America, Latin America urban, APAC metros | Short term (≤ 2 years) |
| Heat-and-eat subscriptions | +1.3% | North America, UK, Australia, Tier-1 APAC cities | Medium term (2-4 years) |
| Private-label premiumization | +0.9% | EU grocery, North America retail, India modern trade | Medium term (2-4 years) |
| Emerging-market cold-chain infill | +1.6% | India, Southeast Asia, GCC, Latin America | Long term (≥ 4 years) |
| Functional healthy reformats | +1.2% | EU, North America, developed APAC | Medium term (2-4 years) |
Drivers
The strongest current growth driver is the continuing replacement of scratch cooking and selected foodservice occasions with convenient at-home meals. Ready meals benefit from time-constrained lifestyles, dual-income households, and recurring weekday consumption, creating more stable demand than categories dependent on temporary food trends.
North America represents approximately 32% of the broader ready-to-eat food market in 2026, while households remain the principal consumption setting. This demand pattern encourages manufacturers to adopt standardised high-throughput SKUs, larger replenishment cycles, and tighter retailer fill-rate management. An increase of 2–4 percentage points in weekly household penetration can improve plant utilisation and fixed-cost absorption, supporting a modelled positive CAGR contribution of 1.6 percentage points.
| Driver | (~) % Impact on CAGR Forecast | Geographic Relevance | Impact Timeline |
|---|---|---|---|
| Convenience-led meal replacement | +1.6% | North America core, Western Europe, Japan, urban APAC | Short term (≤ 2 years) |
| Grocery inflation trade-in effect | +0.9% | North America, UK, EU, India metros | Short term (≤ 2 years) |
| Frozen format resilience | +1.1% | North America, EU, developed APAC | Medium term (2-4 years) |
| Retail freezer expansion | +0.8% | North America retail, EU grocery, APAC modern trade | Medium term (2-4 years) |
| Health-forward product renovation | +1.0% | North America, EU, UK, Australia | Medium term (2-4 years) |
| Digital grocery discoverability | +0.7% | North America, China, UK, South Korea | Short term (≤ 2 years) |
Restraints
Household price sensitivity remains the most immediate restraint on ready-meal growth in 2026. Consumers continue to purchase the category, but volume expansion slows when branded and premium meals are compared with home-cooked alternatives or lower-priced private-label products. Food-at-home inflation stands at 3.2%, while overall food inflation is forecast at 3.4%, increasing pressure on household grocery budgets.
The effect is particularly significant for families, as branded ready meals can cost 20%–60% more per serving than equivalent ingredients, depending on protein content and retail channel. This price difference may lead consumers to trade down, reduce basket sizes, or buy ready meals less frequently. The resulting -1.1% CAGR effect reflects limits on premiumization, innovation pricing, and purchase-frequency expansion rather than a fundamental decline in demand.
| Restraint | (~) % Impact on CAGR Forecast | Geographic Relevance | Impact Timeline |
|---|---|---|---|
| Consumer price sensitivity | -1.1% | North America, UK, EU, Latin America urban | Short term (≤ 2 years) |
| Nutrition perception discount | -0.9% | EU, North America, Australia, affluent APAC | Medium term (2-4 years) |
| Input cost inflation | -1.0% | Global | Short term (≤ 2 years) |
| Packaging material inflation | -0.7% | Global, export-oriented hubs | Medium term (2-4 years) |
| Regulatory labeling burden | -0.6% | India, EU, UK, North America | Medium term (2-4 years) |
| Chilled distribution limits | -0.8% | Emerging APAC, Latin America, Africa | Long term (≥ 4 years) |
Challenges
Ready meals are not constrained by refrigeration dependence to the point of preventing sales, but cold-chain variability continues to limit category expansion. Temperature-controlled services account for 61.2% of food logistics activity and are growing faster than the wider logistics sector. In the United States, parts of the cold-chain network are also being redirected toward higher-margin pharmaceutical and clinical shipments, reducing slot availability for food producers and increasing transport-price volatility.
A manufacturer distributing 20,000–40,000 pallets annually may face reefer cost fluctuations of 4%–9%, seasonal dwell-time variations of 12–36 hours, and additional spoilage or write-off exposure of 0.3%–0.8% when warehouse turnover falls below plan.
Together, these pressures can reduce EBIT margins by approximately 60–140 basis points without significantly weakening consumer demand. Denser regional distribution networks, algorithmic route planning, co-manufacturing near consumption centres, and SKU rationalisation by temperature requirement could limit the resulting CAGR drag to about -0.8%.
| Challenge | (~) % CAGR Friction Drag | Geographic Relevance | Mitigation Horizon |
|---|---|---|---|
| Cold-chain cost volatility | -0.8% | North America core, EU chilled corridors, APAC metros | Medium term (2-4 years) |
| Packaging compliance complexity | -0.6% | EU regulatory hubs, India, UK, North America | Medium term (2-4 years) |
| Recipe reformulation strain | -0.7% | EU, UK, North America, urban APAC | Long term (≥ 4 years) |
| Labor and QA scarcity | -0.5% | North America plants, Western Europe, developed APAC | Medium term (2-4 years) |
| Channel mix margin dilution | -0.6% | North America retail, EU grocery, APAC e-grocery | Short term (≤ 2 years) |
| Demand forecasting instability | -0.7% | Global, especially multi-SKU urban markets | Medium term (2-4 years) |
Geopolitical Impact Analysis
Geopolitical tensions can affect the ready meals market by disrupting the supply and cost of important ingredients such as wheat, rice, edible oils, meat, dairy, and spices. The Russia-Ukraine war has made wheat and sunflower oil prices more unstable, increasing cost pressure on producers of pasta meals, frozen foods, sauces, bakery-based meals, and packaged dishes.
The Council of the EU reported that before the war, nearly 90% of Ukraine’s agricultural exports were transported by sea, and the blockade of Black Sea ports disrupted these flows. Trade restrictions, sanctions, higher transport costs, and energy price changes also add pressure on ready meal manufacturers.
FAO’s Food Price Index tracks price movements for cereals, vegetable oils, meat, dairy, and sugar, making it a useful measure for understanding input cost changes in this market. Since many producers depend on imported ingredients and packaging materials, supply disruptions can increase procurement costs and reduce supply stability. To manage these risks, companies are focusing on local sourcing, supplier diversification, better inventory planning, and long-term supply agreements.
Regional Analysis
The North America continent presently occupies a leading position in the global Ready Meals Market with its biggest market share amounting to 32.5%. This situation can be explained by several factors such as a hectic lifestyle, high disposable incomes, and the presence of a developed culture of ready-made food consumption. Ready-made meals are easily accepted by consumers in the USA and Canada and used in daily eating routines.
Asia Pacific is currently the fastest-growing regional market. Rapid urbanisation, rising working population, and changing dietary habits are pushing strong demand for convenient meal solutions, especially in China, India, and Japan.
The European market is another developed and important market that exists. The consumer population of this region is increasingly demanding high-quality and healthy meals. The high demand for these products in countries such as the UK, Germany, and France shows the need for traditional and international flavours. Equally significant is the growing Asia Pacific market, which has been experiencing rapid growth recently.
The Middle East offers interesting opportunities in the ready meal sector. With a large number of expatriates in the region, busy lifestyles, and hot climatic conditions, there is a high level of acceptance for ready meals in the region. There is rising interest in halal-certified meals of different international tastes.
Key Regions and Countries Covered in this Report
- North America
- US
- Canada
- Europe
- Germany
- France
- The UK
- Spain
- Italy
- Rest of Europe
- Asia Pacific
- China
- Japan
- South Korea
- India
- Australia
- Rest of APAC
- Latin America
- Brazil
- Mexico
- Rest of Latin America
- Middle East & Africa
- South Africa
- Saudi Arabia
- UAE
- Rest of MEA
Key Players Analysis
The world Ready Meals Market is somewhat fragmented, comprising both big multi-national companies and strong regional companies. North America dominates the market right now, followed by Europe and a rapidly growing Asia Pacific region. Leading organisations are trying to maintain their dominant position through innovation, healthy recipes, sustainability practices, and building wider distribution channels.
Although there are some global leaders who dominate the premium as well as frozen products category, regional companies still maintain their market share through lower-priced and preferred meals. In addition, recently some private label products of leading retailers have captured the market as well due to their reasonable price points and good quality meals.
The increasing popularity of online food ordering platforms has helped many established and new entrants gain access to customers. Many leading organisations are spending on Research & Development to come up with special products for special people having diet restrictions like no-carb, protein-rich, and allergen-free meals. Apart from that, strategic business alliances are also quite common among players for geographic expansion and improved portfolio.
The Following are Some of the Major Players in the Industry
- Conagra Brands, Inc.
- Dr. Oetker
- General Mills, Inc.
- Green Mill Foods
- Kellogg Company
- M. Smucker Co.
- McCain Foods
- Nestlé
- Nomad Foods
- The Kraft Heinz Company
- Tyson Foods, Inc.
- Unilever
- Others
Key Development
- In September 2025, Freshly launched a subscription-based DTC service featuring chef-made frozen ready meals, showcasing how digital-first food brands are leveraging e-commerce models to bypass traditional offline retail limitations and directly reach consumers.
- In April 2026, Nestlé introduced a sustainable packaging solution for its ready-to-eat meal portfolio, featuring fully circular, waste-free materials along with smart freshness indicators and reusable packaging, reflecting the company’s commitment to advanced sustainability and compliance with evolving green standards.
Report Scope
| Report Features | Description |
|---|---|
| Market Value (2025) | USD 190.7 Bn |
| Forecast Revenue (2035) | USD 324.9 Bn |
| CAGR (2026-2035) | 6.0% |
| Base Year for Estimation | 2025 |
| Historic Period | 2020-2024 |
| Forecast Period | 2026-2035 |
| Report Coverage | Revenue Forecast, Market Dynamics, Competitive Landscape, Recent Developments |
| Segments Covered | By Product Type (Frozen, Chilled, Canned, Shelf-stable, Dried Ready Meals, Others), By Meal Type (Vegetarian, Non-vegetarian, Vegan), By Distribution Channel (Supermarkets & Hypermarkets, Convenience Stores, Online Retail, Speciality Stores, Others), By End User(Residential, Food Services) |
| Regional Analysis | North America – The US & Canada; Europe – Germany, France, The UK, Spain, Italy, Russia & CIS, Rest of Europe; APAC- China, Japan, South Korea, India, ASEAN & Rest of APAC; Latin America- Brazil, Mexico & Rest of Latin America; Middle East & Africa- GCC, South Africa, & Rest of MEA |
| Competitive Landscape | Conagra Brands, Inc., Dr Oetker, General Mills, Inc., Green Mill Foods, Kellogg Company, M. Smucker Co., McCain Foods, Nestlé, Nomad Foods, The Kraft Heinz Company, Tyson Foods, Inc., Unilever, Others |
| Customization Scope | Customisation for segments and region/country-level will be provided. Moreover, additional customisation can be done based on the requirements. |
| Purchase Options | We have three licenses to opt for: Single User License, Multi-User License (Up to 5 Users), Corporate Use License (Unlimited Users and Printable PDF) |


