


Report Overview
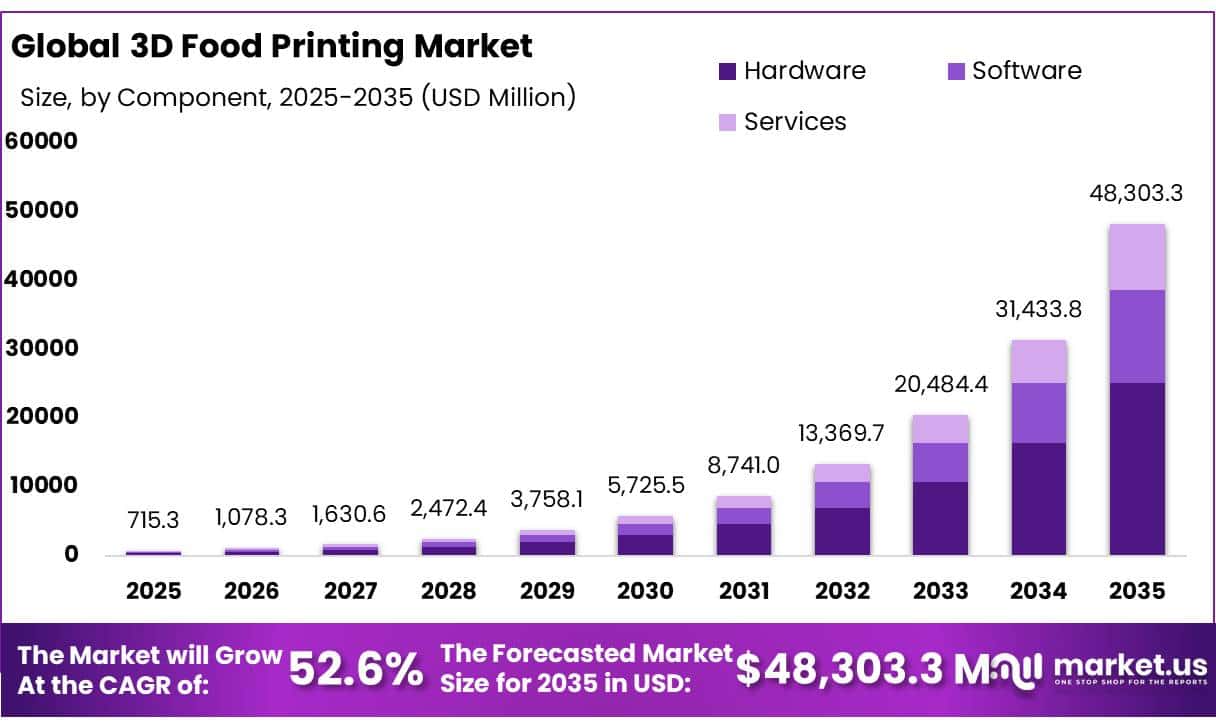
The Global 3D Food Printing Market size is expected to be worth around USD 48,303.3 Million by 2035, from USD 715.3 Million in 2025, growing at a CAGR of 52.6% during the forecast period from 2026 to 2035. In 2025, North America held a dominant market position, capturing more than a 40.10% share, holding USD 0.80 Billion revenue.
3D food printing is moving from an experimental food-design tool toward a digital manufacturing platform for customized meals, alternative proteins, confectionery, pasta, and clinical nutrition. The technology deposits edible pastes, gels, doughs, proteins, fats, and other “food inks” layer by layer from digital models.
- Revo Foods’ Vienna “Taste Factory” is a notable milestone, with company information citing production capability of up to 60 tonnes per month for 3D-structured food products. Natural Machines states that its Foodini platform has attracted interest from users in more than 90 countries and is used across professional kitchens, food manufacturers, research institutes, hospitals, nutrition organizations, and hospitality businesses.
Key Takeaways
- 3D Food Printing Market size is expected to be worth around USD 48,303.3 Million by 2035, from USD 715.3 Million in 2025, growing at a CAGR of 52.6%.
- Hardware held a dominant market position, capturing more than a 52.00% share in the 3D Food Printing Market.
- Extrusion-based printing held a dominant market position, capturing more than a 58.00% share.
- Dough held a dominant market position, capturing more than a 30.00% share in the 3D Food Printing Market.
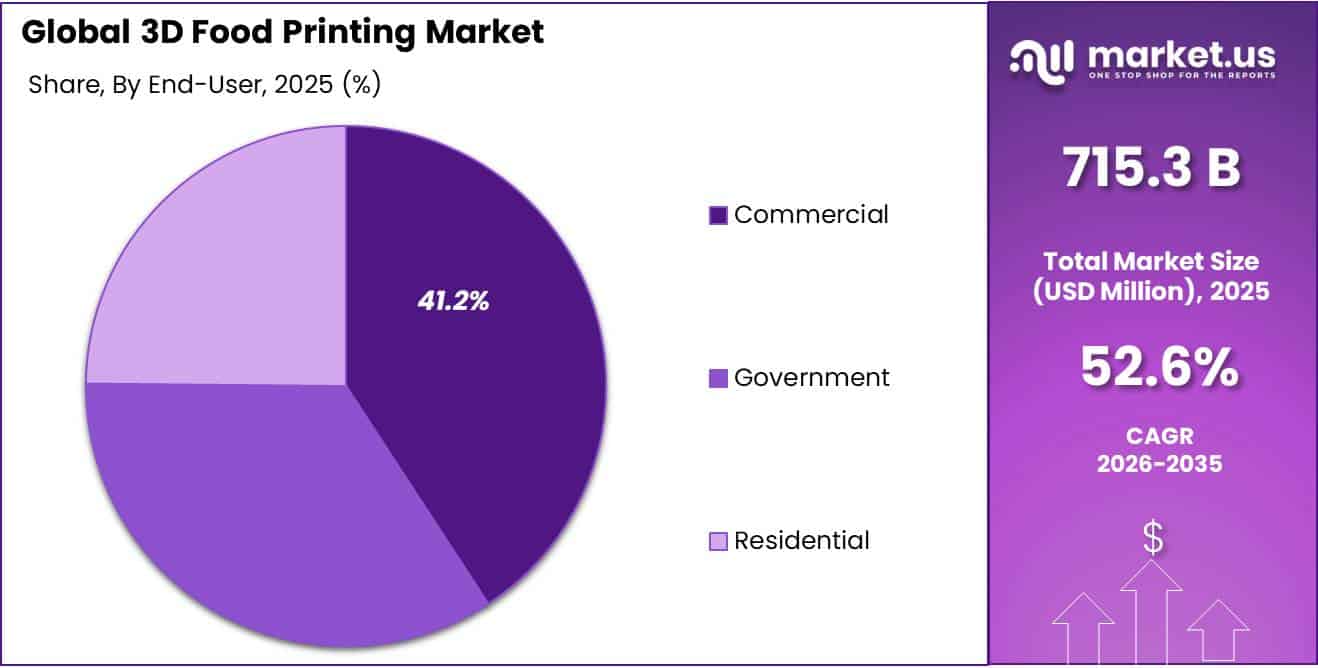
- Commercial held a dominant market position, capturing more than a 41.00% share in the 3D Food Printing Market.
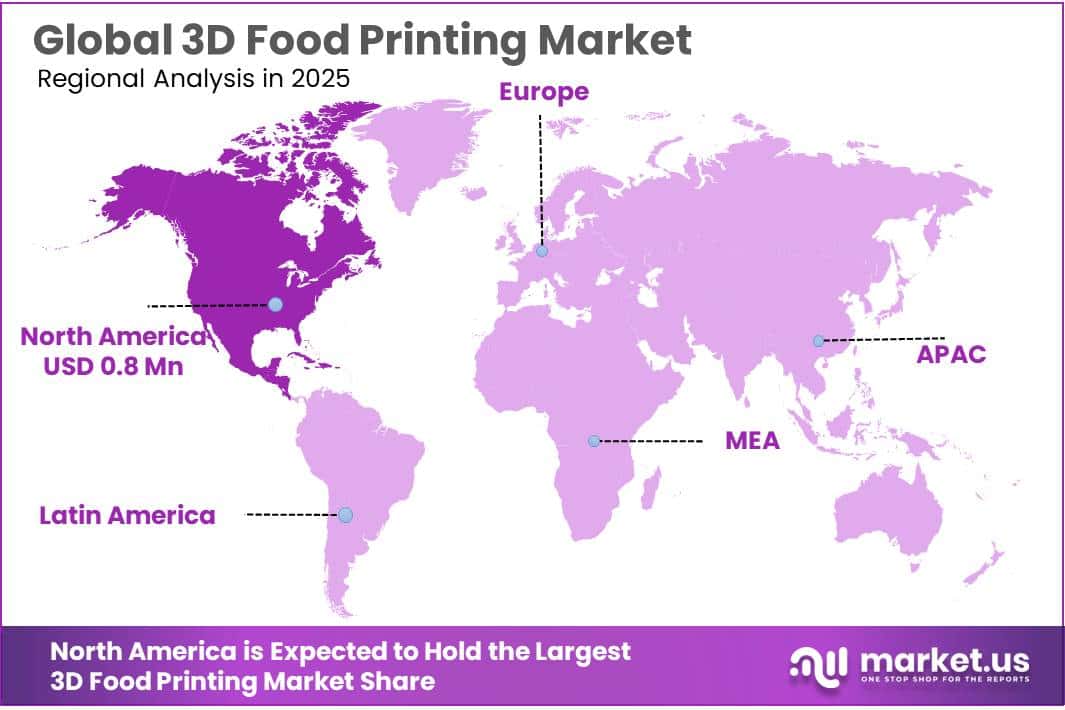
- North America held a dominant market position, capturing more than a 40.00% share and generating approximately USD 0.80 billion.
Personalized nutrition is a major driving factor because printers can alter portion size, texture, nutrient density, ingredient composition, and shape without rebuilding an entire production line. The U.S. Army awarded BeeHex approximately USD 1.55 million for a 3D food-printing control system intended to dispense macro- and micronutrients and tailor food to individual physiological needs.NASA previously provided USD 124,955 for development of a 3D-printed food system for long-duration space missions, demonstrating demand for automated, nutritionally controlled food preparation.
- Sustainability creates another strong opportunity. UNEP estimates that 1.05 billion tonnes of food were wasted at retail, food-service, and household levels in 2022, equal to 132 kilograms per person and almost 19% of food available to consumers. FAO separately estimates that 13.3% of food was lost globally between post-harvest and retail stages in 2023.
Healthcare nutrition is also gaining importance. Carleton University reported in 2025 that around 1 in 6 people experience dysphagia, while the University of Missouri noted that up to one-third of older adults may face the condition. The EU-supported HyPAD project cites a global ageing population expected to reach 1.5 billion by 2050 and is applying 3D food printing to nutrient-rich, texture-controlled foods for swallowing difficulties.
Future growth is expected from faster multi-material printers, integrated cooking, AI-assisted recipe design, alternative-protein structuring, and improved food-ink formulations using proteins, starches, hydrocolloids, fats, and functional ingredients. The European Commission’s FoodiniPro program received approximately EUR 1.84 million in EU funding for a connected platform combining 3D printing, laser cooking, artificial intelligence, and machine vision.
By Component Analysis
Hardware leads with a 52.00% share as printers remain essential to food production
In 2025, “Hardware” held a dominant market position, capturing more than a 52.00% share in the 3D Food Printing Market. Hardware remained the leading component because the printing unit, extrusion system, food cartridges, nozzles, temperature-control systems, sensors, and motion-control equipment directly determine printing accuracy and food consistency.
- Government digitalization statistics also support the wider environment for software-based production. In 2025, 52.7% of EU enterprises purchased cloud-computing services, while 26.1% of cloud-using enterprises purchased platforms for application development, testing, or deployment.
Software is becoming an important part of the 3D food printing ecosystem as manufacturers require digital design, slicing, recipe management, ingredient-specific printing parameters, equipment monitoring, and automated process control. Food printing differs from conventional additive manufacturing because each ingredient may require separate settings for layer height, deposition speed, geometry, and material flow.
By Technology Analysis
Extrusion-based printing leads with 58.00% share due to wider food compatibility
In 2025, “Extrusion-based printing” held a dominant market position, capturing more than a 58.00% share in the 3D Food Printing Market. The segment remained ahead because extrusion systems can process a broad range of soft and semi-solid ingredients, including dough, vegetable puree, cheese, chocolate, protein mixtures, gels, and plant-based formulations.
A 2025 study available through the U.S. National Library of Medicine further demonstrated the technical development of extrusion printing for functional foods. Researchers tested food gels containing encapsulated omega-3 and found that increasing incorporation from 3% to 6% improved important rheological characteristics while maintaining printable structures.
Binder jetting is developing as a specialized technology within the 3D Food Printing Market, particularly for confectionery and powdered-food applications. The process deposits a liquid binder selectively onto layers of food powder, allowing manufacturers to create complex shapes without forcing ingredients through an extrusion nozzle.
By Ingredient Analysis
Dough dominates with 30.00% share due to strong printability and familiar food applications
In 2025, “Dough” held a dominant market position, capturing more than a 30.00% share in the 3D Food Printing Market. Dough remains well suited to 3D food printing because its soft, semi-solid structure can pass through extrusion nozzles while maintaining the deposited shape. The UK Food Standards Agency identifies pasta dough and other dough-based materials as common ingredients for non-phase-changing extrusion and notes that different types of dough have already been successfully 3D printed.
Government production data also show the large flour-processing base supporting dough-based food applications. According to the USDA National Agricultural Statistics Service, U.S. mills processed 228 million bushels of wheat for flour during the fourth quarter of 2025 and produced 105 million hundredweight of flour.
Available wheat-flour milling capacity stood at 1.60 million hundredweight per 24 hours, indicating a well-established ingredient supply chain that can support conventional as well as digitally manufactured dough products.
By End User Analysis
Commercial dominates with 41.00% share as foodservice demand supports customized printing
In 2025, “Commercial” held a dominant market position, capturing more than a 41.00% share in the 3D Food Printing Market. Commercial users, including restaurants, bakeries, confectionery businesses, catering companies, and professional kitchens, are well suited to 3D food printing because the technology allows customized shapes, portion control, rapid recipe changes, and personalized presentation.
- According to the U.S. Department of Agriculture, inflation-adjusted food-away-from-home spending reached USD 1.41 trillion in 2025. Full-service restaurant sales reached USD 488.4 billion, while limited-service establishment sales reached USD 516.1 billion during the same year.
The project received an EU contribution of EUR 209,914.56 and officially started on 22 September 2025, demonstrating direct public funding for food-printing innovation. The project combines plant proteins and bioactive compounds with 3D printing to develop foods with controlled texture and improved nutritional value, creating potential applications in government-supported healthcare and elderly-care facilities.
Key Market Segments
By Component
- Hardware
- Software
- Services
By Technology
- Extrusion-based printing
- Binder jetting
- Selective laser sintering
- Inkjet printing
By Ingredient
- Dough
- Fruits and vegetables
- Proteins
- Sauces
- Other ingredients
By End User
- Commercial
- Government
- Residential
Driver Analysis
Regulatory Clarity Accelerating Commercial Deployment
The European Commission’s centralized novel-food pathway under Regulation (EU) 2015/2283 processed roughly 17 formal authorizations across four quarters of 2025, with EFSA accepting 29 applications during the same period, signaling that additive-manufactured and printed food matrices are being folded into an increasingly predictable, if still lengthy, approval architecture.
Application-guideline revisions introduced in February 2025 were designed to streamline data submission, yet authorization timelines still commonly exceed twelve months once Transparency Regulation (EU) 2019/1381 disclosure requirements are factored in, meaning printed-food manufacturers must budget for 12-18 month regulatory runways when planning ingredient-cartridge launches.
Strategically, this regulatory clarification is shifting business models away from one-off product launches toward platform licensing, where printer OEMs certify ingredient cartridges centrally and license formulations to food-service operators, reducing per-market compliance costs by amortizing dossier development across multiple national rollouts.
Drivers Impact Analysis
| Driver | (~) % Impact on CAGR Forecast | Geographic Relevance | Impact Timeline |
|---|---|---|---|
| Regulatory clarity for novel-food and additive-manufacturing food processes, easing route-to-market for printed proteins and functional foods | +2.4% | EU core, North America (US FDA framework) | Short term (≤2 years) |
| Rising clinical demand for dysphagia and elderly texture-modified nutrition integrating printed meal formats into hospital and care-home supply chains | +2.1% | EU, North America, Japan/South Korea aging-population corridors | Medium term (2-4 years) |
| Capital reallocation and consolidation within alternative-protein printing (plant-based and hybrid meat analogues) shifting unit economics from R&D burn to per-kg extrusion cost | +1.6% | North America core, EU, APAC (Israel, Singapore, China) | Medium term (2-4 years) |
| Defense and space-agency funded shelf-stable, on-demand food fabrication programs validating long-duration, low-gravity and remote-deployment print systems | +0.9% | North America (US), EU spill-over via ESA-linked programs | Long term (≥4 years) |
| Confectionery, bakery and hospitality-sector adoption of desktop and countertop printers for mass-customization and experiential dining, lowering commercial hardware price points | +1.3% | Global, concentrated in APAC urban centers and EU/North America foodservice chains | Short term (≤2 years) |
| Convergence with precision nutrition and digital health platforms enabling data-linked, subscription-based meal personalization | +1.8% | North America core, EU, APAC urban corridors | Medium to long term (2-5 years) |
Restraint Analysis
Slow Print Throughput Capping Industrial-Scale Unit Economics
The root cause of this restraint is mechanical: extrusion-based food printers deposit material layer-by-layer at rates far below conventional forming, filling or molding lines, with documented benchmarks showing a single 1.5-inch cube requiring roughly an hour to print and more complex geometries stretching into multi-hour cycles; translating this into a commercial lens, if a conventional bakery line can output 3,000-5,000 units per hour versus an estimated 8-15 units per hour from a single print head.
The effective CAPEX-per-unit-of-capacity for printed food runs at an estimated 200x-400x premium over automated conventional lines, forcing operators to either bank on ultra-premium pricing or accept multi-year payback periods exceeding 4-5 years on a typical USD 4,000-6,000 commercial unit; the strategic consequence is that CFOs at mid-market foodservice and confectionery chains are delaying CapEx approval cycles by 12-18 months pending multi-nozzle and parallelized print-head innovations, which directly compresses the addressable near-term market and suppresses the achievable CAGR by an estimated 2.6 percentage points through 2028.
Restraint Impact Analysis
| Restraint | (~) % Impact on CAGR Forecast | Geographic Relevance | Impact Timeline |
|---|---|---|---|
| Slow print throughput capping industrial-scale unit economics | -2.6% | Global, acute in North America/EU foodservice | Short term (≤2 years) |
| High hardware and per-kg ingredient cost versus conventional processing | -2.1% | North America core, EU, APAC premium urban | Medium term (2-4 years) |
| Hygiene, biofilm and food-contact migration risk in printer components | -1.7% | Global, most acute in home/decentralized use, EU regulatory scrutiny | Short term (≤2 years) |
| Consumer disgust, “unnatural” perception and low trust | -1.9% | EU, North America, religiously conservative APAC/Middle East corridors | Medium term (2-4 years) |
| Fragmented, lagging food-safety and additive-manufacturing regulation | -1.2% | EU, North America, APAC (China, India) | Medium term (2-4 years) |
| Limited ingredient printability and short post-print shelf life | -1.4% | Global | Long term (≥4 years) |
Opportunity Analysis
Cross-Industry Pivot into Nutraceutical and Pharma-Adjacent “Printlet” Manufacturing
This is not a current driver but a genuine adjacent-TAM pivot: while today’s baseline growth is anchored in confectionery and hospitality use cases, the pharmaceutical sector’s parallel maturation of personalized-dosage 3D printing, including FDA approval of the first 3D-printed drug Spritam back in 2015 and recent 1%-dosing-precision platforms from firms like Craft Health, creates a largely uncaptured white space for food-tech players to license print-head and rheology IP into nutraceutical and medical-food compounding pharmacies; because compounding pharmacies and personalized-supplement players currently rely on manual capsule-filling with
per-unit margins below 20%, food-tech firms that repurpose their multi-material dispensing architecture into 1%-precision dosing could command licensing or device-sale margins in the 45%-60% range, effectively opening a new TAM segment estimated in the low hundreds of millions of dollars globally that sits entirely outside conventional 3D-food-printing market definitions; capturing this requires regulatory dual-track certification within a 2-4 year window, positioning early movers to capture outsized share before larger pharma-automation incumbents notice the crossover opportunity.
Opportunity Impact Analysis
| Opportunity | (~) % Potential CAGR Upside | Geographic Relevance | Execution Window |
|---|---|---|---|
| Cross-industry pivot into nutraceutical and pharma-adjacent “printlet” manufacturing | +3.2% | North America core, EU, Singapore/APAC pharma hubs | Medium term (2-4 years) |
| Cloud-kitchen and dark-kitchen integration as a labor-arbitrage delivery format | +2.4% | APAC urban corridors, North America gig-delivery core | Short term (≤2 years) |
| Ingredient-cartridge and platform-licensing monetization (razor-and-blade IP model) | +2.1% | Global, led by North America and EU OEMs | Medium term (2-4 years) |
| M&A roll-up of fragmented alt-protein and hardware startups into vertically integrated platforms | +1.9% | North America core, EU, Israel/APAC alt-protein clusters | Long term (≥4 years) |
| First-mover entry into underpenetrated emerging markets (Africa, South Asia, Latin America) | +1.5% | Sub-Saharan Africa, South Asia, Latin America | Long term (≥4 years) |
| Food-waste-to-value circular economy monetization via byproduct reprocessing | +1.3% | EU core, APAC urban centers | Medium term (2-4 years) |
Challenges Analysis
Food Rheologist and Print-Engineer Talent Gap
The structural vulnerability originates in an interdisciplinary skills mismatch: food-material science, rheology and mechanical print-head engineering are taught in largely separate academic pipelines, and 2026 compensation data shows food-science median salaries in the US climbing to roughly USD 120,000, up 11.8% versus the 2024 median of USD 107,300, reflecting intensified competition for a shrinking specialist pool; the Institute of Food Technologists’ 2026 workforce white paper further flags systemic gaps in AI, systems-thinking and cross-disciplinary competencies precisely the skill combination 3D food printing R&D teams require.
While broader food-and-beverage manufacturing surveys show 78% of firms already leaning on automation to offset labor shortages, intensifying competition for the same limited engineering talent; the quantitative friction manifests as extended hiring cycles of an estimated 4-7 months for senior formulation-engineering roles and R&D budget dilution, since firms must pay premium salaries or fund in-house cross-training programs costing an estimated 8%-12% of annual R&D spend; the long-term corporate adjustment required is deeper academia-industry partnership pipelines and modular apprenticeship programs, since organic talent-market correction is unlikely before 2030 given multi-year university curriculum development cycles.
Challenges Impact Analysis
| Challenge | (~) % CAGR Friction Drag | Geographic Relevance | Mitigation Horizon |
|---|---|---|---|
| Food rheologist and print-engineer talent gap | -1.4% | North America core, EU, APAC R&D hubs | Long term (≥4 years) |
| Hydrocolloid and stabilizer input-cost volatility | -1.1% | Global, sourcing risk in APAC/Africa | Medium term (2-4 years) |
| File-format and hardware interoperability fragmentation | -0.9% | Global, acute in EU/North America multi-vendor deployments | Medium term (2-4 years) |
| Quality-consistency and batch-to-batch yield variance | -1.2% | Global | Medium term (2-4 years) |
| Cold-chain and cartridge logistics for perishable feedstocks | -0.8% | EU, North America, APAC urban delivery corridors | Short term (≤2 years) |
| Integration friction with legacy kitchen and ERP/CRM systems | -0.7% | North America core, EU enterprise foodservice | Short term (≤2 years) |
Geopolitical Impact Analysis
Geopolitical Tensions Raise Input Costs but Strengthen Localized Food Printing
Ongoing wars in Ukraine and the Middle East are creating a mixed impact on the 3D food printing market. The effect is uncertainty around ingredients, energy, shipping, and machine components. FAO reported in March 2026 that Ukraine’s 2025 cereal production was about 60.8 million tonnes, while 2025/26 cereal exports were forecast at around 40 million tonnes, 20% below the previous year.
Middle East conflict is adding another cost risk. UNCTAD reported in March 2026 that shipping transits through the Strait of Hormuz had fallen by more than 95%, while Brent crude moved above USD 90 per barrel. Higher fuel, fertilizer, freight, and insurance costs can raise expenses for food ingredients as well as printers, motors, sensors, and extrusion equipment.
Regional Insights
North America Dominates with 40.00% Share and USD 0.80 Billion Market Value
In 2025, North America held a dominant market position, capturing more than a 40.00% share and generating approximately USD 0.80 billion in the 3D Food Printing Market. The region benefits from an established additive-manufacturing ecosystem, advanced commercial kitchens, personalized nutrition research, and high spending on prepared food.
In the United States, food-away-from-home spending reached USD 1.41 trillion in 2025 and represented 56.3% of total food expenditure. Full-service restaurant sales reached USD 488.4 billion, while limited-service establishments generated USD 516.1 billion, creating a large commercial base for automated food preparation, customized meals, confectionery printing, and digitally controlled portioning.
Asia Pacific is emerging as the fastest-growing region as food manufacturers increasingly combine automation, additive manufacturing, alternative proteins, and customized nutrition. Singapore provides a strong example of this technology-driven environment. In 2026, its government reported that food manufacturing supported more than 48,000 workers and generated around SGD 4.3 billion in annual revenue, while more than half of locally manufactured food was exported.
Key Regions and Countries Insights
- North America
- US
- Canada
- Europe
- Germany
- France
- The UK
- Spain
- Italy
- Rest of Europe
- Asia Pacific
- China
- Japan
- South Korea
- India
- Australia
- Rest of APAC
- Latin America
- Brazil
- Mexico
- Rest of Latin America
- Middle East & Africa
- GCC
- South Africa
- Rest of MEA
Key Players Analysis
Natural Machines strengthens its position in 3D food printing through its Foodini platform, which has attracted interest from users in more than 90 countries. Foodini supports up to 5 ingredient capsules, each holding 100 ml, providing a combined capacity of 500 ml. The printer offers a maximum printing height of 110 mm, a 257 mm printing diameter, and capsule heating up to 90°C.
byFlow B.V. maintains a strong commercial presence through its Focus 3D Food Printer and OPUS chocolate-shaping platform. The company reports shipping its systems to 38 countries, serving more than 250 customers, and securing 2 granted patents. Its technologies have also contributed to more than 20 scientific publications, while byFlow Studio provides a digital collection exceeding 100 printable designs.
BeeHex, Inc. has expanded from 3D food printing into automated bakery decoration and precision food deposition. In 2026, the company reported that BeeHex machinery had decorated more than 10 million products, while its systems support production rates ranging from 100 to over 10,000 units per hour. BeeHex states that automation can reduce labor requirements by up to 70% and improve throughput by around 25–35%.
Top Key Players Outlook
- Natural Machines
- byFlow B.V.
- BeeHex, Inc.
- 3D Systems Corporation
- Systems and Materials Research Corporation
- TNO
- Choc Edge Ltd.
- Print2Taste GmbH
- Procusini
- Wiiboox
- mycusini
- FELIX Foodprinters
- Redefine Meat Ltd.
- NOVAMEAT
- Steakholder Foods Ltd.
Recent Developments
3D Systems generated USD 386.9 million in 2025 revenue and spent USD 65.0 million on R&D, showing continued investment capacity for new additive applications, including technologies that can potentially support future food, nutraceutical, and customized-material printing.
By January 2026, the 3DiH collaboration concluded after around 3.5 years, delivering digital tools and new 3D-printing production concepts for food businesses.
Report Scope
| Report Features | Description |
|---|---|
| Market Value (2025) | USD 715.3 Mn |
| Forecast Revenue (2035) | USD 48,303.3 Mn |
| CAGR (2026-2035) | 52.6% |
| Base Year for Estimation | 2025 |
| Historic Period | 2020-2024 |
| Forecast Period | 2026-2035 |
| Report Coverage | Revenue Forecast, Market Dynamics, Competitive Landscape, Recent Developments |
| Segments Covered | By Component (Hardware, Software, Services), By Technology (Extrusion-based printing, Binder jetting, Selective laser sintering, Inkjet printing), By Ingredient (Dough, Fruits and vegetables, Proteins, Sauces, Other ingredients), By End User (Commercial, Government, Residential) |
| Regional Analysis | North America – US, Canada; Europe – Germany, France, The UK, Spain, Italy, Rest of Europe; Asia Pacific – China, Japan, South Korea, India, Australia, Singapore, Rest of APAC; Latin America – Brazil, Mexico, Rest of Latin America; Middle East & Africa – GCC, South Africa, Rest of MEA |
| Competitive Landscape | Natural Machines, byFlow B.V., BeeHex, Inc., 3D Systems Corporation, Systems and Materials Research Corporation, TNO, Choc Edge Ltd., Print2Taste GmbH, Procusini, Wiiboox, mycusini, FELIX Foodprinters, Redefine Meat Ltd., NOVAMEAT, Steakholder Foods Ltd. |
| Customization Scope | Customization for segments, region/country-level will be provided. Moreover, additional customization can be done based on the requirements. |
| Purchase Options | We have three licenses to opt for: Single User License, Multi-User License (Up to 5 Users), Corporate Use License (Unlimited User and Printable PDF) |





































