


Report Overview
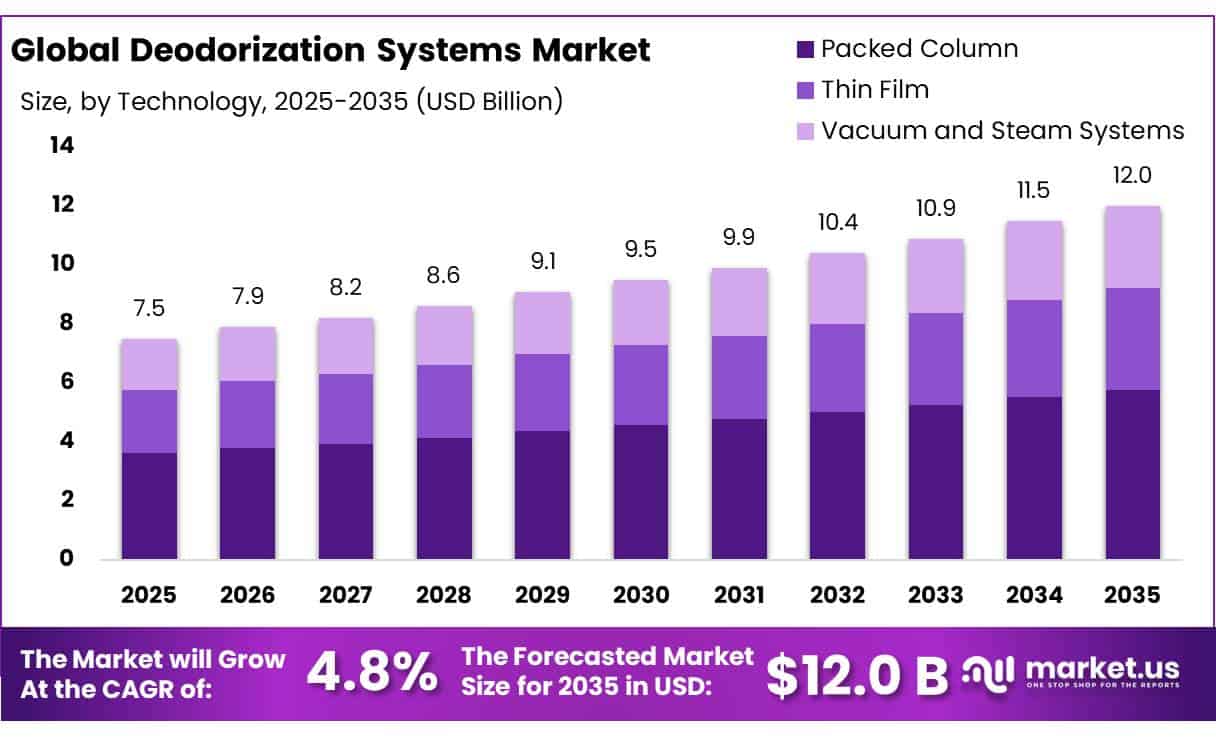
The Global Deodorization Systems Market size is expected to be worth around USD 12.0 Billion by 2035, from USD 7.5 Billion in 2025, growing at a CAGR of 4.8% during the forecast period from 2026 to 2035. In 2025, Asia Pacific held a dominant market position, capturing more than a 43.30% share, holding USD 3.26 Billion revenue.
Deodorization systems are an important part of industrial edible-oil and fats refining, where they remove unwanted odours, flavours, free fatty acids, and selected volatile contaminants from processed oils. The American Oil Chemists’ Society (AOCS) explains that industrial deodorization generally uses steam stripping under vacuum, with typical temperatures of 160–260°C, pressures of 1.5–5 mbar, and stripping-steam requirements of around 0.5–3% of processed oil.
The industrial scenario is supported by expanding oilseed processing and vegetable-oil consumption. According to the FAO, global soybean production is expected to reach a record 432.3 million tonnes in 2025/26, while global vegetable-oil consumption is forecast to exceed production during the same period. Meanwhile, USDA expects combined global crushing of major soybeans, rapeseed and sunflowerseed to increase by 4% in 2026/27.
Product-quality requirements are becoming an important technology driver. Deodorization takes place at temperatures normally exceeding 200°C, meaning system design has to balance effective volatile removal against excessive thermal exposure. AOCS notes that modern systems increasingly operate near 230–240°C, supported by lower-pressure operation, packed columns and dual-temperature processing. Industrial vaporization efficiency generally ranges between 0.3 and 0.7, creating continued opportunities for equipment suppliers to improve steam distribution, oil–vapour contact and process control.
Food-safety requirements are also influencing investment decisions. The European Food Safety Authority identifies 3-MCPD esters as process contaminants that may form during vegetable-oil refining, particularly under intensive thermal processing. This is encouraging refiners to use technologies that lower unnecessary heat exposure while retaining contaminant-removal efficiency. European Commission Best Available Techniques guidance shows deodorization operating at approximately 180–270°C under vacuum levels of about 0.5–8 mbar, highlighting how temperature and vacuum management remain central to process performance.
Energy efficiency is another strong industrial driver. The International Energy Agency reported that global final energy consumption exceeded 450 EJ in 2024, with industry accounting for nearly 40%. Global energy-efficiency progress improved to around 1.8% in 2025, compared with 1% in 2024.
Future opportunities are expected to concentrate around continuous processing, high-capacity plants, advanced vacuum systems, digital control and energy recovery. AOCS reports that continuous deodorization systems can achieve heat recovery of up to 85%, while modern commodity-oil installations can exceed 1,500 tonnes per day of deodorization capacity. Motive-steam demand can also be reduced by roughly 2.5–3 times through improved condenser-water cooling.
Key Takeaways
- Deodorization Systems Market size is expected to be worth around USD 12.0 Billion by 2035, from USD 7.5 Billion in 2025, growing at a CAGR of 4.8%.
- Towers held a dominant market position, capturing more than a 26.00% share.
- Packed Column held a dominant market position, capturing more than a 48.00% share.
- Physical Refining held a dominant market position, capturing more than a 61.00% share.
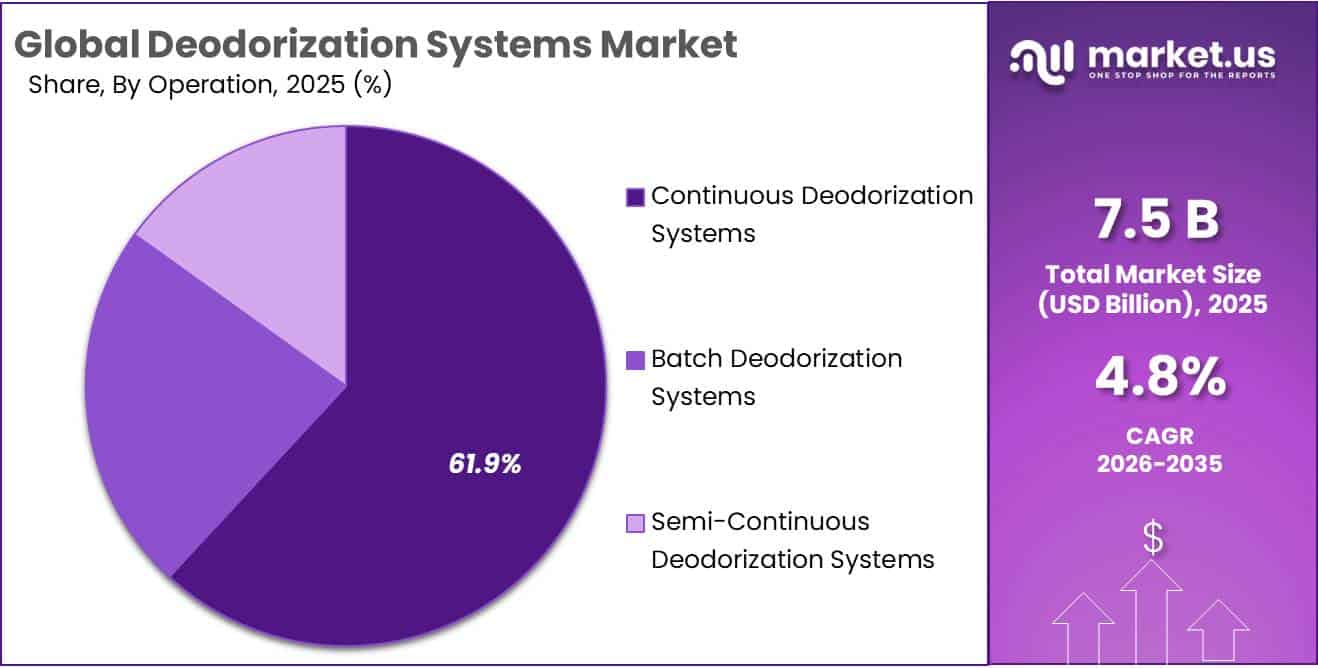
- Continuous Deodorization System held a dominant market position, capturing more than a 61.90% share.
- Palm Oil held a dominant market position, capturing more than a 27.70% share.
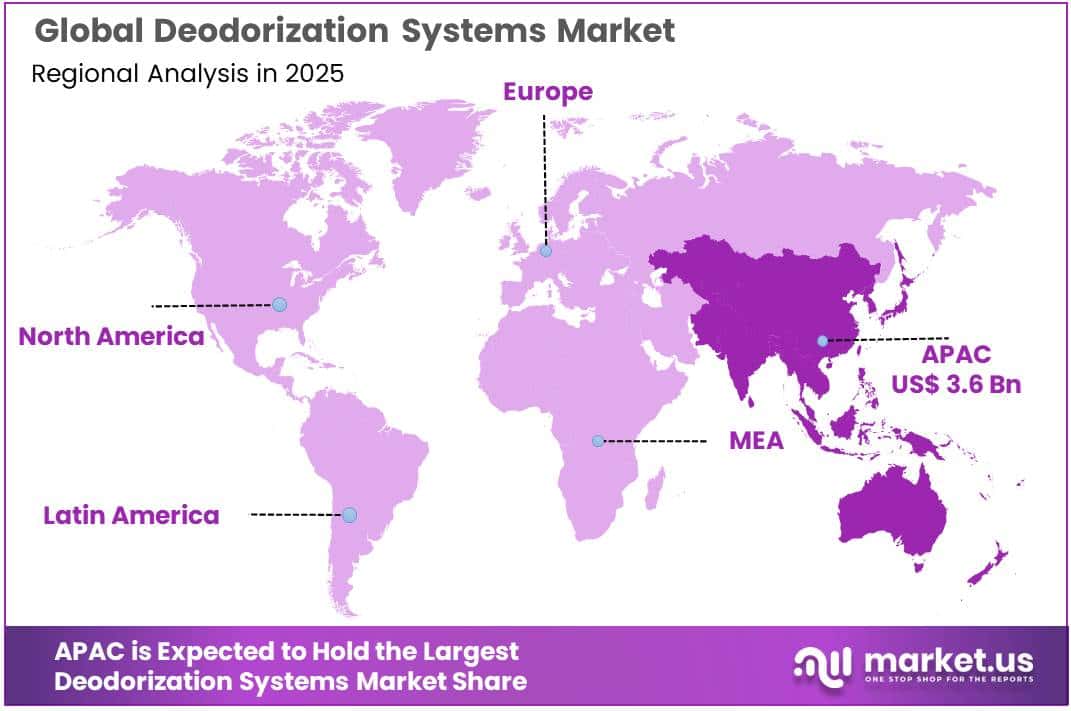
- Asia Pacific held a dominant position in the Deodorization Systems Market, capturing more than a 43.30% share and reaching USD 3.26 billion.
By Component Analysis
Towers dominate with a 26.00% share, supported by efficient steam stripping and continuous oil refining
In 2025, “Towers” held a dominant market position, capturing more than a 26.00% share. Towers remain a core component in industrial deodorization systems because they provide the main contact area where heated oil interacts with stripping steam under vacuum. The American Oil Chemists’ Society states that structured packing used in deodorization columns can provide a surface area of around 250–350 m²/m³, helping improve the removal of free fatty acids and unwanted volatile compounds.
Tower-based systems are also gaining importance as refiners move toward larger and more efficient plants. AOCS notes that modern continuous deodorizers can process more than 1,500 metric tons per day, while operating at typical temperatures of 230–260°C. Alfa Laval also reports that industrial deodorization columns generally operate at around 220–260°C, with separate stripping and retention sections designed to remove volatile compounds and improve oil stability.
“Pumps” remain an important component of deodorization systems because they support oil circulation, vacuum generation, condensate handling and controlled transfer between heating, stripping and cooling stages. Modern edible-oil deodorization generally operates under very low pressure, making reliable pumping systems essential for maintaining process stability. According to the American Oil Chemists’ Society, industrial deodorization typically operates at 1.5–5 mbar, while the most common range is around 2–4 mbar.
By Technology Analysis
Packed Column leads with a 48.00% share, supported by high stripping efficiency and lower heat exposure
In 2025, “Packed Column” held a dominant market position, capturing more than a 48.00% share. Packed-column technology is widely used in edible-oil deodorization because it creates a large contact surface between the oil and stripping steam. The American Oil Chemists’ Society states that structured packing in deodorization columns can provide a surface area of around 250–350 m²/m³.
Packed columns also help processors reduce unnecessary thermal exposure. AOCS notes that most edible oils are normally deodorized at around 230–260°C, while industrial deodorizer vaporization efficiency generally ranges between 0.3 and 0.7 depending on equipment design. Packed columns can be combined with dual-temperature processing to provide strong stripping at higher temperatures while limiting the total time that oil remains under severe heat.
“Thin Film” technology is gaining attention in deodorization systems because it exposes oil as a very thin layer under vacuum, creating efficient contact with stripping steam while limiting processing time. This design is useful for oils that are sensitive to prolonged heating. The American Oil Chemists’ Society notes that conventional deodorization commonly operates above 200°C and at pressures of around 2–5 torr.
By Refining Method Analysis
Physical Refining leads with a 61.00% share as refiners combine deacidification and deodorization in one high-efficiency stage
In 2025, “Physical Refining” held a dominant market position, capturing more than a 61.00% share. Physical refining is widely used in deodorization systems because free fatty acids are removed directly during the deodorization stage instead of through a separate caustic-neutralization step. The American Oil Chemists’ Society explains that physical refining mainly removes free fatty acids through steam stripping under vacuum, with deodorization generally operating at 160–260°C and 1.5–5 mbar pressure.
Government data also points to a strong processing environment. In its April 2026 global outlook, the U.S. Department of Agriculture reported that global oilseed crushing increased due to higher sunflowerseed crushing in Argentina, Ukraine and Kazakhstan, while global vegetable-oil trade was also revised upward. USDA’s July 2026 report continued to track global production, crushing, consumption and trade across soybean, rapeseed, sunflower, palm and other major oils.
“Chemical Refining” continues to hold an important position in deodorization systems because it removes free fatty acids through alkaline neutralization before the oil reaches the deodorizer. According to the American Oil Chemists’ Society, the process normally uses sodium hydroxide to convert free fatty acids into soap, followed by centrifugation, washing, bleaching and deodorization. After the primary centrifuge, chemically refined oil can still contain around 300 ppm of soap and about 10 ppm of phosphorus, which must be reduced further before final deodorization.
By Operation Analysis
Continuous Deodorization System leads with a 61.90% share as large refiners prioritize steady throughput and heat recovery
In 2025, “Continuous Deodorization System” held a dominant market position, capturing more than a 61.90% share. Continuous systems remain widely preferred in large edible-oil refineries because they can process a steady stream of oil with controlled heating, stripping, deodorization and cooling. The American Oil Chemists’ Society states that continuous deodorizers are generally the preferred option for high-capacity plants operating with a consistent feedstock. Modern units can handle more than 1,500 metric tons per day, making them suitable for large soybean, palm, rapeseed and sunflower-oil refining operations.
Continuous operation also provides an important energy advantage. According to AOCS, heat recovery of up to 85% can be achieved when incoming bleached oil is preheated using hot deodorized oil. Industrial deodorization generally operates between 160°C and 260°C, under pressures of around 1.5–5 mbar, making energy recovery and stable vacuum control important for lowering operating costs.
“Batch Deodorization Systems” continue to serve an important role in edible-oil processing where plants handle smaller production runs, specialty oils or frequent changes in feedstock. Unlike continuous lines, batch systems allow temperature, pressure, stripping-steam flow and processing time to be adjusted for each individual batch. The American Oil Chemists’ Society notes that batch deodorization remains suitable for plants processing less than 50 tons per day, particularly where product flexibility is more important than maximum throughput.
By Edible Oil Analysis
Palm Oil leads with a 27.70% share as large refining volumes support intensive deodorization demand
In 2025, “Palm Oil” held a dominant market position, capturing more than a 27.70% share. Palm oil requires intensive refining because crude palm oil contains free fatty acids, pigments, moisture and other impurities that must be removed before food use. The American Oil Chemists’ Society notes that palm oil is commonly physically refined and is typically deodorized at around 260°C.
Palm-oil refining also places high demands on operating control. AOCS indicates that physical refining of palm oil commonly uses deodorization temperatures of 250–270°C and pressures of around 3–5 torr. Modern processors are increasingly trying to reduce thermal load because excessive heat can promote glycidyl ester formation.
“Soybean Oil” remains an important application area for deodorization systems because the refining process must remove residual free fatty acids, volatile compounds and unwanted flavours while protecting oil quality. The American Oil Chemists’ Society states that soybean and canola oils generally require deodorization residence times of around 20–90 minutes. Most edible oils are processed at approximately 230–260°C, although refiners are increasingly reducing heat load to limit the formation of trans fatty acids and other thermal degradation products.
Key Market Segments
By Component
- Pumps
- Towers
- Coolers
- Oil-Management Systems
- Tanks
- Heaters and Heat Exchangers
- Vacuum Systems
- Others
By Technology
- Thin Film
- Packed Column
- Vacuum and Steam Systems
By Refining Method
- Physical Refining
- Chemical Refining
By Operation
- Batch Deodorization Systems
- Semi-Continuous Deodorization Systems
- Continuous Deodorization Systems
By Edible Oil
- Palm Oil
- Soybean Oil
- Sunflower Oil
- Canola/Rapeseed Oil
- Coconut Oil
- Cottonseed Oil
- Other Edible Oils
Driver Analysis
Wastewater Build-Out and Urban Capacity Expansion
Wastewater infrastructure is the largest addressable-volume driver because every new or expanded headworks, pumping station, sludge-handling line, anaerobic digester and septage facility creates identifiable odor capture and treatment points. In 2024, only 56% of the world’s 332 billion m³ of domestic wastewater was safely treated, leaving a large physical treatment gap, while global urbanization is projected to add about 2.5 billion urban residents by 2050, nearly 90% of them in Asia and Africa.
Near-term procurement is supported by funded pipelines rather than population growth alone: the U.S. EPA identifies $630.1 billion of clean-water infrastructure need through 2041, with roughly 55% tied to wastewater infrastructure, and its WIFIA notices made about $7.05 billion available for water systems; India’s AMRUT 2.0 framework allocates ₹27,600 crore of central support to sewerage and septage and requires at least five years of project O&M funding, while China’s program targeted 12 million m³/day of additional sewage-treatment capacity and 45,000 km of collection-network expansion by 2025.
The commercial effect is a shift from stand-alone odor units toward bundled design-build-operate packages covering source enclosure, ducting, scrubber or biofilter trains, chemical dosing, sensors and multiyear media/chemical replacement; this enlarges revenue per site and improves aftermarket visibility. APAC contributes the highest greenfield unit volumes, whereas North America and Europe generate higher-value rehabilitation orders for corrosion-resistant FRP ducting, redundant treatment trains, lower-energy fans and digital compliance reporting.
Drivers Impact Analysis
| Driver | (~) % Impact on CAGR Forecast | Geographic Relevance | Impact Timeline |
|---|---|---|---|
| Wastewater build-out | +1.5 pp | APAC core; North America; EU; MENA | Short term (≤2 years) |
| Tighter odor and air rules | +1.3 pp | EU core; North America; Japan; South Korea | Short term (≤2 years) |
| Rising waste and landfill control | +1.2 pp | APAC; Latin America; North America; EU | Medium term (2–4 years) |
| H2S safety and asset protection | +1.0 pp | Global; municipal and industrial sites | Short term (≤2 years) |
| Low-OPEX biological systems | +0.8 pp | EU; North America; APAC urban clusters | Medium term (2–4 years) |
| Sensor-led service models | +0.7 pp | North America; EU; China; Japan; GCC | Long term (≥4 years) |
Restraint Analysis
Capital Constraints and Infrastructure Funding Gaps
Odor control is commonly packaged as an ancillary environmental line item rather than the hydraulic core of a wastewater or waste project, making covers, ducting, standby fans, polishing carbon and continuous monitoring vulnerable when public owners rebalance budgets. In the United States alone, EPA’s latest assessment identifies $630 billion of clean-water infrastructure need over 20 years—about 45% above the prior assessment—while a 2026 policy briefing estimated 2024 wastewater and stormwater capital need at $99 billion against only about $30 billion funded, leaving a $69 billion annual gap.
The mismatch is sharper in emerging cities: World Bank analysis of Indian urban water and sanitation systems found average O&M recovery through user charges of 72%, versus a 120% sustainability benchmark, with many small and medium cities recovering less than 50%; constrained utilities therefore prioritize pumps, biological treatment and discharge compliance before fence-line odor performance. Even where finance is available, the $630 billion U.S. need substantially exceeds the roughly $13 billion wastewater-and-stormwater allocation identified under the Bipartisan Infrastructure Law, illustrating why grant rounds and debt capacity determine ordering cadence.
Strategically, this promotes scope deletion, single-stage equipment instead of redundant hybrid trains, lower bid specifications and deferred monitoring; it also pushes vendors toward leasing, chemical-service contracts and design-build-operate structures, but those models transfer credit and performance risk onto suppliers. The result is an estimated -0.9 percentage-point drag on 2026–2031 CAGR, concentrated in short-term municipal awards across APAC, Latin America and Africa and in smaller North American utilities, with private food, chemicals and pharmaceuticals less exposed because odor control protects operating permits and community acceptance.
Restraint Impact Analysis
| Restraint | (~) % Impact on CAGR Forecast | Geographic Relevance | Impact Timeline |
|---|---|---|---|
| Capital and funding gaps | -0.9 pp | APAC core; North America; Latin America; Africa | Short term (≤2 years) |
| High lifecycle costs | -0.7 pp | EU; North America; Japan; import-led APAC | Medium term (2–4 years) |
| Fragmented odor standards | -0.6 pp | North America; EU; APAC; Latin America | Long term (≥4 years) |
| Tender and project delays | -0.5 pp | APAC; Latin America; Africa; municipal EU | Short term (≤2 years) |
| Performance and footprint limits | -0.4 pp | Dense cities; cold/arid zones; variable-load plants | Medium term (2–4 years) |
| Operator and skills shortages | -0.3 pp | North America core; EU; Japan; rural APAC | Long term (≥4 years) |
Opportunity Analysis
Odor-Control-as-a-Service and Performance Contracting
Performance-based contracting is already established in adjacent water services: World Bank evidence indicates private PBCs were 68% more effective at reducing non-revenue water than utility-only programs, while model contracts use a relatively small fixed fee plus a larger recurring incentive linked to maintained outcomes over five to seven years.
Deodorization vendors can transpose that structure into a package combining equipment financing, media and chemicals, calibration, remote diagnostics, emergency call-out and guaranteed outlet concentration, thereby bypassing the customer’s upfront-CapEx constraint and turning episodic replacement revenue into contracted annual recurring revenue. The labor case is immediate—roughly one-third of the U.S. water workforce is eligible to retire within a decade—yet most odor-control suppliers still monetize hardware, commissioning and consumables separately rather than assuming plant-level outcomes.
Under an analyst scenario in which service penetration reaches 15% of addressable new systems by 2031, a seven-year contract captures roughly 2.5–3.5 times the first-year equipment revenue over its term, raises recurring revenue to 25–35% of a participating vendor’s mix and can expand gross margin by 4–7 percentage points after remote-support scale is achieved; downside protection requires minimum airflow/loading bands, indexed chemical pass-throughs and shared savings above the guaranteed baseline.
This is therefore an estimated +1.1-point CAGR opportunity rather than a current driver: the installed need already exists, but realizing the upside depends on suppliers developing financing capacity, risk-pricing algorithms, telemetry and contract-enforcement capabilities that the conventional design-build model does not provide.
Opportunity Impact Analysis
| Opportunity | (~) % Potential CAGR Upside | Geographic Relevance | Execution Window |
|---|---|---|---|
| Odor-control-as-a-service | +1.1 pp | North America; EU; GCC; advanced APAC | Short term (≤2 years) |
| Biomethane gas-cleaning adjacency | +0.9 pp | EU core; North America; China; India | Medium term (2–4 years) |
| Digital odor-intelligence SaaS | +0.7 pp | EU; North America; Japan; South Korea | Short term (≤2 years) |
| Mid-market livestock modules | +0.6 pp | EU; North America; Brazil; East Asia | Medium term (2–4 years) |
| Emerging-market modular platforms | +0.6 pp | India; Southeast Asia; Africa; Latin America | Medium term (2–4 years) |
| Circular media take-back | +0.4 pp | EU; North America; Japan; South Korea | Long term (≥4 years) |
Challenges Analysis
Measurement Standardization Gap
The industry lacks a universally comparable performance currency because H2S or NH3 ppm measures individual compounds, dynamic olfactometry measures human detection after dilution, sensors infer patterns, and dispersion models translate emissions into receptor exposure; EN 13725 defines source odor concentration in ouE/m³ but does not by itself measure ambient odor at the community receptor. Measurement uncertainty remains actively debated even under EN 13725, and the 2022 revision required a reworked uncertainty calculation that prompted an inter-laboratory exercise involving 12 accredited laboratories and 20 samples per laboratory from a sludge-drying source.
For vendors, this creates 5–15% engineering and contingency allowances in complex bids, repeated baseline and acceptance testing, disputes where a system achieves 99% H2S removal but residual mercaptans remain perceptible, and limited portability of a reference installation from one jurisdiction to another; newer e-noses also require recalibration because even advanced agricultural systems reported 0.18%/day baseline drift, less than 8% sensitivity variation over 180 days and a three-to-four-month recalibration cycle.
Mitigation requires dual guarantees—compound-specific removal plus receptor-oriented odor criteria—standard sampling plans, accredited laboratory chains, sensor co-location and probabilistic acceptance bands, but harmonization across regulators and end markets will exceed four years, creating an estimated -0.6-point ongoing CAGR friction through slower sales cycles and higher warranty reserves rather than eliminating demand.
Challenges Impact Analysis
| Challenge | (~) % CAGR Friction Drag | Geographic Relevance | Mitigation Horizon |
|---|---|---|---|
| Variable Odor Loading | -0.8 pp | Global; wastewater; waste; livestock | Long term (≥4 years) |
| Measurement Standardization Gap | -0.6 pp | EU hubs; North America; APAC | Long term (≥4 years) |
| Consumables Supply Volatility | -0.5 pp | APAC–EU corridors; North America | Medium term (2–4 years) |
| Legacy Digital Integration | -0.5 pp | North America; EU; Japan; GCC | Medium term (2–4 years) |
| Skilled Service Capacity | -0.4 pp | North America; EU; Japan; rural APAC | Long term (≥4 years) |
| Climate-Sensitive System Design | -0.3 pp | Hot-humid APAC; GCC; cold regions | Long term (≥4 years) |
Geopolitical Impact Analysis
Middle East and Black Sea Conflicts Reshape Deodorization Systems Demand
The war environment is adding cost and supply-chain pressure across the Deodorization Systems market, mainly through energy prices, shipping risk and edible-oil trade disruption. The Russia–Ukraine war continues to affect Black Sea agricultural flows, while the 2026 Middle East conflict has increased uncertainty around fuel and maritime transport.
UN Trade and Development reported that the Strait of Hormuz carries around one-quarter of global seaborne oil trade, and disruption pushed Brent crude above $90 per barrel. Higher fuel, insurance and freight costs raise the delivered price of stainless steel, pumps, vacuum equipment, heat exchangers and other components used in deodorization plants.
The impact is visible on edible-oil processors. The World Bank expects the food commodity price index to rise 2.5% in 2026, with energy and fertilizer costs creating additional upside risk. Refiners therefore face pressure to improve heat recovery, reduce steam demand and avoid production losses.
This environment supports investment in continuous deodorization, efficient vacuum systems and process automation. At the same time, delayed projects and expensive imported equipment may restrain smaller refiners. Geopolitical risk is therefore shifting purchasing decisions toward energy-efficient systems, regional sourcing and stronger spare-parts security.
Regional Insights
Asia Pacific Leads the Deodorization Systems Market with 43.30% Share Valued at USD 3.26 Billion
In 2025, Asia Pacific held a dominant position in the Deodorization Systems Market, capturing more than a 43.30% share and reaching USD 3.26 billion. The region benefits from its large edible-oil processing base, particularly palm, soybean and other vegetable oils.
USDA data for 2025/26 shows Indonesia producing 46.7 million metric tons of palm oil, Malaysia producing 20.2 million metric tons, and Thailand producing 3.9 million metric tons. Together, these countries create substantial demand for continuous deodorization, vacuum systems, stripping columns and heat-recovery equipment used in large refining plants.
North America represents a rapidly expanding opportunity for deodorization equipment as soybean crushing capacity increases. USDA forecasts U.S. soybean crush at a record 2.75 billion bushels in 2026/27, nearly 5% above the revised 2025/26 level. Domestic soybean-oil demand is projected to grow 10%, encouraging investment in additional crushing and downstream refining infrastructure.
Higher oil output supports demand for continuous deodorizers, packed columns, vacuum pumps and heat-recovery systems, particularly in integrated soybean-processing plants seeking higher efficiency and consistent refined-oil quality.
Key Regions and Countries Insights
- North America
- US
- Canada
- Europe
- Germany
- France
- The UK
- Spain
- Italy
- Rest of Europe
- Asia Pacific
- China
- Japan
- South Korea
- India
- Australia
- Rest of APAC
- Latin America
- Brazil
- Mexico
- Rest of Latin America
- Middle East & Africa
- GCC
- South Africa
- Rest of MEA
Key Players Analysis
Alfa Laval is a major supplier of edible-oil refining and deodorization equipment, with strength in heat transfer, separation and fluid handling. In 2025, the company generated sales of SEK 69.6 billion, operated in around 100 countries, and employed more than 23,670 people. Its deodorization systems support heat recovery, vacuum operation and continuous processing for vegetable oils.
Desmet is a specialized engineering supplier for oils, fats, food, feed and biofuel processing. The company reports more than 1,000 employees, 16 fully owned offices, over 28,000 plants and process sections, and annual turnover above €400 million. Its Qualistock+ continuous deodorizer is offered in standard capacities from 50 to 3,000 tonnes per day, while its Multistock semi-continuous system can handle multiple feedstock changes and capacities up to 1,500 tonnes per day.
GEA Group serves food, beverage and pharmaceutical processors with advanced machinery, components and process systems. In 2025, GEA reported revenue of €5.495 billion, order intake of €5.924 billion, and an EBITDA margin before restructuring expenses of 16.5%. The company employed 18,628 FTEs at year-end, while total workforce reached 19,531 FTEs. Its process-engineering expertise in evaporation, heat transfer, separation and hygienic processing supports applications relevant to edible-oil refining and deodorization plant integration.
Top Key Players Outlook
- Alfa Laval AB
- Desmet
- GEA Group Aktiengesellschaft
- Crown Iron Works Company
- Andreotti Impianti S.p.A.
- Myande Group Co., Ltd.
- HUM Oil & Fat Technologies
- DVC Process Technologists Pvt. Ltd.
- Kumar Metal Industries Pvt. Ltd.
- Gianazza International S.p.A.
- ChemSta Machinery Co., Ltd.
- Mectech Process Engineers Pvt. Ltd.
- Tinytech Plants
- Zhengzhou QI’E Grain and Oil Machinery Co., Ltd.
- Zhengzhou Sunshine Machinery Co., Ltd.
Recent Developments
- In 2026, Andreotti continued promoting its refining and processing technologies internationally, including participation at OFI 2026, supporting wider commercial expansion. The company, founded in 1955, states that its engineering technologies have been applied across more than 1,000 industrial plants worldwide.
- In August 2026, Myande commissioned a new corn-oil refining line for Jilin Xuxin Oils & Fats with 800 TPD rated capacity and up to 1,000 TPD maximum capacity, integrating cold refining, nano-cavitation, variable-temperature deodorization and intelligent process control.
Report Scope
| Report Features | Description |
|---|---|
| Market Value (2025) | USD 7.5 Bn |
| Forecast Revenue (2035) | USD 12.0 Bn |
| CAGR (2026-2035) | 4.8% |
| Base Year for Estimation | 2025 |
| Historic Period | 2020-2024 |
| Forecast Period | 2026-2035 |
| Report Coverage | Revenue Forecast, Market Dynamics, Competitive Landscape, Recent Developments |
| Segments Covered | By Component (Pumps, Towers, Coolers, Oil-Management Systems, Tanks, Heaters and Heat Exchangers, Vacuum Systems, Others), By Technology (Thin Film, Packed Column, Vacuum and Steam Systems), By Refining Method ( Physical Refining, Chemical Refining), By Operation (Batch Deodorization Systems, Semi-Continuous Deodorization Systems, Continuous Deodorization Systems), By Edible Oil (Palm Oil, Soybean Oil, Sunflower Oil, Canola/Rapeseed Oil, Coconut Oil, Cottonseed Oil, Other Edible Oils) |
| Regional Analysis | North America – US, Canada; Europe – Germany, France, The UK, Spain, Italy, Rest of Europe; Asia Pacific – China, Japan, South Korea, India, Australia, Singapore, Rest of APAC; Latin America – Brazil, Mexico, Rest of Latin America; Middle East & Africa – GCC, South Africa, Rest of MEA |
| Competitive Landscape | Alfa Laval AB, Desmet, GEA Group Aktiengesellschaft, Crown Iron Works Company, Andreotti Impianti S.p.A., Myande Group Co., Ltd., HUM Oil & Fat Technologies, DVC Process Technologists Pvt. Ltd., Kumar Metal Industries Pvt. Ltd., Gianazza International S.p.A., ChemSta Machinery Co., Ltd., Mectech Process Engineers Pvt. Ltd., Tinytech Plants, Zhengzhou QI’E Grain and Oil Machinery Co., Ltd., Zhengzhou Sunshine Machinery Co., Ltd. |
| Customization Scope | Customization for segments, region/country-level will be provided. Moreover, additional customization can be done based on the requirements. |
| Purchase Options | We have three licenses to opt for: Single User License, Multi-User License (Up to 5 Users), Corporate Use License (Unlimited User and Printable PDF) |





































