


Report Overview
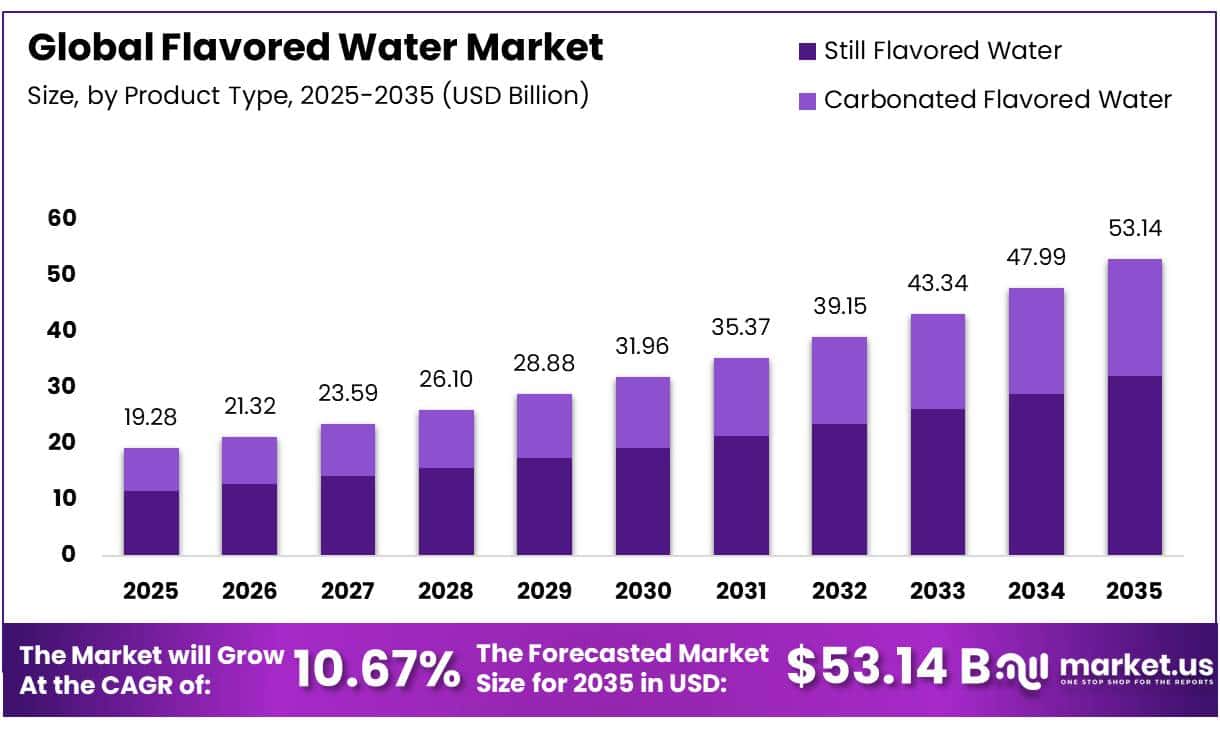
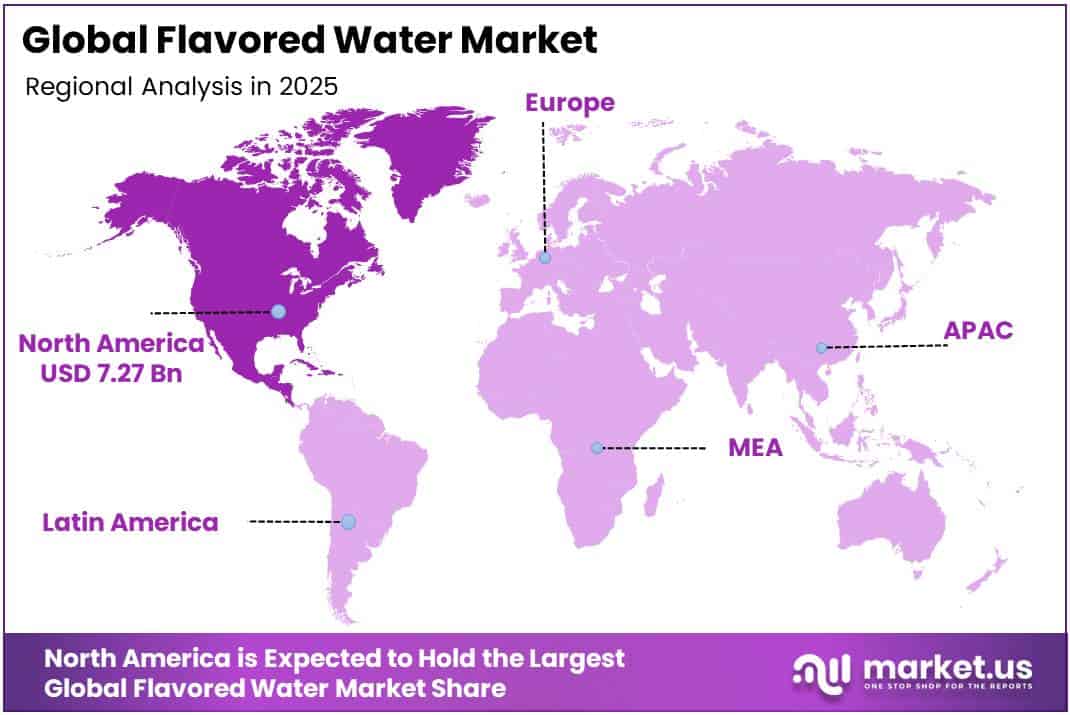
In 2025, the Global Flavored Water Market was valued at US$19.28 billion, and between 2026 and 2035, this market is estimated to register a CAGR of 10.67%, reaching about US$53.14 billion by 2035. In 2025, North America led the market, achieving over 37.7% share with a revenue of US$7.27 Billion.
Flavored water occupies a strategic position between plain bottled water, carbonated soft drinks, and functional beverages. The category includes still or sparkling water enhanced with fruit, botanical, vitamin, mineral, or electrolyte ingredients, with products ranging from unsweetened formulations to lightly sweetened variants. Its industrial relevance is supported by a broad production base.
- In December 2024, according to the U.S. Geological Survey, the national beverage inventory identified 10,192 facilities producing bottled water as a primary or secondary line and 1,696 soft-drink manufacturing facilities, indicating substantial infrastructure that can support flavor extensions, contract packing, and regional distribution.
Key Takeaways
- The Global Flavored Water Market was valued at US$19.28 billion in 2025.
- The market is projected to grow at a CAGR of 10.67% and is estimated to reach US$53.14 billion by 2035.
- On the basis of product type, still flavored water dominated the market, constituting 4% of the total market share.
- Based on the packaging type, bottles dominated the flavored water market, with a substantial market share of around 3%.
- Based on the distribution channel, supermarkets & hypermarkets led the market, comprising 8% of the total market.
- Based on the flavor type, fruit-based dominated the market, constituting 3% of the total market share.
- In 2025, North America was the most dominant region in the flavored water market, accounting for 7% of the total global consumption.
Demand is increasingly shaped by public-health guidance favoring water and lower-sugar drinks.
- In December 2025, according to the Scientific Foundation for the Dietary Guidelines for Americans 2025–2030, plain drinking water was recommended as the primary beverage, while water flavored with a small amount of 100% fruit juice was recognized as a potentially healthy option. The final guidelines also advised avoiding sugar-sweetened beverages and stated that one meal should contain no more than 10 grams of added sugar.
These recommendations strengthen opportunities for transparent, unsweetened, and naturally flavored products rather than water positioned mainly as a sugary refreshment. Hydration demand continues to provide a strong commercial base for flavored water producers.
- In May 2026, according to the International Bottled Water Association, Americans consumed an average of 7 gallons of bottled water per person during 2025, equal to approximately 380 bottles of 16.9 ounces each.
The figures show that water remains firmly established in daily beverage consumption, creating favorable conditions for flavored still water, sparkling water, and functional hydration products. Manufacturers can build on this established demand by offering unsweetened fruit flavors, botanical combinations, electrolyte formulations, and convenient single-serve packaging that provides greater taste variety without the high sugar content commonly associated with traditional soft drinks. Cost pressure and packaging regulation are reshaping the operating environment.
- In April 2026, according to the U.S. Department of Agriculture Economic Research Service, U.S. nonalcoholic beverage prices increased 8% during 2025. Meanwhile, European Union rules require PET beverage bottles to contain 25% recycled plastic from 2025, alongside a 77% separate-collection target for plastic bottles, rising to 90% by 2029. This environment encourages lightweight packaging, recycled-content procurement, concentrated flavor systems, efficient filling lines, and stronger supplier contracts.
Future growth is likely to come from zero-added-sugar flavors, botanical profiles, electrolyte hydration, premium sparkling variants, and recyclable or reusable packaging.
- In July 2025, the World Health Organization launched its “3 by 35” initiative, urging countries to raise real prices on sugary drinks and other harmful products by at least 50% by 2035.
In 2026, the U.S. Food and Drug Administration also continued work on front-of-package nutrition labeling, which could encourage reformulation. Companies combining enjoyable taste, credible ingredient claims, regulatory compliance, and packaging circularity are therefore positioned to capture demand across retail, workplaces, travel, fitness, and hospitality channels more effectively.
Product Type Analysis
Still Flavored Water leads with over 60.4% share due to its smooth and convenient hydration appeal
In 2025, Still Flavored Water held a dominant market position, capturing more than a 60.4% share. The segment remained ahead because its non-carbonated format offers a smooth drinking experience suitable for regular hydration throughout the day. Consumers increasingly prefer still flavored water when they want more taste than plain water without the heaviness or sharp mouthfeel associated with fizzy drinks. Fruit flavors, botanical blends, zero-sugar formulations and functional ingredients also allow manufacturers to target different consumer groups. In March 2026, the Centers for Disease Control and Prevention identified plain or unsweetened flavored water as an alternative to sugary and energy drinks, supporting the segment’s health-focused positioning.
- In March 2026, according to the CDC, around 30% of Americans aged two years and above consumed high amounts of added sugar, representing more than 15% of their daily calorie intake. This supports demand for unsweetened and low-sugar still flavored water.
Carbonated Flavored Water is the fastest-growing segment. In 2025, the segment gained momentum as consumers looked for beverages that deliver flavour and carbonation while maintaining a lighter image than conventional soft drinks. Its crisp texture makes it suitable for mealtimes, social occasions and everyday refreshment. Demand is also supported by zero-sugar varieties, natural fruit flavours, premium botanical combinations, portable cans and convenient multipacks. Carbonated flavored water is particularly attractive to consumers who are reducing sugary beverage intake but still want the familiar sensation of fizz.
Packaging Type Analysis
Bottles dominate with a 55.3% share due to convenience and strong retail acceptance
In 2025, Bottles held a dominant market position, capturing more than a 55.3% share of the flavored water market by packaging type. Their leadership was supported by easy handling, secure sealing, longer product protection, and suitability for supermarkets, convenience stores, vending machines, gyms, and online delivery. Plastic and glass bottles also allowed manufacturers to offer flavored water in different sizes while providing sufficient space for branding, nutritional information, and flavor identification.
- In January 2025, according to the UK Government, consumers across England, Northern Ireland, and Scotland purchased an estimated 30 billion single-use beverage containers annually, including 12 billion plastic beverage bottles. And approximately 5 billion bottles and cans were discarded rather than recycled each year, encouraging greater use of recyclable bottle designs and deposit-return systems.
Cartons and pouches are the fastest-growing segment in the flavored water market by packaging type. Growth is supported by rising interest in lightweight, portable, and space-efficient packaging formats. Pouches require less storage space during transportation and are suitable for single-serve products, children’s beverages, outdoor activities, and sports consumption. Cartons are also gaining attention because they offer broad printable surfaces, convenient stacking, and protection from light and outside contamination. Manufacturers are increasingly examining these formats to reduce packaging weight, improve transportation efficiency, and introduce differentiated products.
Distribution Channel Analysis
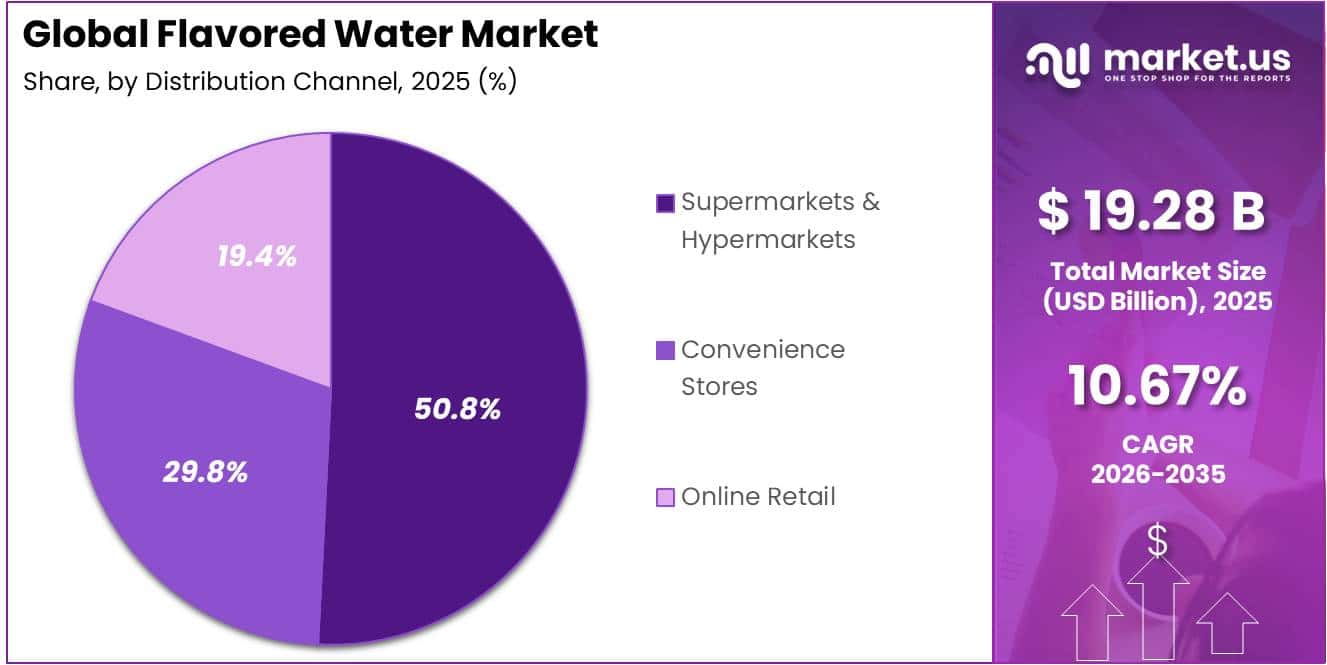
Supermarkets & Hypermarkets lead with a 50.8% share, supported by broad product choice and frequent promotions.
In 2025, Supermarkets & Hypermarkets held a dominant market position, capturing more than a 50.8% share. The segment remained the leading distribution channel because these stores provide a wide selection of flavored water brands, flavors, pack sizes, and price ranges in one location. Dedicated beverage aisles, refrigerated displays, multipack offers, and regular discounts improve product visibility and encourage both planned and impulse purchases. Their strong customer traffic and ability to stock established as well as newly launched products also help flavored water companies reach a broader consumer base.
- In June 2026, according to the U.S. Department of Agriculture’s Economic Research Service, food-at-home expenditure in the United States reached USD 1.10 trillion in 2025, highlighting the large amount consumers continued to spend through grocery-oriented retail channels.
Convenience Stores are the fastest-growing segment in the flavored water market. Growth is being supported by consumers seeking quick access to refreshing, portable, and ready-to-drink products during travel, work breaks, and daily commutes. These stores commonly place single-serve flavored water bottles in refrigerated cabinets near checkout areas, increasing visibility and encouraging immediate consumption. Extended operating hours, accessible locations, faster checkout, and the growing preference for lower-sugar alternatives to traditional soft drinks are also helping convenience stores strengthen their role in flavored water distribution.
Flavor Type Analysis
Fruit-Based Flavors Lead with 60.3% Share Due to Familiar Taste and Broad Consumer Appeal
In 2025, Fruit-Based held a dominant market position, capturing more than a 60.3% share. The segment remained strong because flavors such as lemon, orange, apple, berry, mango, and mixed fruit were already familiar to consumers. These flavors helped manufacturers offer water products that felt refreshing, light, and suitable for regular hydration. Fruit-based varieties also worked well with low-sugar and zero-sugar recipes, allowing brands to attract health-conscious buyers without losing taste appeal. During 2025, companies expanded tropical, citrus, and blended-fruit combinations while using clear fruit images and simple ingredient descriptions on packaging. Their broad acceptance across supermarkets, convenience stores, fitness outlets, offices, and online platforms continued to support frequent purchases.
- In December 2025, according to the U.S. Department of Agriculture’s Economic Research Service, the average U.S. consumer consumed only 9 cups of fruit per day, compared with the recommended 2 cups. This consumption gap supports continued consumer familiarity with fruit-related positioning.
Electrolyte-Infused and Vitamin-Enhanced is the fastest-growing segment. In 2026, the segment is gaining attention as consumers increasingly choose hydration products that provide benefits beyond basic flavor. These drinks are being positioned for workouts, travel, outdoor activities, workplace use, and everyday wellness, expanding their appeal beyond traditional sports users. Manufacturers are combining minerals and vitamins with fruit flavors to improve taste while keeping sugar and calorie levels controlled. Portable bottles, clear functional claims, and convenient single-serving formats are also strengthening product visibility. The development of lighter citrus, berry, and tropical varieties is helping reduce the strong medicinal taste often associated with functional beverages, making these products more suitable for regular consumption.
Key Market Segments
By Product Type
- Still Flavored Water
- Carbonated Flavored Water
By Packaging Type
- Bottles
- PET Bottles
- Glass Bottles
- Cans
- Others
- Cartons
- Pouches
By Distribution Channel
- Supermarkets & Hypermarkets
- Convenience Stores
- Online Retail
By Flavor Type
- Fruit-Based
- Citrus
- Berry
- Herbal / Botanical
- Others
- Electrolyte-Infused
- Vitamin-Enhanced
Driver Analysis
Sugar-tax policy expansion
The UK Soft Drinks Industry Levy applies 18p per litre for drinks with 5–8g sugar per 100ml and 24p per litre above 8g, and from 1 January 2026 the exemption threshold drops from 5g to 4.5g sugar per 100ml while the minimum milk content required for dairy-based drink exemption falls from 75ml to 50ml per 100ml, pulling more borderline beverages into the levy.
Since the levy’s 2018 introduction, the proportion of drinks over the sugar threshold fell from 49% to 15%, demonstrating how quickly manufacturers reformulate once a fiscal trigger is set; a 330ml regular soda at 8g/100ml faces roughly 6.3p of direct levy exposure at the higher band, while an equivalent zero-sugar flavored water pays none, creating a structural retail-price gap of 15–25% in many markets once the levy is passed through.
Drivers Impact Analysis
| Driver | (~) % Impact on CAGR Forecast | Geographic Relevance | Impact Timeline |
|---|---|---|---|
| Sugar-tax policy expansion | +2.0 pp | UK, EU, LATAM, North America, GCC | Short term (≤ 2 years) |
| Functional hydration demand | +1.7 pp | North America, EU, APAC urban markets | Medium term (2-4 years) |
| Soda substitution shift | +1.5 pp | North America, EU, LATAM | Medium term (2-4 years) |
| Sustainable packaging conversion | +1.2 pp | EU, UK, North America | Medium term (2-4 years) |
| Premium flavor innovation | +1.0 pp | North America, EU, China, GCC | Short term (≤ 2 years) |
| Natural sweetener reformulation | +0.9 pp | EU, North America, APAC | Medium term (2-4 years) |
Restraint Analysis
PET and rPET cost volatility
Virgin PET prices tracked crude-oil and paraxylene volatility through 2024–2025, while EU recycled-content mandates requiring 25% rPET in PET bottles pushed rPET premiums to run 15%–40% above virgin resin in periods of tight food-grade recyclate supply, since food-grade rPET requires specialized decontamination capacity that has not scaled as fast as demand.
For a bottler producing 500 million litres annually in 500ml PET format, a $50-per-tonne resin price swing can move annual packaging cost by roughly $2–4 million, a swing that is difficult to pass through given intense private-label and multi-pack price competition at retail.
This volatility delays capital commitments to new filling-line capacity, forces bottlers to hedge resin purchases 6–12 months forward, and compresses gross margin by an estimated 2–5 percentage points during resin price spikes, particularly hurting smaller regional flavored-water brands that lack the purchasing scale of multinational beverage companies to negotiate fixed-price supply contracts.
Restraint Impact Analysis
| Restraint | (~) % Impact on CAGR Forecast | Geographic Relevance | Impact Timeline |
|---|---|---|---|
| PET and rPET cost volatility | -1.6 pp | Global, EU, North America, APAC | Short term (≤ 2 years) |
| Packaging-compliance cost | -1.4 pp | EU, UK | Medium term (2-4 years) |
| Ingredient reformulation exposure | -1.2 pp | North America, EU | Medium term (2-4 years) |
| Private-label price competition | -1.1 pp | North America, EU, LATAM | Short term (≤ 2 years) |
| Tariff and cross-border friction | -0.9 pp | North America, EU, China | Short term (≤ 2 years) |
| Bottled-water plastic backlash | -0.8 pp | EU, North America, Australia | Long term (≥ 4 years) |
Opportunity Analysis
Refill-and-pod ecosystems
The EU Packaging and Packaging Waste Regulation applies from 12 August 2026, with beverage reuse obligations becoming increasingly relevant toward 2030; it also requires foodservice operators to accept customer-provided containers for takeaway beverages from February 2027 and offer reusable-packaging options from February 2028.
A brand that converts 100,000 high-frequency consumers from two $1.50 bottled purchases per week to a $12–18 monthly pod plan can create $14.4–21.6 million in annual recurring gross sales while avoiding roughly 10.4 million single-use bottles per year; concentrate shipping can reduce delivered mass by 70%–90%, lowering freight, storage, and bottle-handling costs.
The white space is commercially demanding: success requires flavor systems that disperse reliably in 300–750 ml of still or sparkling water, food-safe reusable packaging, recurring-payment retention above approximately 65% after 12 months, retail-compatible trial packs, and disciplined economics around pod recycling or collection; however, it converts packaging regulation and plastic backlash from a volume threat into a defensible consumer-data and replenishment platform.
Opportunity Impact Analysis
| Opportunity | (~) % Potential CAGR Upside | Geographic Relevance | Execution Window |
|---|---|---|---|
| Refill-and-pod ecosystems | +2.1 pp | EU, UK, North America, Japan | Medium term (2-4 years) |
| Hydration-as-a-service | +1.8 pp | North America, EU, GCC, APAC cities | Short term (≤ 2 years) |
| Targeted functional hydration | +1.6 pp | U.S., EU, China, Japan, GCC | Medium term (2-4 years) |
| Foodservice flavor dispensing | +1.4 pp | EU, North America, GCC, ASEAN | Medium term (2-4 years) |
| Local bottling roll-ups | +1.2 pp | India, ASEAN, LATAM, Africa | Long term (≥ 4 years) |
| Digital passport packaging | +1.0 pp | EU core, UK, export suppliers | Medium term (2-4 years) |
Challenges Analysis
Water-source resilience
Water-source resilience is a long-duration operating challenge because flavored water requires consistent potable input quality for the beverage itself, while production additionally consumes water for reverse-osmosis losses, cleaning-in-place, rinsing, cooling, and sanitation; a plant producing 100 million litres annually can require roughly 120–180 million litres of total intake after allowing for a 1.2–1.8 litre water-use ratio.
Nearly 4 billion people experience severe water scarcity for at least one month annually, and the underlying risk is escalating in regions central to bottled-beverage growth, including India, the GCC, the U.S. Southwest, Australia, Mexico, and parts of Latin America. A 10% reduction in licensed withdrawal volume at a 100-million-litre plant can remove 10–18 million litres of annual production capacity or force water trucking, treatment upgrades, and lower-margin contract bottling; even a $0.01-per-litre increase in source-treatment, tanker, or contingency cost creates $1 million of annual margin pressure at that scale.
Mitigation requires multi-source abstraction rights, aquifer-recharge programs, closed-loop cleaning, water-recovery systems, municipal and community engagement, and plant-level monitoring of conductivity, hardness, microbial load, and seasonal drought exposure, but these investments can require $2–10 million per site and several years of permitting before they reduce operational risk.
Challenges Impact Analysis
| Challenge | (~) % CAGR Friction Drag | Geographic Relevance | Mitigation Horizon |
|---|---|---|---|
| Water-source resilience | -1.4 pp | MENA, India, U.S. West, Australia, LATAM | Long term (≥ 4 years) |
| Flavor stability management | -1.2 pp | Global, hot-climate markets | Medium term (2-4 years) |
| rPET supply synchronization | -1.1 pp | EU, UK, North America | Medium term (2-4 years) |
| Multi-market claim compliance | -1.0 pp | EU, U.S., GCC, APAC | Long term (≥ 4 years) |
| Route-to-market economics | -0.9 pp | India, ASEAN, Africa, LATAM | Medium term (2-4 years) |
| Packaging-data integration | -0.7 pp | EU, UK, export suppliers | Medium term (2-4 years) |
Geopolitical Impact Analysis
War-Driven Supply Chains Squeeze the Flavored Water Market
The escalation of geopolitical conflicts in West Asia has sent shockwaves through the global beverage industry, heavily impacting the flavored water market. While consumer demand for low-calorie wellness drinks remains strong, manufacturers face unprecedented production challenges.
The primary pressure point stems from disrupted shipping lanes and soaring oil prices. Higher crude costs have directly triggered price hikes in petrochemicals, making essential plastic bottles, caps, and labels much more expensive. Furthermore, maritime shipping reroutes have led to skyrocketing freight rates, severely compressing profit margins for global beverage brands.
Beyond packaging, the conflict threatens the sourcing of raw agricultural inputs. Disruptions in fertilizer supplies are driving up the cost of natural fruit extracts and syrups used for clean-label flavoring. To survive, regional businesses are altering their logistics models, exploring domestic ingredient alternatives, and rethinking international dependencies. Smaller brands feel the pinch first, often forced to pass cost burdens down the distribution line. Consequently, everyday healthy hydration products are turning into a direct metric of geopolitical endurance.
Regional Analysis
North America Dominates the Flavored Water Market
North America accounted for 37.7% of the global flavored water market in 2025, representing a market value of approximately USD 7.27 billion, making it the largest regional market. The region’s leadership is supported by strong consumer preference for healthier beverage alternatives with low or zero sugar content, along with widespread availability of flavored water products across supermarkets, convenience stores, club stores, and e-commerce channels. The United States remains the primary contributor due to its large functional beverage industry and growing demand for hydration products enriched with vitamins, minerals, and natural fruit flavors.
Asia Pacific is projected to register the fastest growth during the forecast period, driven by rapid urbanization, expanding middle-class populations, and increasing awareness of healthy hydration. Countries including China, Japan, South Korea, and Australia are witnessing rising demand for flavored beverages that offer refreshing taste with reduced sugar content compared to traditional soft drinks. Growing retail modernization and the rapid expansion of online grocery platforms are making flavored water products more accessible across urban and semi-urban consumers.
Key Regions and Countries Covered
- North America
- The US
- Canada
- Europe
- Germany
- France
- The UK
- Spain
- Italy
- Russia & CIS
- Rest of Europe
- APAC
- China
- Japan
- South Korea
- India
- ASEAN
- Rest of APAC
- Latin America
- Brazil
- Mexico
- Rest of Latin America
- Middle East & Africa
- GCC
- South Africa
Rest of MEA
Key Players Analysis
The flavored water market is moderately consolidated with oligopolistic competition, as a limited number of multinational beverage companies account for a significant share of global sales while regional and niche brands continue to compete through product innovation and local distribution. Large companies strengthen their positions through extensive retail networks, premium product portfolios, and investments in low-sugar and functional beverages.
Kraft Heinz Company reported USD 26.6 billion in net sales in 2025, supporting its flavored beverage portfolio through broad retail reach. National Beverage Corp. generated approximately USD 1.2 billion in revenue during FY2025, led by its LaCroix sparkling water brand and strong North American presence. Sanpellegrino S.p.A., part of Nestlé, benefits from Nestlé’s beverage business, with the parent company reporting CHF 91.4 billion in total revenue in 2025, strengthening its premium flavored water business globally. Keurig Dr Pepper Inc. recorded approximately USD 15.6 billion in net sales in 2025, supported by its extensive beverage distribution network and flavored sparkling water offerings. Reed’s, Inc. reported approximately USD 45 million in net sales in 2025, focusing on natural ingredients and premium specialty beverages to maintain its niche position. Collectively, these companies continue expanding production capacity, launching new flavors, and investing in healthier beverage formulations to strengthen their competitive positions in the global flavored water market.
The Major Players in The Industry
- Nestlé S.A.
- The Coca-Cola Company
- PepsiCo, Inc.
- Danone S.A.
- Kraft Heinz Company
- National Beverage Corp.
- Sanpellegrino S.p.A.
- Keurig Dr Pepper Inc.
- Reed’s, Inc.
- Talking Rain Beverage Company
Key Development
- In May 2025, Coca-Cola Company under new product development, the company refreshed the complete vitaminwater packaging range and introduced 2 new products: vitaminwater elevate, a blue raspberry limeade drink with multivitamins, and vitaminwater re-hydrate zero sugar, a pineapple passionfruit drink with electrolytes. It also announced the nationwide return of zero sugar power-c in dragonfruit flavor.
- In April 2025, Nestlé S.A. launched Maison Perrier Chic in the United States, offering four alcohol-free sparkling flavors: Daiqui’red, Piña Fizz, Peach Spritzer and Citrus Fizz. The drinks were developed with a leading French bartender, contained 30 calories or less per can and carried a suggested price of USD 5.99 for a four-can pack.
Report Scope
| Report Features | Description |
|---|---|
| Market Value (2025) | US$19.28 Bn |
| Forecast Revenue (2035) | US$53.14 Bn |
| CAGR (2026-2035) | 10.67% |
| Base Year for Estimation | 2025 |
| Historic Period | 2020-2024 |
| Forecast Period | 2026-2035 |
| Report Coverage | Revenue Forecast, Market Dynamics, Competitive Landscape, Recent Developments |
| Segments Covered | By Product Type (Still Flavored Water and Carbonated Flavored Water), By Packaging Type (Bottles, Cans, and Others), By Distribution Channel (Supermarkets & Hypermarkets, Convenience Stores, and Online Retail), By Flavor Type (Fruit-Based, Herbal / Botanical, and Others) |
| Regional Analysis | North America – The US & Canada; Europe – Germany, France, The UK, Spain, Italy, Russia & CIS, Rest of Europe; APAC– China, Japan, South Korea, India, ASEAN & Rest of APAC; Latin America– Brazil, Mexico & Rest of Latin America; Middle East & Africa– GCC, South Africa, & Rest of MEA |
| Competitive Landscape | Nestlé S.A., The Coca-Cola Company, PepsiCo, Inc., Danone S.A., Kraft Heinz Company, National Beverage Corp., Sanpellegrino S.p.A., Keurig Dr Pepper Inc., Reed’s, Inc., Talking Rain Beverage Company |
| Customization Scope | Customization for segments, region/country-level will be provided. Moreover, additional customization can be done based on the requirements. |
| Purchase Options | We have three licenses to opt for: Single User License, Multi-User License (Up to 5 Users), Corporate Use License (Unlimited Users and Printable PDF) |





































