


Report Overview
In 2025, the Global Connected Worker Market was valued at USD 8.1 billion. The market is projected to grow at a CAGR of 24.0% during 2026–2035, reaching approximately USD 69.3 billion by 2035. North America dominated the global market in 2025, accounting for more than 40.6% of the total market share and generating approximately USD 3.2 billion in revenue.
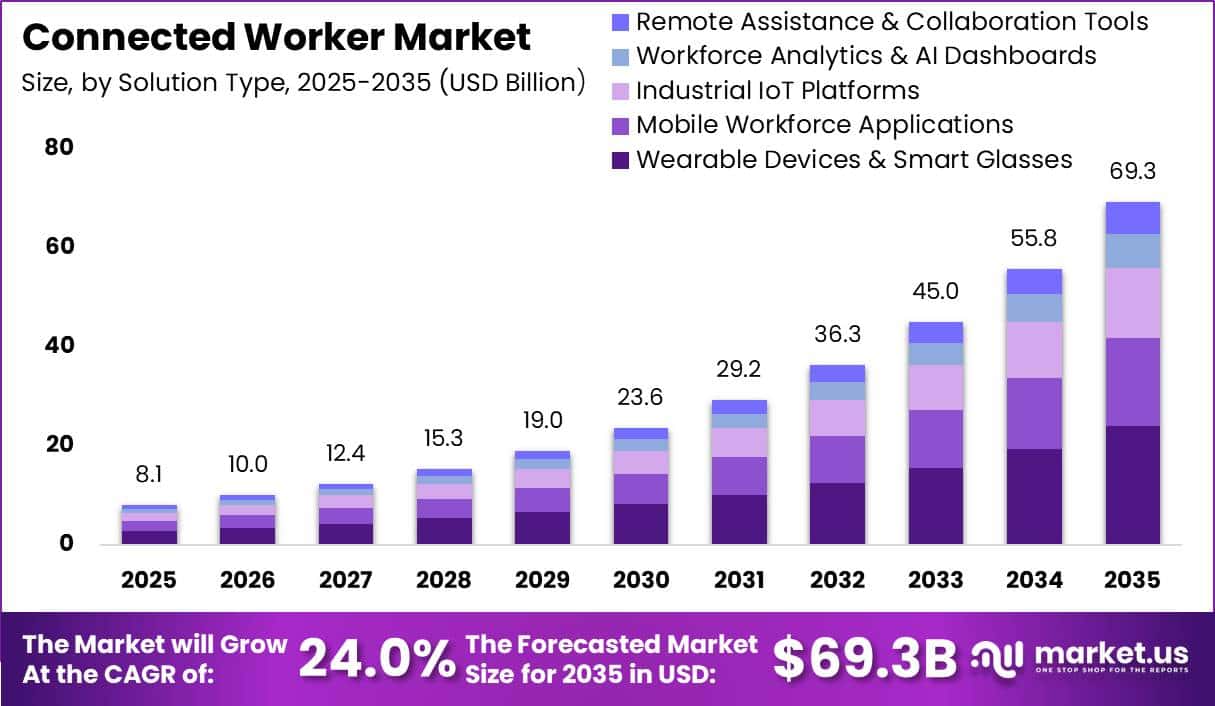
This growth is driven by the rapid digitalization of asset-intensive industries and the growing need to improve frontline workers’ safety, productivity, and decision-making. According to the World Bank, global manufacturing value added reached nearly USD 16.8 trillion in 2024, highlighting the large scale of industrial operations that increasingly depend on real-time data, automation, and digital workflows.
The automotive industry also creates strong demand for connected worker technologies. The International Organization of Motor Vehicle Manufacturers reported that approximately 92.5 million vehicles were produced worldwide in 2024. China accounted for more than 31 million units, representing nearly one-third of global vehicle production.
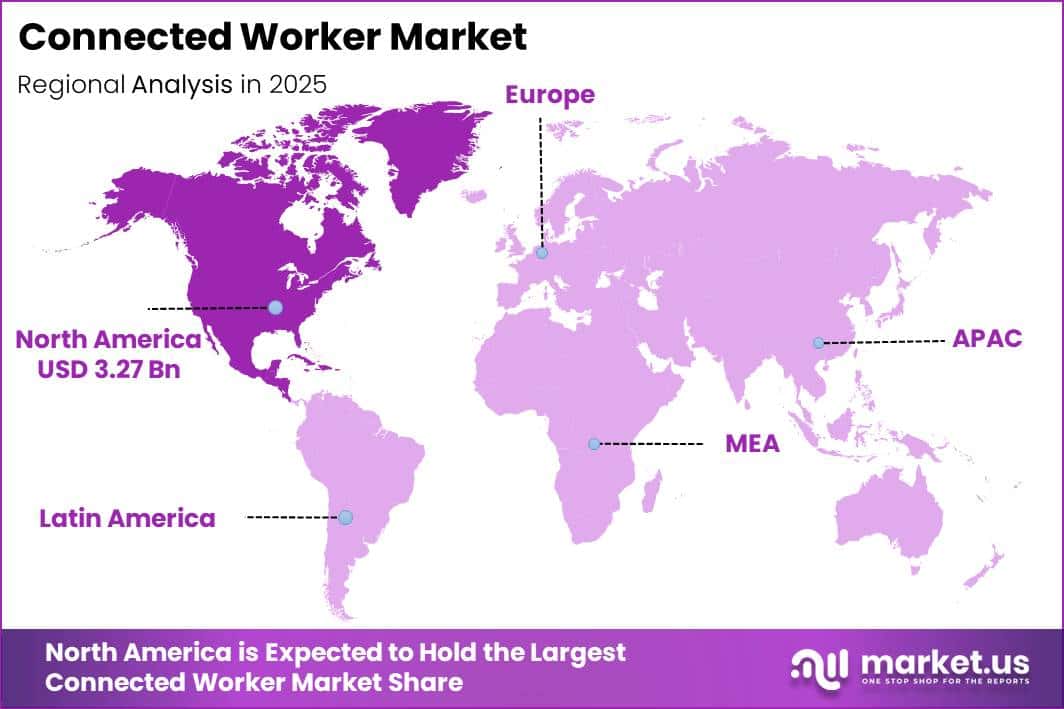
North America generated approximately USD 3.2 billion in revenue. Its leading position is supported by a developed industrial base, strict safety requirements, and faster adoption of industrial IoT and private 4G and 5G networks. As automated production lines and remote operations expand, connected worker solutions are expected to remain a key part of Industry 4.0 strategies during 2026–2035.
Key Takeaway
- The Connected Worker Market was valued at USD 8.1 billion in 2025 and is projected to reach USD 69.3 billion by 2035. The market is expected to grow at a CAGR of 24.0% during 2026–2035.
- Wearable Devices & Smart Glasses led the Solution Type segment with a 34.6% share.
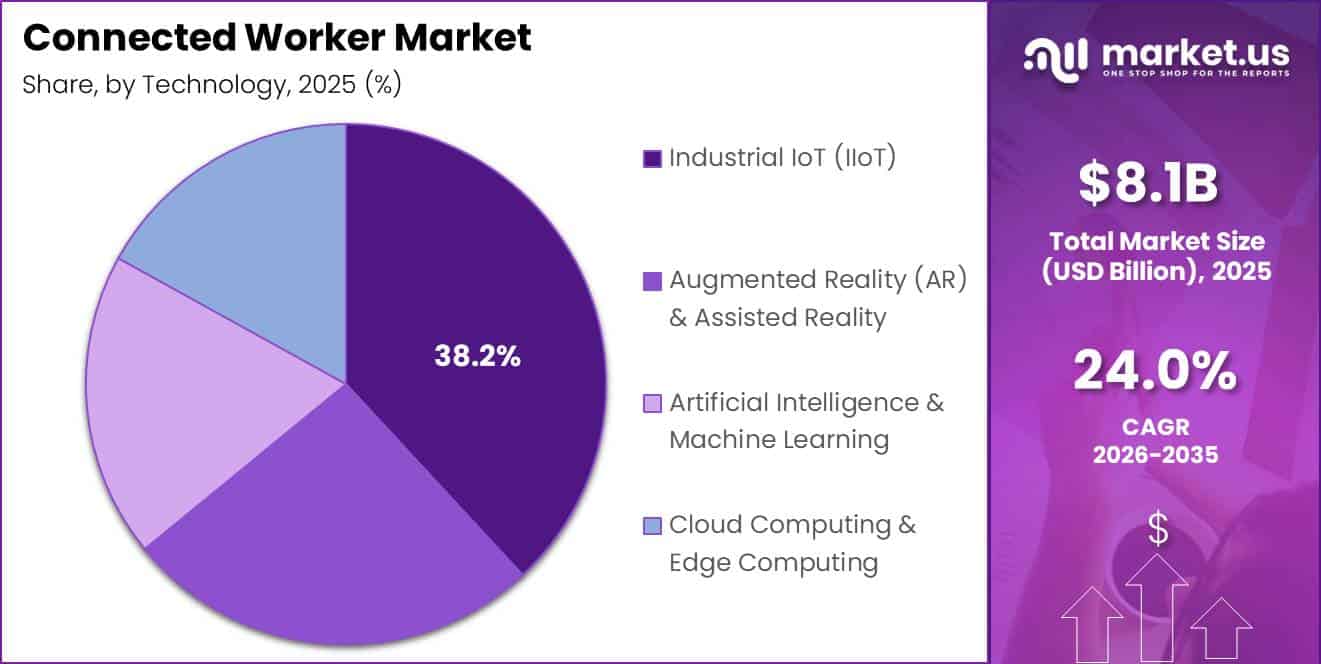
- Industrial IoT held the largest Technology share at 38.2%.
- Cloud-Based Platforms dominated Deployment Mode with a 69.1% share.
- Field Service Management led the Application segment with a 37.8% share.
- Manufacturing led the End User Industry segment with a 41.5% share.
- Large Enterprises held a 66.4% share by Enterprise Size.
- Smartphones and tablets led the Device Type segment with a 42.9% share.
- Assisted Work led the Work Mode segment with a 39.3% share.
- North America led the market in 2025 with more than 40.6% share and USD 3.2 billion in revenue.
By Solution Type
The Wearable Devices & Smart Glasses segment led the connected worker market with a 34.6% share, supported by the growing use of hands-free devices in industrial operations. These figures show that wearable technologies are increasingly being adopted beyond consumer applications.
Factories, logistics centers, utilities, and field service companies use smart glasses and rugged wearables to provide real-time instructions, machine data, digital work orders, and remote expert support. These devices allow workers to complete maintenance and inspection tasks while keeping both hands free, helping improve safety, accuracy, and productivity.
Mobile Workforce Applications represent the fastest-growing device segment because smartphones and tablets are already widely used by employees and field teams. World Bank data showed that ICT service exports accounted for around 12.2% of global service exports in 2024, reflecting the growing importance of software, cloud platforms, and mobile applications.
By Technology
Industrial IoT held a leading 38.2% share of the connected worker market, as it provides the main digital link between workers, machines, sensors, and production systems. According to the International Federation of Robotics, more than 4.2 million industrial robots were operating in factories worldwide in 2023, while annual installations exceeded 541,000 units.
Modern robots, conveyors, pumps, and CNC machines increasingly use sensors and connected controls to send real-time data through IIoT platforms. Connected workers receive equipment alerts, maintenance instructions, performance updates, and safety warnings through smart devices. As industrial automation expands, more operators and technicians depend on IIoT dashboards, digital workflows, and machine diagnostics, supporting the segment’s dominant market position.
By Deployment Mode
Cloud-based platforms led the connected worker market with a 69.1% share, as industrial companies increasingly prefer scalable and centrally managed systems for large, distributed workforces. A global manufacturing technology survey found that around 76% of discrete and process manufacturers already use cloud platforms for real-time collaboration and supply chain improvement.
Connected worker platforms must collect sensor data from several plants and deliver alerts, digital procedures, and work orders to thousands of employees. Cloud infrastructure manages this large workload more efficiently than isolated on-premises systems by offering flexible computing capacity, wider access, faster software updates, and lower operating costs per user.
By Application
Field Service Management led the connected worker market with a 37.8% share, supported by the large number of industrial assets that require regular inspection, repair, and certification at remote or customer locations. According to the Global Wind Workforce Outlook by GWEC, around 574,000 technicians will be required worldwide by 2027 to install and maintain more than 1,581 GW of operating wind power capacity, more than double the level recorded in 2020.
Remote Maintenance and Troubleshooting is the fastest-growing application because companies increasingly use live video, augmented reality, and digital twins to assist workers from a distance. Remote experts can view equipment conditions, mark live video, and provide step-by-step repair guidance without travelling to the site. This approach reduces maintenance time, travel expenses, equipment downtime, and service costs.
By End User Industry
Manufacturing led the connected worker market with a 41.5% share, supported by the large scale and growing complexity of global factory operations. According to the World Bank, worldwide manufacturing value added reached about USD 16.8 trillion in 2024, while the United States contributed more than USD 2.8 trillion.
Energy and Utilities is the fastest-growing segment, driven by rising energy demand and the expansion of distributed infrastructure. The International Energy Agency reported that global energy demand increased by around 2.2% in 2024, while electricity consumption rose by approximately 1,100 terawatt-hours, nearly twice the average annual increase recorded during the previous decade. Power plants, grids, substations, pipelines, and renewable energy assets require regular inspection and maintenance.
By Enterprise Size
Large enterprises led the connected worker market with a 66.4% share, supported by their large workforce, wider industrial footprint, and stronger technology budgets. World Bank firm-level analysis shows that companies with more than 100 employees account for about 41.2% of total jobs in developing economies and over 45% of employment in high- and upper-middle-income countries. Large manufacturing companies also provide nearly half of total manufacturing employment.
Small and Medium Enterprises are the fastest-growing segment as connected worker technologies become more affordable and easier to deploy. According to the International Labour Organization, small economic units account for around 70% of total employment across 99 countries and nearly 100% in some low-income economies. Government support for cloud platforms, digital training, and financing is also helping reduce the SME technology gap.
By Device Type
Smartphones and tablets led the connected worker device market with a 42.9% share, supported by their wide availability, established mobile ecosystems, and lower deployment costs. Software-as-a-Service revenue was projected to exceed USD 250 billion in 2024, showing the growing use of cloud-based and mobile-friendly business applications.
Wearable smart devices are the fastest-growing segment because they support hands-free work, continuous monitoring, and real-time safety alerts. According to IDC, global wearable device shipments were expected to reach approximately 537.9 million units in 2024, increasing by 6.1% from the previous year. Features such as heart-rate monitoring, motion tracking, fall detection, geofencing, and exposure monitoring are increasingly useful in mines, chemical plants, utilities, and other hazardous workplaces.
By Work Mode
Assisted Work led the connected worker market with a 39.3% share, as most industrial activities still require human judgement supported by digital tools. In manufacturing and energy operations, Industrial IoT systems collect real-time data from machines, but workers remain responsible for inspections, equipment adjustments, lockout procedures, and maintenance tasks.
Fully Remote Operations is the fastest-growing work mode as companies increasingly manage industrial assets from centralized control rooms. The wider U.S. IoT market was valued at approximately USD 413 billion in 2024 and is projected to grow at a 7.6% annual rate through 2030. North America’s industrial IoT market is also expected to reach USD 86.3 billion by 2032, expanding at a 16.6% CAGR.
Key Market Segments
By Solution Type
- Wearable Devices & Smart Glasses
- Mobile Workforce Applications
- Industrial IoT Platforms
- Workforce Analytics & AI Dashboards
- Remote Assistance & Collaboration Tools
By Technology
- Industrial IoT (IIoT)
- Augmented Reality (AR) & Assisted Reality
- Artificial Intelligence & Machine Learning
- Cloud Computing & Edge Computing
By Deployment Mode
- Cloud-Based Platforms
- On-Premises
- Hybrid Deployment
By Application
- Field Service Management
- Remote Maintenance & Troubleshooting
- Industrial Safety & Compliance
- Training & Skill Development
- Asset Monitoring & Inspection
By End User Industry
- Manufacturing
- Energy & Utilities
- Oil & Gas
- Construction
- Logistics & Transportation
- Healthcare
By Enterprise Size
- Large Enterprises
- Small & Medium Enterprises (SMEs)
By Device Type
- Smartphones & Tablets
- Wearable Smart Devices
- Rugged Industrial Devices
By Work Mode
- Assisted Work (Human + Digital Guidance)
- Fully Remote Operations
- On-Site Connected Operations
Geopolitical Impact Analysis
Geopolitical tensions are changing the cost structure and delivery schedules of connected worker hardware and software. These solutions depend on semiconductors, sensors, communication modules, petrochemical-based casings, and global cloud infrastructure.
WTO monitoring showed that the value of global goods imports affected by new tariffs and other import measures increased more than fourfold between mid-October 2024 and mid-October 2025, reaching the highest level in over 15 years. Higher duties on electronics and machinery raise the cost of chips, wireless modules, and sensing components used in wearables, smart glasses, gateways, and rugged mobile devices.
Transport disruptions are also creating longer lead times. UNCTAD reported that disruptions across the Red Sea, Black Sea, and Panama Canal added around 10–15 transit days on some Asia–Europe and Asia–U.S. East Coast routes. Freight costs on affected lanes increased by more than 40% in early 2024. These delays affect batteries, printed circuit boards, device housings, and other parts that often pass through major shipping routes before final assembly.
Energy price volatility creates another layer of cost pressure. The International Energy Agency reported that global energy demand increased by about 2.2% in 2024, nearly twice the recent average. Higher oil prices increase the cost of ABS, polypropylene, cables, and protective casings, while higher electricity prices raise semiconductor and electronics production costs.
Regional Analysis
North America led the connected worker market with a 40.6% share, generating approximately USD 3.2 billion in revenue. Its dominant position is supported by a mature industrial sector, advanced digital infrastructure, and early adoption of Industrial IoT, private 4G and 5G networks, and workforce safety technologies.
Manufacturers, construction companies, and energy utilities increasingly use connected worker platforms to improve productivity, reduce workplace incidents, and standardize operating procedures. The United States contributes the largest portion of regional revenue due to extensive industrial automation and strict OSHA compliance requirements.
Asia-Pacific is the fastest-growing regional market and currently accounts for around 20% of global connected worker revenue. Growth is driven by rapid industrialization, expanding manufacturing capacity, and increasing factory automation across China, India, Japan, and South Korea. Rising robot installations and the development of smart factories are creating greater demand for wearables, mobile workforce applications, and IIoT-based platforms.
Key Regions and Countries
North America
- US
- Canada
Europe
- Germany
- France
- The UK
- Spain
- Italy
- Rest of Europe
Asia Pacific
- China
- Japan
- South Korea
- India
- Australia
- Rest of APAC
Latin America
- Brazil
- Mexico
- Rest of Latin America
Middle East & Africa
- GCC
- South Africa
- Rest of MEA
Market Dynamics
Drivers
| Driver | (~) % CAGR | Geographic Relevance | Impact Timeline |
|---|---|---|---|
| Safety compliance digitalization | +4.0% | North America, Europe, East Asia | Short term (≤ 2 years) |
| Industrial wearables productivity gains | +3.5% | Global manufacturing and energy hubs | Short term (≤ 2 years) |
| Workforce shortages in skilled trades | +2.5% | North America, Western Europe, Japan | Medium term (2–4 years) |
| 5G and private LTE rollout | +2.0% | China, US, EU industrial corridors | Medium term (2–4 years) |
| Cloud-native EHS and operations platforms | +1.8% | Global, early adopter enterprises | Short term (≤ 2 years) |
| Post-incident liability and insurance pressure | +1.2% | Global, high-risk industries | Medium term (2–4 years) |
Safety compliance digitalization
From 2024 to 2026, regulators and corporate EHS teams have shifted from paper-based logs to auditable digital safety records, forcing large industrial operators to adopt connected worker platforms that can capture device telemetry, geolocation, and task confirmations in real time to prove compliance with occupational safety mandates and process safety management rules.
This driver adds roughly 4.0 percentage points to the baseline CAGR because mandated digital traceability converts what was once discretionary software into quasi-nonnegotiable infrastructure, lifting per-site annual SaaS spend from low five-figure budgets to mid-five-figure ranges and increasing device penetration from single-digit to low double-digit units per 100 field workers in regulated sectors.
By reducing recordable incident rates by an estimated 10–20% where real-time monitoring and automated alerts are deployed, and by cutting the time needed for regulatory reporting and internal audits by 30–40%, connected worker vendors can justify subscription uplifts of 15–25% and expand module attach rates (analytics, mobile procedures, digital permits) from roughly 1–2 modules per site to 3–4, structurally altering business models away from one-off licenses toward multi-module recurring revenue anchored in compliance outcomes.
Restraints
| Restraint | (~) % CAGR | Geographic Relevance | Impact Timeline |
|---|---|---|---|
| Upfront hardware and integration costs | -3.0% | Global, capex-constrained sectors | Short term (≤ 2 years) |
| Union and workforce pushback | -2.0% | North America, Europe | Medium term (2–4 years) |
| Data privacy and surveillance concerns | -1.8% | EU, privacy-stringent markets | Short term (≤ 2 years) |
| Harsh-environment device reliability issues | -1.5% | Oil & gas, mining, heavy process | Medium term (2–4 years) |
| Fragmented brownfield OT landscapes | -1.2% | Legacy plants worldwide | Long term (≥ 4 years) |
| Macro interest rate and capex caution | -1.0% | Global, especially emerging markets | Short term (≤ 2 years) |
Upfront hardware and integration costs
Despite the SaaS pivot, connected worker deployments in 2024–2026 still require bundling ruggedized handhelds, smart wearables, and network upgrades, pushing initial project tickets into the mid-six-figure range for multi-site rollouts and creating a restraint that shaves roughly 3.0 percentage points off the otherwise higher CAGR implied by safety and productivity gains.
Hardware alone can represent 40–60% of year-one cash outlay, with certified intrinsically safe devices in oil & gas and chemicals costing 2–3 times standard industrial tablets, while integration to existing CMMS, DCS, and ERP systems adds implementation service ratios of 0.7–1.2 times first-year software subscription value, elongating payback periods to 24–36 months for conservative operators.
In a macro context of elevated interest rates and competing digital initiatives, this cost stack delays board approval cycles by 6–12 months, forces vendors to offer extended pilots at discounted rates, and compresses gross margins by 3–5 percentage points where vendors finance devices or bundle integration services at cost to overcome capex hesitancy.
Challenges
| Challenge | (~) % CAGR | Geographic Relevance | Mitigation Horizon |
|---|---|---|---|
| Interoperability across OT systems | -2.8% | Global brownfield industrial sites | Long term (≥ 4 years) |
| Change management and training load | -2.3% | Global frontline-heavy industries | Medium term (2–4 years) |
| Cybersecurity for edge devices | -2.0% | North America, Europe, critical infrastructure | Long term (≥ 4 years) |
| Battery life and ergonomics in wearables | -1.7% | High-temperature and outdoor sites | Medium term (2–4 years) |
| Inconsistent enterprise-wide KPIs | -1.5% | Global diversified conglomerates | Short term (≤ 2 years) |
| Vendor ecosystem fragmentation | -1.3% | Global, mid-market enterprises | Medium term (2–4 years) |
Interoperability across OT systems
Connected worker deployments must bridge heterogeneous OT estates that include legacy PLCs, proprietary historian databases, multiple CMMS instances, and plant-specific mobile apps, and this structural complexity imposes an estimated 2.8-point drag on the market’s maximum attainable CAGR by slowing multi-site standardization and raising per-integration costs.
Each additional OT or maintenance system interface can add 8–12 weeks of project time and incremental services equal to 10–20% of initial software contract value, while version drift and site-level customization drive annual maintenance services to as high as 15% of software ARR just to keep interfaces operational.
To cope, larger vendors are investing 15–25% of R&D budgets into open APIs, reference connectors, and edge gateway abstractions that normalize OT data, but until these platforms become de facto standards across regions, enterprises will continue to phase rollouts through 3–5 pilot plants over 18–36 months instead of executing aggressive network-wide deployments in a single budget cycle.
Opportunities
| Opportunity | (~) % CAGR | Geographic Relevance | Execution Window |
|---|---|---|---|
| Outcome-based safety and uptime contracts | +3.2% | Global, large industrial accounts | Medium term (2–4 years) |
| AI-guided maintenance and workflows | +2.7% | North America, Europe, East Asia | Medium term (2–4 years) |
| Cross-vertical connected workforce suites | +2.3% | Global multi-industry enterprises | Long term (≥ 4 years) |
| Integration with mixed-reality training | +1.9% | Advanced manufacturing and energy | Long-term (≥ 4 years) |
| SME-focused subscription bundles | +1.6% | Latin America, South Asia, Eastern Europe | Medium term (2–4 years) |
| Insurance-linked risk scoring partnerships | +1.4% | Global, high-risk insured sectors | Long term (≥ 4 years) |
Outcome-based safety and uptime contracts
Outcome-based connected worker models remain largely untapped as of 2026, but they can add an estimated 3.2 percentage points of upside to the baseline CAGR by shifting from per-seat licensing to contracts where pricing is indexed to avoided downtime hours, reduced recordable incidents, or compliance milestone attainment, directly monetizing the operational impact of digital workflows and wearables.
In high-risk industrial operations where unplanned downtime can cost tens of thousands of dollars per hour and where AR-enabled maintenance workflows have already demonstrated error rate reductions of about 32% in early deployments, even capturing 5–10% of the quantifiable savings into subscription or success-fee structures could lift vendor gross margins by 4–8 percentage points and expand average annual contract values per plant by 30–50%.
Structurally, this opportunity is future rather than current because it requires longitudinal benchmarking data, integration between connected worker telemetry and maintenance or safety outcome systems, and alignment with corporate risk and finance teams, but vendors who build actuarial-grade datasets and standardized KPIs over the next 2–4 years can unlock sizable untapped demand among enterprises seeking to convert capex-heavy safety investments into predictable opex tied to guaranteed performance outcomes.
Key Players Analysis
Tier-1 companies in the connected worker market include Microsoft, AWS, IBM, SAP, Oracle, Siemens, Honeywell, GE Digital, Accenture, and Deloitte. Together, these companies are estimated to control around 55–65% of global platform and infrastructure revenue through cloud, industrial IoT, automation, ERP, and safety solutions.
Microsoft Cloud revenue exceeded USD 168 billion in FY2025, with Azure generating more than USD 75 billion and growing 34% year-on-year. Microsoft also invested nearly USD 24–30 billion in data centers and AI infrastructure. Oracle recorded FY2025 revenue of USD 57.4 billion, including USD 44.0 billion from cloud services and license support, which increased by 12%.
SAP generated approximately EUR 32.5 billion, or nearly USD 35 billion, from cloud and software in 2025. Its cloud revenue grew 23%, while cloud ERP suite revenue rose 28%. Honeywell reported operating income of USD 5.5 billion in 2025. Zebra Technologies invested USD 593 million in research and development, equal to around 11% of net sales, and completed a USD 1.3 billion acquisition of Elo.
Tier-2 companies, including PTC, RealWear, Librestream, and Augmentir, are estimated to account for 20–30% of market revenue. PTC reported FY2025 revenue of approximately USD 2.7 billion, while annual recurring revenue reached USD 2.4 billion and increased 8.5% in constant currency. These specialists focus on augmented reality, remote assistance, workforce analytics, and digital guidance. Accenture and Deloitte mainly support implementation, while AWS provides the cloud infrastructure used by many connected worker platforms.
Top Key Players in the Market
- Microsoft
- PTC
- Siemens
- Honeywell
- Augmentir
- RealWear
- Zebra Technologies
- Librestream
- GE Digital
- Oracle
- IBM
- SAP
- Accenture
- Deloitte
- Amazon Web Services
Recent Developments
- In February 2026, Zebra Technologies confirmed in its 2025 Form 10-K that it completed the acquisition of Elo Holdings on September 30, 2025, for USD 1.3 billion in cash. The acquisition expanded Zebra’s Connected Frontline segment with touch interfaces, self-service systems, and workflow automation solutions, strengthening its position in connected worker hardware and human-machine interfaces.
- In July 2025, Microsoft reported that Azure’s annual revenue exceeded USD 75 billion, increasing by 34%. Microsoft also operated more than 400 data centers across 70 regions and added over 2 gigawatts of capacity during the previous 12 months, expanding the cloud infrastructure available for industrial data management, remote collaboration, and connected worker applications.
- In November 2025, PTC reported FY2025 revenue of USD 2.7 billion and ARR of USD 2.4 billion. Its constant-currency ARR reached USD 2.4 billion, increasing by 8.5%. PTC also announced plans to divest its ThingWorx IoT and Kepware connectivity businesses, indicating a strategic shift toward its core product lifecycle software portfolio.
Report Scope
| Report Features | Description |
|---|---|
| Market Value (2025) | USD 8.1 Billion |
| Forecast Revenue (2035) | USD 69.3 Billion |
| CAGR (2026-2035) | 24.0% |
| Base Year for Estimation | 2025 |
| Historic Period | 2020-2024 |
| Forecast Period | 2026-2035 |
| Report Coverage | Revenue Forecast, Market Dynamics, Competitive Landscape, Recent Developments |
| Segments Covered | By Solution Type (Wearable Devices & Smart Glasses, Mobile Workforce Applications, Industrial IoT Platforms, Workforce Analytics & AI Dashboards, Remote Assistance & Collaboration Tools); By Technology (Industrial IoT, Augmented Reality & Assisted Reality, Artificial Intelligence & Machine Learning, Cloud Computing & Edge Computing); By Deployment Mode (Cloud-Based Platforms, On-Premises, Hybrid Deployment); By Application (Field Service Management, Remote Maintenance & Troubleshooting, Industrial Safety & Compliance, Training & Skill Development, Asset Monitoring & Inspection); By End User Industry (Manufacturing, Energy & Utilities, Oil & Gas, Construction, Logistics & Transportation, Healthcare); By Enterprise Size (Large Enterprises, Small & Medium Enterprises); By Device Type (Smartphones & Tablets, Wearable Smart Devices, Rugged Industrial Devices); By Work Mode (Assisted Work, Fully Remote Operations, On-Site Connected Operations) |
| Regional Analysis | North America – US, Canada; Europe – Germany, France, The UK, Spain, Italy, Rest of Europe; Asia Pacific – China, Japan, South Korea, India, Australia, Singapore, Rest of APAC; Latin America – Brazil, Mexico, Rest of Latin America; Middle East & Africa – GCC, South Africa, Rest of MEA |
| Competitive Landscape | Microsoft, PTC, Siemens, Honeywell, Augmentir, RealWear, Zebra Technologies, Librestream, GE Digital, Oracle, IBM, SAP, Accenture, Deloitte, Amazon Web Services |
| Customization Scope | Customization for segments, region/country-level will be provided. Moreover, additional customization can be done based on the requirements. |
| Purchase Options | We have three licenses to opt for: Single User License, Multi-User License (Up to 5 Users), Corporate Use License (Unlimited Users and Printable PDF) |





































