


Report Overview
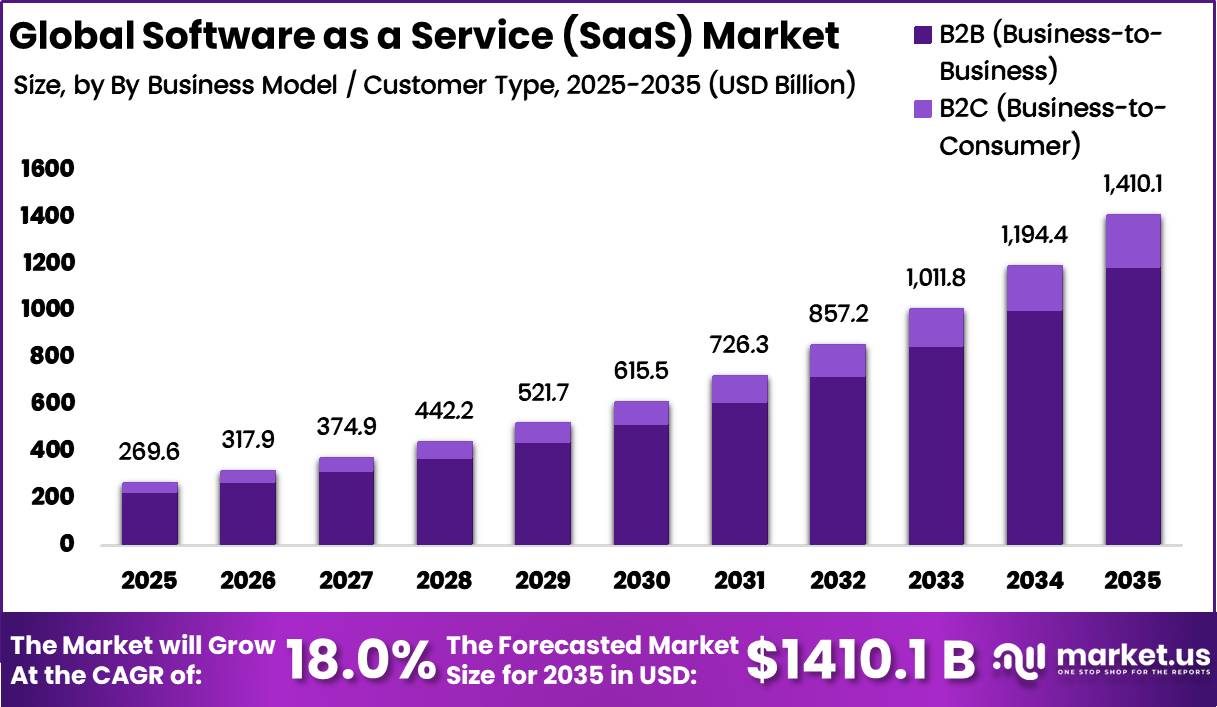
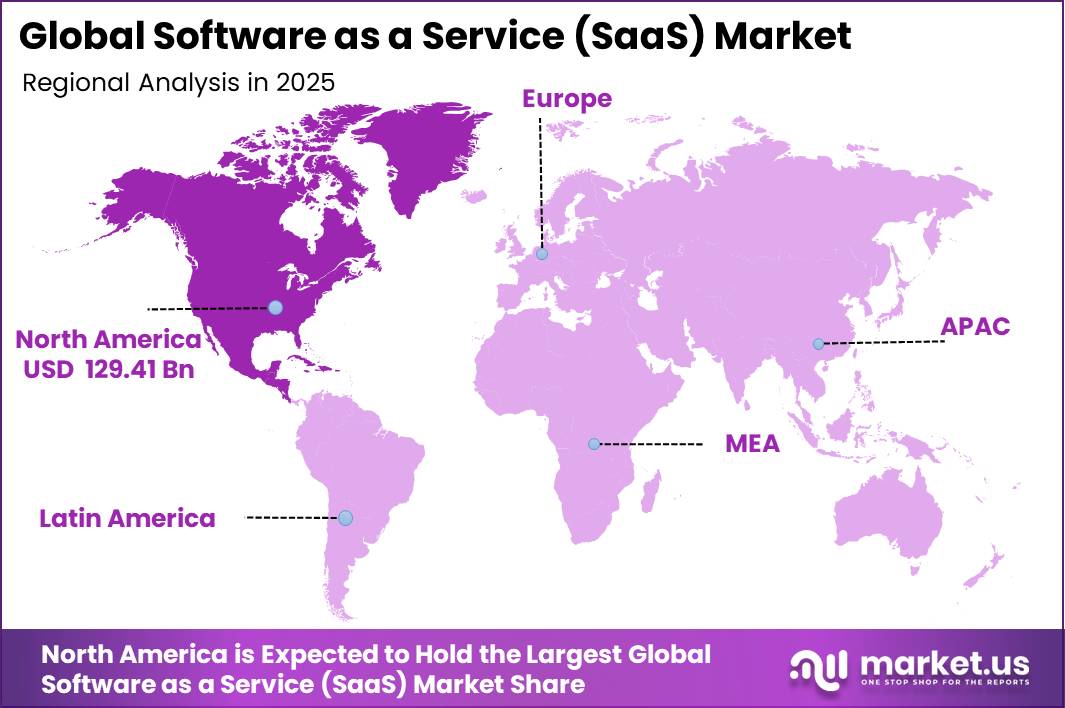
In 2025, the Global Software as a Service (SaaS) Market was valued at USD 269.6 billion and is expected to reach approximately USD 1,410.1 billion by 2035, growing at a CAGR of 18.0% from 2026 to 2035. North America held the largest market share in 2025, contributing more than 48% of global revenue, or about USD 129.41 billion.
This leadership is supported by the rapid expansion of the digital economy and the increasing adoption of cloud services across businesses. The OECD Digital Economy Outlook 2024 reported that the ICT sector grew by 7.6% in 2023, almost three times faster than the overall economy across OECD countries.
In addition, the International Telecommunication Union (ITU) estimated that around 6 billion people, or 74% of the global population, were using the internet in 2025, compared with 60% five years earlier. As more businesses move online, the demand for cloud-based software to manage operations, customer relationships, finance, and data continues to increase because SaaS provides flexible and cost-effective solutions.
The U.S. federal government allocated USD 102.31 billion for IT in fiscal year 2025, with major spending focused on cloud migration and digital modernization. At the same time, UNCTAD reported that business e-commerce sales across economies representing 75% of global GDP increased by nearly 60% between 2016 and 2024. The World Bank also highlights that a 10% rise in broadband penetration can increase GDP by 0.25%, supporting continued investment in enterprise software and long-term growth for the SaaS market.
Key Takeaway
- The Global Software as a Service (SaaS) market was valued at USD 269.6 billion in 2025 and is projected to reach USD 1,410.1 billion by 2035, expanding at a CAGR of 18.0% during 2026 to 2035.
- By business model, B2B (Business-to-Business) led the market with an 84.0% share in 2025.
- By application, Customer Relationship Management (CRM) held the largest market share at 22.0% in 2025.
- By deployment model, Public Cloud dominated the market, accounting for 58.0% of total revenue in 2025.
- By organization size, Large Enterprises held the leading position with a 52.0% market share in 2025.
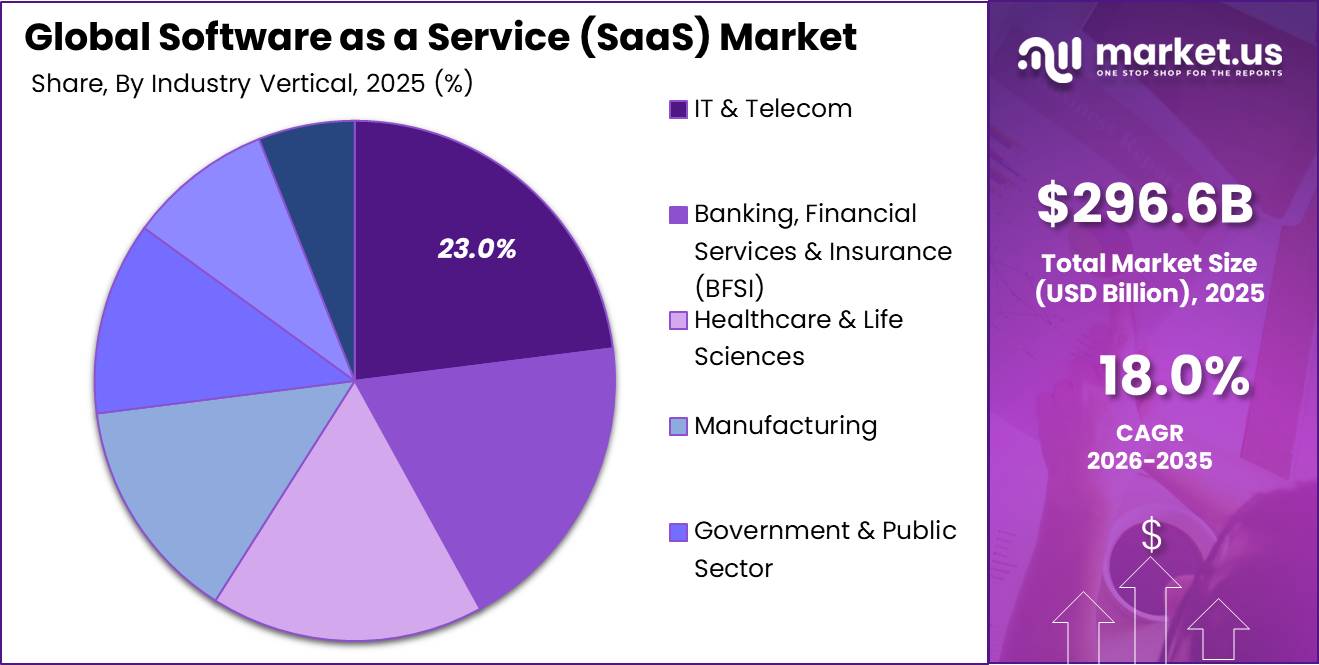
- By industry vertical, IT & Telecom emerged as the largest segment, contributing 23.0% of the global SaaS market in 2025.
- North America dominated the global Software as a Service (SaaS) market in 2025 with a 48.0% share, reaching approximately USD 129.41 billion.
Business Model / Customer Type
The B2B (Business to Business) segment accounted for the largest share of the global SaaS market at an estimated 84.0% in 2025. Businesses are the main users of SaaS because they rely on cloud-based software to manage finance, supply chains, human resources, customer relationships, and daily operations. SaaS offers lower upfront costs, easy scalability, regular updates, and seamless integration, making it the preferred software delivery model for enterprises.
According to Eurostat’s 2025 enterprise ICT survey, 52.7% of EU enterprises used paid cloud computing services. Among them, finance and accounting software was used by 51.6% of businesses, ERP applications by 46.45%, and CRM platforms by 28.51%, showing strong adoption of business software across key functions. Large organizations often use multiple SaaS applications at the same time, creating higher and more stable subscription revenue than individual consumers.
UNCTAD reported that global trade reached a record value of nearly USD 33 trillion in 2024, supported by a 7% increase in trade in services. In addition, the WTO estimated that digitally delivered service exports reached USD 4.25 trillion in 2023, reflecting rising demand for software that supports international business operations. Government policies are also encouraging enterprise cloud adoption.
By Application / Solution Type
Customer Relationship Management (CRM) accounted for the largest share of the global SaaS market at approximately 22.0% in 2025. CRM remains the leading application because businesses across all industries rely on it to manage customer relationships, improve sales performance, and enhance customer service.
As companies continue to expand their digital operations, the need for centralized customer data and automated sales processes continues to grow. According to the WTO, global exports of digitally delivered services reached USD 4.25 trillion in 2023, increasing by 9% year over year.
This growth has created greater demand for CRM platforms that help businesses manage customer interactions across multiple channels. Eurostat’s 2025 Digital Economy and Society Statistics survey reported that 28.51% of EU enterprises were using CRM software in 2025, up from 25.8% in 2023, with adoption highest among large enterprises.
In addition, 53% of EU enterprises used specialized e-business software, including CRM, in 2025. The European Commission’s target of achieving 75% enterprise adoption of cloud computing by 2030 is expected to further increase CRM deployment, supporting its position as the largest application segment in the global SaaS market.
By Deployment Model
The Public Cloud segment held the largest share of the global SaaS market at approximately 58.0% in 2025. Its leadership is driven by cost efficiency, flexibility, and the ability to deliver software over the internet without requiring businesses to invest in expensive on-premises infrastructure.
According to the OECD Digital Economy Outlook 2024, cloud computing is used by an average of 49% of businesses with 10 or more employees across OECD countries, making it one of the fastest-growing enterprise technologies. Eurostat’s 2025 ICT Usage Survey found that 52.74% of EU enterprises used paid cloud computing services in 2025, up from 45.32% in 2023, reflecting strong growth in cloud adoption.
Among these businesses, 75.3% used advanced cloud services such as security software, hosted databases, and application development platforms, highlighting the increasing use of cloud-based business solutions. The European Commission’s AI Continent Action Plan, introduced in 2025, also supports future growth by aiming to significantly expand data center capacity over the next five to seven years to meet rising demand from businesses and public institutions.
By Organization Size
Large Enterprises accounted for the largest share of the global SaaS market at approximately 52.0% in 2025. Their leadership is driven by higher IT spending, complex operations, and the need for cloud-based software across finance, HR, CRM, ERP, cybersecurity, and analytics.
According to Eurostat’s 2025 ICT Usage Survey, 84.67% of large EU enterprises used paid cloud computing services, compared with 49.3% of small enterprises. Among large enterprises using cloud services, 83.3% adopted Infrastructure as a Service and 48.1% used Platform as a Service. The OECD Digital Economy Outlook 2024 also reported that the ICT sector grew by 7.6% in 2023, supporting continued enterprise investment in SaaS solutions.
Small and Medium Enterprises (SMEs) are the fastest-growing segment of the global SaaS market. According to the International Finance Corporation, MSMEs account for more than 90% of businesses worldwide, contribute about 50% of global GDP, and provide around 70% of total employment.
By Industry Vertical
The IT and Telecom segment accounted for the largest share of the global SaaS market at approximately 23.0% in 2025. The segment leads because telecom operators and IT companies rely heavily on cloud-based software to manage networks, customers, billing, operations, and business processes.
According to industry estimates, the global telecommunications industry generated about USD 1.55 trillion in revenue in 2025, supporting continued investment in cloud technologies. Ericsson’s Mobility Report 2025 stated that global 5G subscriptions exceeded 2.9 billion by the end of 2025, representing about one-third of all mobile subscriptions, with 5G expected to become the leading mobile technology by 2027.
This transition is increasing demand for cloud-based Operations Support Systems and Business Support Systems that help telecom operators manage next-generation networks. The GSMA Mobile Economy 2026 report estimated that mobile technologies contributed USD 7.6 trillion to the global economy in 2025, equal to 6.4% of global GDP.
The WIPO Global Innovation Index 2025 reported that global software spending reached USD 675 billion in 2024, highlighting continued investment in enterprise software. The ITU also reported 9.2 billion mobile cellular subscriptions worldwide in 2025, with mobile broadband accounting for 89% of total subscriptions. These trends continue to drive strong demand for SaaS solutions across the IT and Telecom industry.
Key Market Segments
By Business Model / Customer Type
- B2B (Business-to-Business)
- Enterprise SaaS
- Mid-Market
- SMB (Small to Medium Business)
- B2C (Business-to-Consumer)
By Application / Solution Type
- Customer Relationship Management (CRM)
- Enterprise Resource Planning (ERP)
- Human Capital Management (HCM/HRM)
- Collaboration & Communication
- Accounting & Finance
By Deployment Model
- Public Cloud
- Private Cloud
- Hybrid Cloud
By Organization Size
- Large Enterprises
- Small & Medium Enterprises (SMEs)
By Industry Vertical
- IT & Telecom
- Banking, Financial Services & Insurance (BFSI)
- Healthcare & Life Sciences
- Manufacturing
- Government & Public Sector
- Energy & Utilities
- Others
Geopolitical Impact Analysis
The global SaaS market is increasingly affected by geopolitical tensions that are raising infrastructure costs and creating barriers to cross-border digital services. SaaS platforms depend on data centers, servers, semiconductors, GPUs, and networking equipment, making them sensitive to global trade restrictions. The IMF estimates that geo-economic fragmentation could reduce global GDP by 0.2% to 7%, with advanced economies facing losses of 2% to 3% due to technology separation and supply chain disruptions.
In 2025, new U.S. tariffs on electronics and semiconductors from Japan and South Korea, along with a 50% tariff on copper imports, increased the cost of building and operating cloud infrastructure. At the same time, tighter U.S. export controls on advanced AI chips have limited GPU availability, making it more expensive for SaaS providers to expand AI-powered services.
Server DRAM prices also increased sharply, putting additional pressure on cloud operating costs. The end of the WTO moratorium on customs duties for electronic transmissions in March 2026 has also created uncertainty for cross-border software services. In addition, rising energy costs continue to affect data center operations. The IEA reported that global data center electricity consumption reached 415 TWh in 2024 and is expected to more than double by 2030.
Regional Analysis
North America held the largest share of the global SaaS market in 2025, accounting for 48.0% of total revenue, valued at USD 129.41 billion. The region leads because of its advanced digital infrastructure, high cloud adoption, and strong presence of major SaaS providers.
The United States is the largest contributor, while Canada and Mexico continue to expand cloud adoption across different industries. Leading cloud platforms such as AWS, Microsoft Azure, and Google Cloud support a large network of data centers, enabling businesses to deploy SaaS solutions efficiently.
Asia Pacific is the fastest-growing region in the global SaaS market, supported by rapid digital transformation, increasing cloud investments, and government initiatives promoting digital technologies. The region is seeing strong demand as businesses move from traditional IT systems to cloud-based software.
Key Regions and Countries
North America
- US
- Canada
Europe
- Germany
- France
- The UK
- Spain
- Italy
- Rest of Europe
Asia Pacific
- China
- Japan
- South Korea
- India
- Australia
- Rest of APAC
Latin America
- Brazil
- Mexico
- Rest of Latin America
Middle East & Africa
- GCC
- South Africa
- Rest of MEA
Market Dynamics
Drivers
| Driver | (~) % Impact on CAGR | Geographic Relevance | Impact Timeline |
|---|---|---|---|
| Generative AI & Agentic Automation Embedded into SaaS Platforms | +3.8% | Global, led by North America & Western Europe | Short term (≤ 2 years) |
| Enterprise Cloud-First Mandates Replacing Legacy On-Premise Systems | +2.5% | Global, with high intensity in North America & APAC | Short term (≤ 2 years) |
| SME Adoption of Subscription-Based Enterprise Tooling | +2.1% | Global, highest velocity in South Asia & Southeast Asia | Short term (≤ 2 years) |
| Shift from CapEx Software Licensing to OpEx Subscription Models | +1.6% | Global, accelerating in EMEA & Latin America | Short term (≤ 2 years) |
| Multi-Cloud & Hybrid Cloud Strategy Proliferation | +1.4% | North America, Western Europe, ANZ | Medium term (2 to 4 years) |
| Usage-Based & Consumption Pricing Unlocking New Buyer Segments | +1.2% | Global, particularly mid-market & digital-native firms | Medium term (2 to 4 years) |
Generative AI & Agentic Automation Embedded into SaaS Platforms has structurally shifted from an add-on feature tier to a core architectural layer within SaaS platforms, fundamentally altering product economics, buyer willingness to pay, and competitive differentiation. Gartner forecasted worldwide IT spending at $5.43 trillion in 2025, a 7.9% annual increase, with AI-related software the fastest-growing sub-category.
This investment surge directly restructures SaaS contract dynamics: enterprise buyers that previously negotiated flat seat-based licenses are migrating toward outcome-linked or consumption tiers, which in leading platform cohorts drove net revenue retention above 120% in 2024 to 2025.
Agentic multi-step automation, where AI executes tasks across APIs, datasets, and third-party integrations without human triggers, is the primary 2026 product battleground, with over 75% of SaaS firms expected to have deployed AI-driven automation across at least one major business process by 2026.
Platform-level AI also materially reduces customer acquisition cost by extending product-led growth motions: autonomous onboarding and predictive engagement reduce reliance on outbound sales cycles that historically consumed 25 to 35% of SaaS operating budgets, simultaneously expanding gross margins while compressing go-to-market cycle times.
Restraints
| Restraint | (~) % Impact on CAGR Forecast | Geographic Relevance | Impact Timeline |
|---|---|---|---|
| Data Privacy & Sovereignty Regulations Blocking Cross-Border Deployment | −2.4% | EU, India, Southeast Asia, Brazil, USA (state-level) | Short term (≤ 2 years) |
| Enterprise IT Budget Rationalization & SaaS Consolidation Mandates | −1.8% | Global, most acute in North America & Western Europe | Short term (≤ 2 years) |
| Elevated Cost of Capital Constraining Early-Stage SaaS Vendor Investment | −1.3% | North America, Europe | Short term (≤ 2 years) |
| AI-Driven Pricing Uplift Triggering Enterprise Buyer Resistance | −1.1% | Global, most acute in mid-market enterprises | Short term (≤ 2 years) |
| Weak Digital Infrastructure Limiting Serviceable Addressable Population | −0.8% | Sub-Saharan Africa, rural South Asia, Southeast Asia | Medium term (2 to 4 years) |
The EU’s GDPR enforces fines up to €20 million or 4% of total global annual turnover per severe violation, and since the regulation’s inception through January 2025, cumulative penalties issued by EU data protection authorities reached €5.88 billion across 3,195 documented enforcement actions, with 2025 alone generating approximately €1.2 billion in new penalties, primarily for unlawful international data transfers, invalid consent mechanisms, and cookie compliance failures.
In the United States, 21 state-level data privacy laws were in force by mid-2024, with seven additional statutes, in Delaware, Maryland, Minnesota, Nebraska, New Hampshire, New Jersey, and Tennessee, taking effect through 2025, obligating SaaS vendors to maintain jurisdiction-specific data processing architectures rather than single-instance global deployments.
The operational cost of maintaining parallel data pipelines, localized compute infrastructure, and distinct consent-management stacks adds an estimated 12 to 18% to total engineering and legal overhead for mid-market SaaS vendors, directly compressing gross margins below the 70 to 75% benchmarks on which valuation multiples are typically anchored.
Challenges
| Challenge | (~) % CAGR | Geographic Relevance | Mitigation Horizon |
|---|---|---|---|
| Cybersecurity Talent Deficit | −1.9% | Global, worst in APAC & North America | Long term (≥ 4 years) |
| Enterprise SaaS Sprawl & Shadow IT | −1.4% | Global, most acute in large enterprises | Medium term (2 to 4 years) |
| Vendor Lock-In & Interoperability Friction | −1.2% | North America, EU, ANZ enterprise segments | Medium term (2 to 4 years) |
| High SMB Customer Churn Rates | −1.0% | Global, concentrated in SMB-focused SaaS vendors | Short term (≤ 2 years) |
| AI Infrastructure Cost Escalation | −0.9% | Global, disproportionate for mid-tier SaaS vendors | Medium term (2 to 4 years) |
The global cybersecurity workforce shortage remains a major challenge for the SaaS industry. According to ISC2’s 2025 Cybersecurity Workforce Study, the global workforce gap reached 4.8 million unfilled cybersecurity professionals, while organizations had only a 72% security position fill rate, leaving nearly one in four roles vacant.
In the United States, the cybersecurity talent shortage reached 522,000 unfilled positions. ISC2 also reported that 25% of organizations reduced cybersecurity staff in 2024 and 37% faced budget cuts. Fortinet’s 2025 Cybersecurity Skills Gap Report found that 86% of organizations experienced at least one cyber breach in 2024, and 54% linked the breach to inadequate cybersecurity skills and training.
For SaaS providers, these shortages result in slower patch management, delayed incident response, and underused security tools. To reduce these risks, many vendors are investing USD 180,000 to over USD 500,000 per security initiative in automation, managed detection and response, and compliance solutions while competing for limited cybersecurity talent.
Opportunities
| Opportunity | (~) % Potential CAGR | Geographic Relevance | Execution Window |
|---|---|---|---|
| Vertical SaaS Penetration in Underserved Industry Niches | +3.2% | Global, highest upside in healthcare, BFSI, agri-tech | Medium term (2 to 4 years) |
| Embedded Finance & Payments Monetization within SaaS Platforms | +2.6% | North America, EU, India, Southeast Asia | Medium term (2 to 4 years) |
| SaaS Expansion into India & Southeast Asia Growth Corridors | +2.1% | India, Indonesia, Vietnam, Philippines, Thailand | Medium term (2 to 4 years) |
| AI-Native Micro-SaaS & Autonomous Agent Marketplaces | +1.7% | Global, led by North America & EU developer ecosystems | Short term (≤ 2 years) |
| SaaS M&A Roll-Up of Distressed Point-Solution Vendors | +1.3% | North America, Europe | Long term (≥ 4 years) |
Instead of relying solely on recurring software fees, SaaS providers can integrate payments, lending, banking, and expense management directly into their platforms. According to Adyen, platforms offering embedded financial services can achieve 3–4x higher per-customer revenue by combining subscription income with payment processing fees, interchange revenue, and premium financial products.
The global embedded finance opportunity is estimated at USD 185 billion, with B2B SaaS expected to be the fastest-growing adoption segment due to its deep integration into business financial workflows. In India, embedded finance within SaaS ecosystems is projected to grow at 12.4% by 2026, supported by expanding digital infrastructure, open banking initiatives, and increasing SME adoption of cloud-based business platforms.
Key Players Analysis
The global SaaS market is led by a small group of major technology companies that generate most enterprise subscription revenue through strong cloud platforms, AI capabilities, and long-term customer contracts. Microsoft reported FY2025 revenue of USD 281.7 billion, including USD 135.7 billion from its Intelligent Cloud business, and invested USD 32.5 billion in research and development.
Salesforce generated FY2025 revenue of USD 37.9 billion, with USD 35.7 billion coming from subscription and support services, while investing nearly USD 6.0 billion in research and development. SAP reported cloud revenue of EUR 21.02 billion in FY2025 with a cloud backlog of EUR 77 billion, reflecting strong future demand.
Oracle recorded FY2025 revenue of USD 57.4 billion, including USD 44.0 billion from cloud services and license support, with remaining performance obligations reaching USD 138 billion. Among high-growth specialists, ServiceNow generated USD 13.28 billion in FY2025 revenue with USD 28.2 billion in remaining performance obligations; Workday reported subscription revenue of USD 7.72 billion; and Adobe generated USD 23.77 billion in revenue while investing USD 4.29 billion in research and development to expand AI across its SaaS portfolio.
Top Key Players in the Market
- Microsoft Corporation
- Salesforce, Inc.
- SAP SE
- Adobe Inc.
- Oracle Corporation
- Amazon Web Services (AWS)
- Google LLC (Alphabet Inc.)
- ServiceNow, Inc.
- Workday, Inc.
- IBM Corporation
- Atlassian Corporation
- Zendesk, Inc.
- Intuit Inc.
- Cisco Systems, Inc.
- Splunk Inc. (Cisco)
Recent Developments
- In March 2025, ServiceNow announced the acquisition of Moveworks for USD 2.85 billion in a cash and stock transaction to strengthen its enterprise AI assistant and agentic AI capabilities. The acquisition expanded ServiceNow’s AI portfolio by adding advanced conversational AI and enterprise search technology used by around 5 million employees across 18 countries.
- In November 2025, Salesforce completed the acquisition of Informatica for approximately USD 8.0 billion, strengthening its AI-powered cloud data management platform and enterprise data capabilities. The acquisition enables Salesforce to provide a unified and governed data foundation that supports AI-driven automation and advanced analytics across its cloud applications.
Report Scope
| Report Features | Description |
|---|---|
| Market Value (2025) | USD 269.6 Billion |
| Forecast Revenue (2035) | USD 1,410.1 Billion |
| CAGR (2026-2035) | 18.0% |
| Base Year for Estimation | 2025 |
| Historic Period | 2020-2024 |
| Forecast Period | 2026-2035 |
| Report Coverage | Revenue Forecast, Market Dynamics, Competitive Landscape, Recent Developments |
| Segments Covered | By Business Model / Customer Type (B2B (Enterprise SaaS, Mid-Market, SMB), B2C), By Application / Solution Type (Customer Relationship Management (CRM), Enterprise Resource Planning (ERP), Human Capital Management (HCM/HRM), Collaboration & Communication, Accounting & Finance), By Deployment Model (Public Cloud, Private Cloud, Hybrid Cloud), By Organization Size (Large Enterprises, Small & Medium Enterprises (SMEs)), By Industry Vertical (IT & Telecom, Banking, Financial Services & Insurance (BFSI), Healthcare & Life Sciences, Manufacturing, Government & Public Sector, Energy & Utilities, Others) |
| Regional Analysis | North America – US, Canada; Europe – Germany, France, The UK, Spain, Italy, Rest of Europe; Asia Pacific – China, Japan, South Korea, India, Australia, Singapore, Rest of APAC; Latin America – Brazil, Mexico, Rest of Latin America; Middle East & Africa – GCC, South Africa, Rest of MEA |
| Competitive Landscape | Microsoft Corporation, Salesforce, Inc., SAP SE, Adobe Inc., Oracle Corporation, Amazon Web Services (AWS), Google LLC (Alphabet Inc.), ServiceNow, Inc., Workday, Inc., IBM Corporation, Atlassian Corporation, Zendesk, Inc., Intuit Inc., Cisco Systems, Inc., Splunk Inc. (Cisco) |
| Customization Scope | Customization for segments and region/country-level will be provided. Moreover, additional customization can be done based on the requirements. |
| Purchase Options | We have three licenses to opt for: Single User License, Multi-User License (Up to 5 Users), Corporate Use License (Unlimited Users and Printable PDF) |





























