


Report Overview
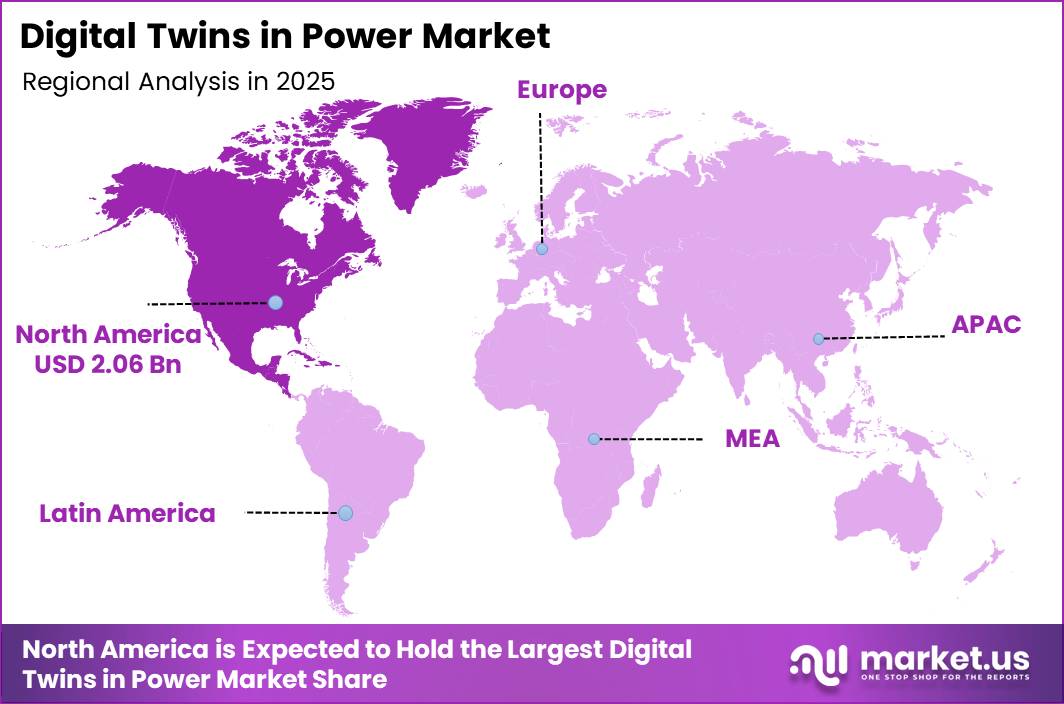
In 2025, the Global Digital Twins in Power Market was valued at USD 5.7 billion. The market is projected to grow at a CAGR of 28.0% during 2026–2035, reaching approximately USD 66.1 billion by 2035. North America dominated the global market in 2025, accounting for more than 36.1% of the total market share and generating approximately USD 2.06 billion in revenue.
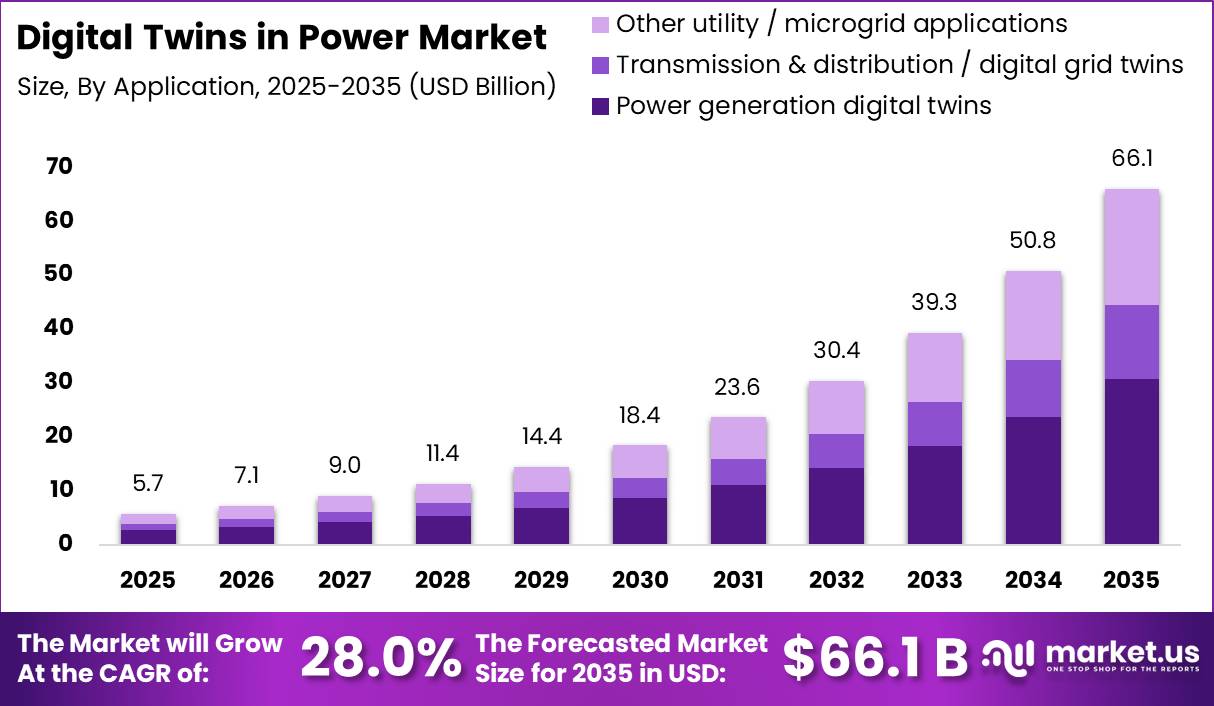
This growth is supported by the rapid digitalization of electricity networks worldwide. According to the International Energy Agency, global electricity demand increased by around 4.3% in 2024, while low-carbon power sources continued to gain a larger share of electricity generation. This transition is making power grids more distributed and complex, increasing the need for real-time monitoring, simulation, and asset management solutions.
Digital-related investment in grid technologies has increased by more than 50% since 2015 and is expected to account for nearly 19% of total grid investment. Digital twins enable utilities to model thousands of power assets, test maintenance plans, predict equipment failures, and optimize electricity flows without disrupting live operations. Annual grid investment of approximately USD 375–400 billion further creates strong demand for these platforms.
North America’s leadership is supported by its large and modernizing power infrastructure. United States electricity generation reached nearly 4.3 million GWh in 2024, supported by around 1,352 GW of installed capacity. More than 52 GW of new generation capacity and nearly 12 GW of battery storage were added during the year.
Key Takeaway
- The Digital Twins in Power Market was valued at USD 5.7 billion in 2025.
- The market is projected to reach USD 66.1 billion by 2035, growing at a CAGR of 28.0% during 2026–2035.
- Power generation digital twins dominated the market with a 46.6% share, supported by 4,448 GW of global renewable capacity.
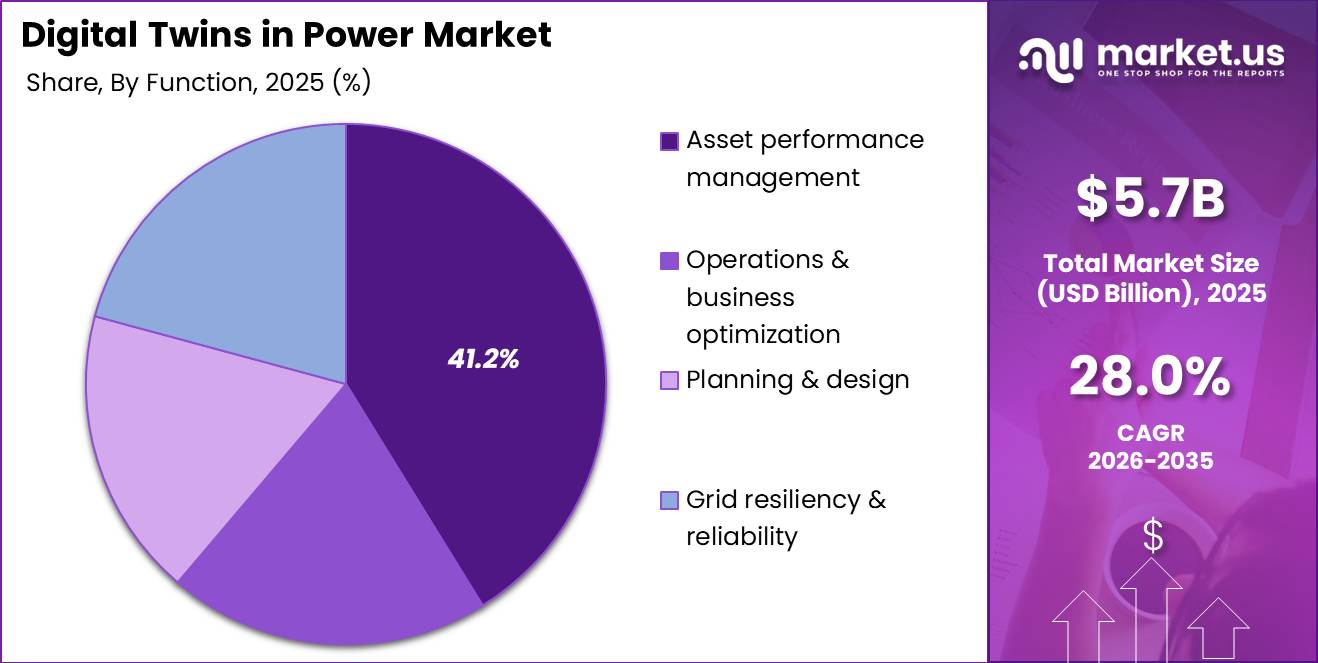
- Asset performance management held a leading 41.2% share due to rising demand for efficient management of aging power assets.
- System twins accounted for a dominant 46.7% share as utilities increasingly adopted complete network-level digital models.
- North America led the market with a 36.1% share and revenue of approximately USD 2.06 billion in 2025.
By Application
Power Generation Digital Twins held a leading 46.6% market share, supported by the rapid expansion of generation assets worldwide. According to IRENA, global renewable power capacity reached 4,448 GW in 2024, rising by 15.1% within one year. Solar power capacity alone increased to 1,865 GW after 452 GW of new installations were added.
IRENA also reported that solar and wind represented 96.6% of all new power capacity added in 2024. As these energy sources produce variable output, operators require continuous forecasting and digital simulation to maintain grid stability. The growing number of renewable and conventional power plants, combined with rising asset complexity.
By Function
Asset Performance Management held a leading 41.2% share of the Digital Twins in Power Market, driven by the need to improve the performance of aging and high-cost power assets. According to World Bank data, electricity transmission and distribution losses account for around 8–10% of total power output worldwide.
These losses represent hundreds of terawatt-hours of wasted electricity each year and create billions of dollars in avoidable costs for utilities. Major power assets, including generators, transformers, and high-voltage transmission lines, are regularly exposed to heat, corrosion, heavy loads, and mechanical fatigue.
By Twin Type
System twins held a leading 46.7% share of the Digital Twins in the power market, supported by the growing need to manage complete electricity networks instead of individual assets. According to the International Energy Agency’s Renewable Energy Progress Tracker, global renewable capacity additions were expected to reach around 666 GW in 2024 and increase to nearly 935 GW annually by 2030. Utility-scale and distributed solar PV are projected to account for almost 80% of this expansion.
The IEA also reported that distributed solar applications across residential, commercial, industrial, and off-grid systems will represent nearly 40% of total solar PV growth. This expansion is adding millions of small and variable power generation and storage units to electricity grids, making system management more complex.
Key Market Segments
By Application
- Power generation digital twins (gas/steam, wind, hydro, solar)
- Transmission & distribution / digital grid twins
- Other utility/microgrid applications
By Function
- Asset performance management
- Operations & business optimization
- Planning & design
- Grid resiliency & reliability
By Twin Type
- System twins
- Process twins
- Product/asset twins
Geopolitical Impact Analysis
Geopolitical tensions are changing the cost and delivery structure of the Digital Twins in Power Market by disrupting the hardware, cloud, and energy supply chains required for deployment. According to the World Trade Organization, average U.S. tariffs on electrical machinery and equipment imported from China increased from around 4% to more than 19% during the 2018–2020 tariff escalation. This raised the cost of sensors, communication equipment, industrial controllers, and other hardware used in digital twin systems.
UNCTAD also reported that Red Sea and Suez Canal disruptions between October 2023 and June 2024 reduced vessel transits by approximately 42%. During the same period, Shanghai–Europe spot container rates increased by 256%, while Asia–Europe shipping times rose by 10–14 days. These conditions are increasing project costs, inventory requirements, and delivery times for utilities and equipment suppliers across Europe, the Middle East, and Africa.
Energy price volatility is creating an additional impact on digital twin investments. According to the European Commission, average European wholesale electricity prices reached 230 €/MWh in 2022, representing a 121% increase from 2021. The rise was mainly linked to the Russia–Ukraine conflict and higher natural gas prices. EU LNG imports also increased by 70% year-on-year.
Higher electricity prices raise the operating cost of data centres, cloud platforms, and edge computing systems. However, they also increase the financial value of digital twins by helping utilities reduce outages, improve asset performance, and optimize fuel use. As a result, digital twins are increasingly viewed as a risk-management tool against energy price shocks, supply disruptions, and rising infrastructure costs.
Regional Analysis
North America held the leading position in the Digital Twins in Power Market, accounting for 36.1% of global revenue and generating approximately USD 2.06 billion. The region benefits from highly digitalized power infrastructure, strong regulatory support for grid resilience, and early adoption of cloud computing, advanced analytics, and real-time monitoring systems.
Latin America is expected to be the fastest-growing regional market. Brazil, Chile, and Mexico are increasing investments in utility-scale solar, wind, and hydropower projects while upgrading aging grid infrastructure. Lower historical levels of digitalization allow each new investment to create a stronger operational impact.
High smart grid penetration, growing renewable energy capacity, expanding battery storage, and the presence of established technology providers have created a mature market for digital twins across power generation, transmission, and distribution networks. Europe remains an important market due to strict decarbonization targets, grid reliability requirements, and the integration of cross-border electricity systems.
Asia Pacific is developing into a major demand centre as China, India, South Korea, and Southeast Asian countries expand power generation capacity and transmission infrastructure. Digital twins help operators manage mixed energy systems, large power plants, and rapidly growing electricity networks.
Key Regions and Countries
North America
- US
- Canada
Europe
- Germany
- France
- The UK
- Spain
- Italy
- Rest of Europe
Asia Pacific
- China
- Japan
- South Korea
- India
- Australia
- Rest of APAC
Latin America
- Brazil
- Mexico
- Rest of Latin America
Middle East & Africa
- GCC
- South Africa
- Rest of MEA
Market Dynamics
Drivers
| Driver | (~) % CAGR | Geographic Relevance | Impact Timeline |
|---|---|---|---|
| Grid reliability & resilience optimization | +4.0% | North America, Europe, East Asia | Short term (≤ 2 years) |
| Integration of variable renewables | +3.2% | Europe, China, India, Latin America | Medium term (2–4 years) |
| Asset performance & predictive maintenance | +3.0% | Global | Short term (≤ 2 years) |
| Regulatory push for advanced grid planning | +2.5% | North America, EU | Medium term (2–4 years) |
| Digitalization of transmission & distribution utilities | +2.0% | Global tier-1 utilities | Short term (≤ 2 years) |
| Lifecycle simulation in new-build power projects | +1.8% | GCC, East Asia, emerging Asia | Long term (≥ 4 years) |
Grid reliability & resilience optimization
Growing outage costs and extreme-weather events are pushing system operators to adopt digital twins that can simulate contingencies across tens of thousands of grid nodes and assets, enabling faster N–1 and N–2 security assessments and driving an incremental uplift of around 4.0 percentage points on the baseline CAGR.
Between 2024 and 2026, major transmission and utility operators increasingly used grid-modeling and digital simulation environments to compress contingency-study cycles from weeks to hours, lowering curtailment exposure and improving operational planning.
This is shifting commercial models from one-time engineering studies toward recurring software and managed-service contracts, with software gross margins often reaching the mid-60% range versus traditional services in the mid-30% range.
Restraints
| Restraint | (~) % CAGR | Geographic Relevance | Impact Timeline |
|---|---|---|---|
| High upfront integration & modeling costs | -3.5% | Global | Short term (≤ 2 years) |
| Legacy SCADA & EMS/DMS limitations | -2.8% | Emerging markets, older grids | Medium term (2–4 years) |
| Cybersecurity & critical-infrastructure risk concerns | -2.5% | North America, Europe, East Asia | Short term (≤ 2 years) |
| Constrained utility IT/OT budgets | -2.2% | Developing economies | Short term (≤ 2 years) |
| Slow regulatory cost-recovery approvals | -1.8% | Regulated monopoly markets | Medium term (2–4 years) |
| Limited interoperability with vendor ecosystems | -1.5% | Global | Long term (≥ 4 years) |
High upfront integration & modeling costs
Digital twins in power require detailed asset, network, and operational models calibrated against years of SCADA, PMU, and maintenance data, causing initial implementation programs at large utilities to span multi-year integration roadmaps and consume roughly 5–10% of annual IT/OT capex, which supports an estimated deduction of around 3.5 percentage points from the baseline CAGR.
Integration across protection relays, GIS, EMS/DMS, and asset management platforms can require thousands of man-hours, with data preparation and validation often accounting for 40–60% of total program cost rather than software licensing alone. Strategically, this delays full-scale rollouts, compresses services margins, and forces utilities to phase deployments around mandatory grid-hardening and core modernization budgets first.
Challenges
| Challenge | (~) % CAGR | Geographic Relevance | Mitigation Horizon |
|---|---|---|---|
| Data governance & model fidelity | -3.0% | Global | Long term (≥ 4 years) |
| Shortage of power-domain data scientists | -2.7% | North America, Europe, Asia-Pacific | Medium term (2–4 years) |
| Real-time computation scalability limits | -2.4% | High-renewables grids | Medium term (2–4 years) |
| Inconsistent standards for twin architectures | -2.1% | Global | Long term (≥ 4 years) |
| Cultural resistance within utilities | -1.9% | Legacy utilities worldwide | Medium term (2–4 years) |
| Complex coordination among TSOs/DSOs | -1.7% | Europe, interconnected grids | Long term (≥ 4 years) |
Data governance & model fidelity
Digital twins in power systems depend on consistent data from thousands to millions of assets, yet many utilities still operate with incomplete asset registries, uneven GIS coverage, and SCADA histories sampled at different intervals, creating a structural friction drag of about 3.0 percentage points against the market’s full growth potential.
Achieving a model accurate enough for advanced state estimation and stability analysis commonly requires correction of errors in roughly 10–20% of equipment records and continuous topology updates as DERs and flexible loads are added. This forces utilities to build permanent data-governance functions rather than one-time cleanup efforts, increasing operating overhead but improving long-run planning confidence and reducing future model-maintenance costs by an estimated 20–30%.
Opportunities
| Opportunity | (~) % CAGR | Geographic Relevance | Execution Window |
|---|---|---|---|
| Federated cross-border grid twins | +3.3% | Europe, North America, regional interconnections | Long term (≥ 4 years) |
| DER & prosumer participation modeling | +3.0% | Europe, US, East Asia | Medium term (2–4 years) |
| Performance-based regulation enablement | +2.6% | OECD markets | Medium term (2–4 years) |
| New service models for OEMs & EPCs | +2.4% | Global | Long term (≥ 4 years) |
| Training, simulation & workforce upskilling | +2.1% | Global | Short term (≤ 2 years) |
| AI-enhanced predictive grid operations | +2.0% | Advanced grids worldwide | Long term (≥ 4 years) |
Federated cross-border grid twins
Federated cross-border grid twins remain future upside rather than a current driver because most deployments are still confined to individual utilities or national systems, leaving regional interoperability, shared scenario analysis, and coordinated cross-border balancing as underpenetrated white space that could add about 3.3 percentage points above the baseline CAGR if executed well.
As interconnected systems move toward shared boundary-condition modeling across dozens of control areas and very large installed capacity pools. For vendors and utilities, this creates new monetization in multi-operator planning platforms and coordination services, with software-led gross margins in the high-60% range and per-utility advanced study costs potentially falling by 20–25% through shared modeling frameworks.
Key Players Analysis
Tier–1 companies in the Digital Twins in Power Market include Siemens AG, GE Vernova, ABB, Schneider Electric, Emerson, and Hitachi Energy. These companies benefit from large installed bases, global service networks, and strong experience across power generation, transmission, and distribution.
Siemens recorded revenue of approximately €75.9 billion in fiscal 2024, while its Digital Industries and Smart Infrastructure businesses together generated well above €30 billion. This financial and technical scale supports large digital twin projects for utilities. GE Vernova reported that its power and digital solutions support more than 7,000 critical grid assets. The company also invested around USD 600 million in U.S. facilities and grid-related innovation during 2023–2024.
ABB and Schneider Electric generate multi-billion-dollar revenue from electrification and energy management activities. Together, Tier-1 vendors are estimated to hold around 22–25% of the market, with Siemens accounting for a mid-single-digit share. Tier–2 participants include Microsoft, IBM, SAP, Dassault Systèmes, ANSYS, PTC, Bentley Systems, Hexagon, and AVEVA. These companies compete mainly through cloud computing, artificial intelligence, engineering software, and simulation tools.
Microsoft’s Intelligent Cloud revenue increased by USD 17.5 billion year-on-year in fiscal 2024, while Azure and related services grew by 22–30%. IBM employed approximately 160,000 consultants focused on data, artificial intelligence, and hybrid cloud. Tier-2 software and platform companies are estimated to represent around 15–20% of market revenue, often working with Tier-1 equipment manufacturers.
Top Key Players in the Market
- Siemens AG
- GE Vernova / General Electric Company
- ABB Ltd
- Schneider Electric SE
- Emerson Electric Co.
- AVEVA Group plc
- Microsoft Corporation
- IBM Corporation
- SAP SE
- ANSYS, Inc.
- Dassault Systèmes SE
- PTC Inc.
- Bentley Systems, Incorporated
- Hexagon AB
- Hitachi Energy Ltd.
Recent Developments
- In June 2026, ABB expanded its collaboration with NVIDIA to support digital twin modelling for AI data-centre power systems. ABB is integrating SimReady 3D models of medium-voltage switchgear, electrical distribution equipment, and uninterruptible power supply platforms into the NVIDIA Omniverse DSX Blueprint.
- In March 2025, Schneider Electric and ETAP introduced a grid-to-chip digital twin for AI factory power systems using NVIDIA Omniverse Cloud APIs. The platform combines electrical, mechanical, thermal, and network information to model changing power demand at the chip level.
- In March 2026, Schneider Electric and ETAP launched a physics-based digital twin for utilities and critical infrastructure. Validated across more than 50,000 installations, the platform can support up to 40% faster distributed energy resource connections and reduce unnecessary protection trips by 30%.
Report Scope
| Report Features | Description |
|---|---|
| Market Value (2025) | USD 5.7 Billion |
| Forecast Revenue (2035) | USD 66.1 Billion |
| CAGR (2026-2035) | 28.0% |
| Base Year for Estimation | 2025 |
| Historic Period | 2020-2024 |
| Forecast Period | 2026-2035 |
| Report Coverage | Revenue Forecast, Market Dynamics, Competitive Landscape, Recent Developments |
| Segments Covered | By Application (Power generation digital twins, Transmission & distribution / digital grid twins, Other utility/microgrid applications); By Function (Asset performance management, Operations & business optimization, Planning & design, Grid resiliency & reliability); By Twin Type (System twins, Process twins, Product/asset twins) |
| Regional Analysis | North America – US, Canada; Europe – Germany, France, The UK, Spain, Italy, Rest of Europe; Asia Pacific – China, Japan, South Korea, India, Australia, Singapore, Rest of APAC; Latin America – Brazil, Mexico, Rest of Latin America; Middle East & Africa – GCC, South Africa, Rest of MEA |
| Competitive Landscape | Siemens AG, GE Vernova / General Electric Company, ABB Ltd, Schneider Electric SE, Emerson Electric Co., AVEVA Group plc, Microsoft Corporation, IBM Corporation, SAP SE, ANSYS, Inc., Dassault Systèmes SE, PTC Inc., Bentley Systems, Incorporated, Hexagon AB, Hitachi Energy Ltd. |
| Customization Scope | Customization for segments and region/country-level will be provided. Moreover, additional customization can be done based on the requirements. |
| Purchase Options | We have three licenses to opt for: Single User License, Multi-User License (Up to 5 Users), Corporate Use License (Unlimited Users and Printable PDF) |





























