


Report Overview
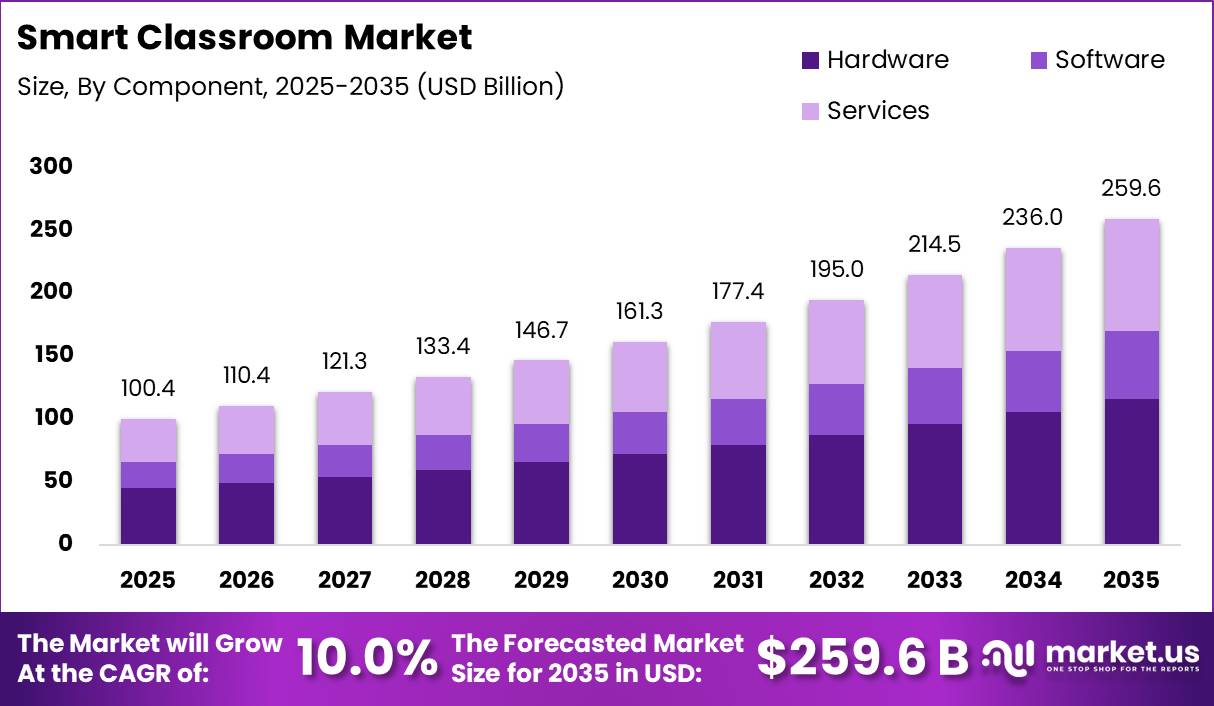
In 2025, the Global Smart Classroom Market was valued at USD 100.4 billion. The market is projected to grow at a CAGR of 10.0% during 2026–2035, reaching approximately USD 259.6 billion by 2035. North America dominated the global market in 2025, accounting for more than 38.9% of the total market share and generating approximately USD 39.06 billion in revenue. Market growth is supported by increasing investment in digital education infrastructure, connected learning deconnected learning devicevices, and online education platforms.
According to the World Bank, many countries allocate around 4–6% of GDP to education. Combined global education spending by governments, households, and donors is approaching USD 5 trillion annually. UNESCO estimates that an annual financing gap of nearly USD 100 billion must be addressed to achieve SDG 4 targets by 2030. With around 272 million children still out of school, education authorities are increasing the use of digital and blended learning systems to improve access and learning outcomes.
North America benefits from strong technology adoption, advanced education systems, and high spending per student. UNESCO and OECD data show that developed economies often spend more than USD 10,000 per student each year in primary and secondary education. Redirecting even 5–10% of education budgets toward technology over replacement cycles of 3–5 years can create tens of billions of dollars in recurring demand for smart classroom products and services.
Key Takeaway
- The Smart Classroom Market reached USD 100.4 billion in 2025 and is projected to grow to USD 259.6 billion by 2035 at a 10.0% CAGR.
- Hardware dominated the component segment in 2025 with a 44.7% share, driven by demand for displays, projectors, servers, routers, laptops, and tablets.
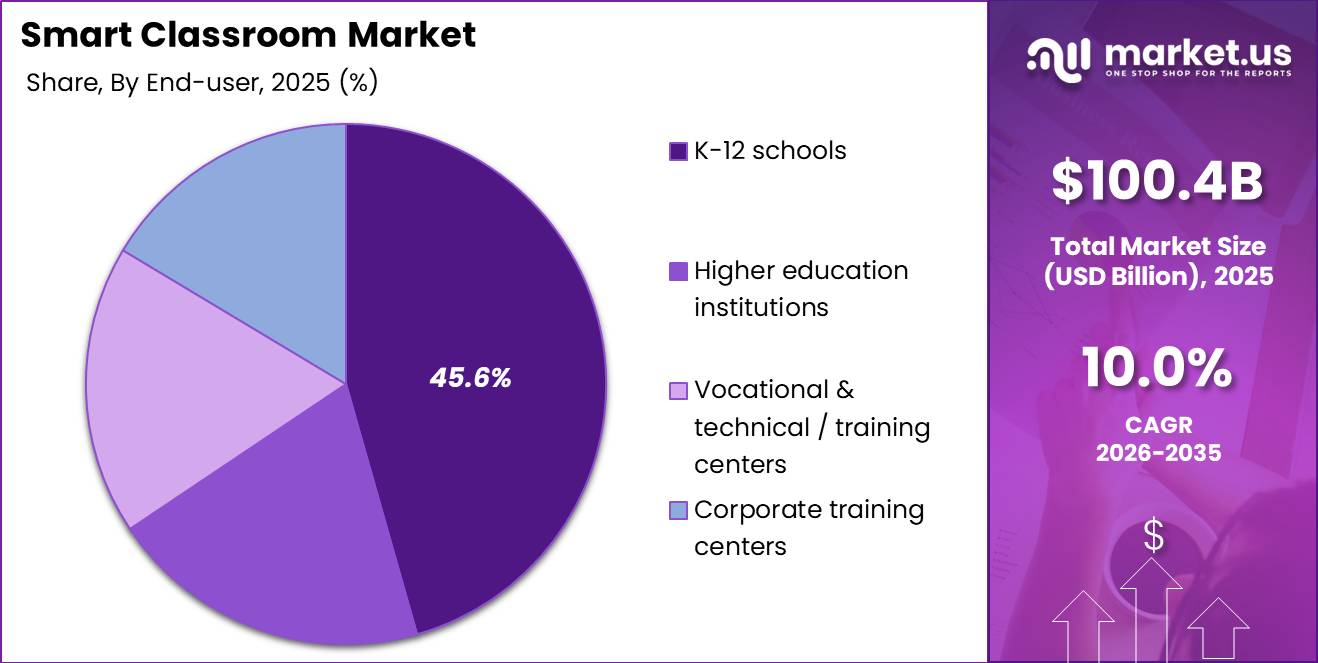
- K–12 schools accounted for the largest end-user share of 45.6% in 2025, supported by a global base of nearly 1.4 billion learners.
- Learning and content systems led the education system segment with a 34.9% share in 2025, supporting digital teaching, assessment, collaboration, and personalized learning.
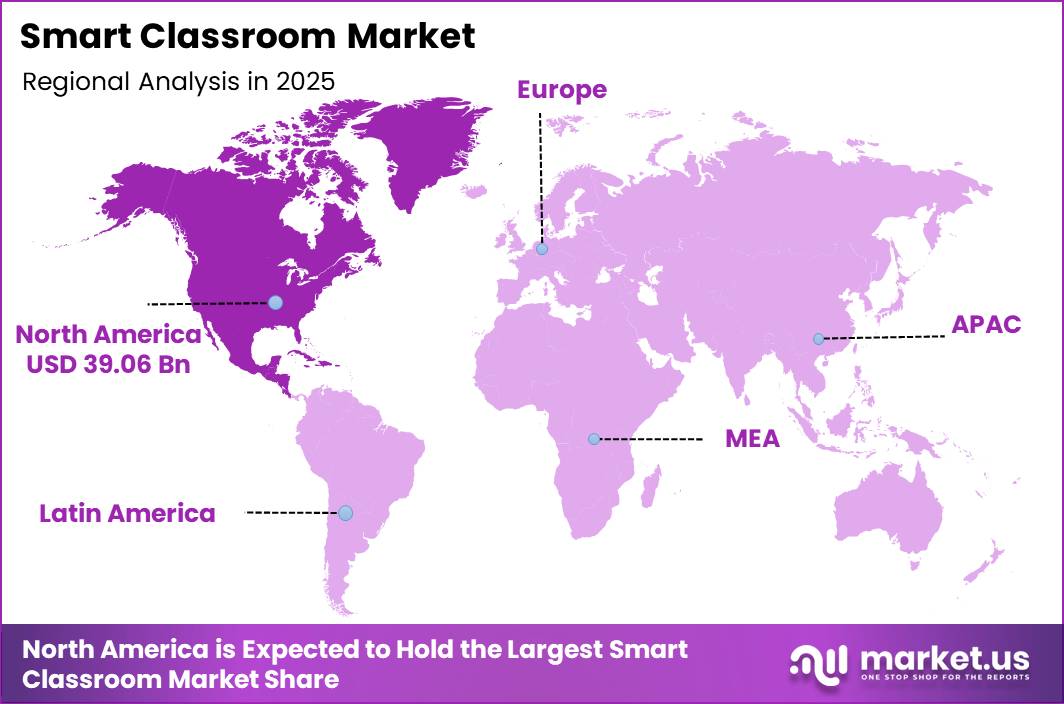
- North America led the market in 2025 with a 38.9% share, generating approximately USD 39.06 billion in revenue.
By Component
In 2025, Hardware held a dominant 44.7% share of the Smart Classroom Market. Its leadership is supported by the essential role of physical infrastructure, including interactive displays, projectors, routers, servers, laptops, tablets, and other student devices. These products represent a major upfront investment for schools and also require regular maintenance and replacement. According to the OECD, around 3 in 4 students across member countries have access to digital devices and the internet when needed.
This reflects the large number of devices already used across classrooms and homes. Most equipment is upgraded within replacement cycles of approximately 3–5 years, creating recurring demand for new hardware. Government programs focused on reducing the digital divide and improving school connectivity under SDG 4 are also increasing investment in classroom networks, access points, and connected learning devices.
By End-user
In 2025, K–12 schools held a dominant 45.6% share of the Smart Classroom Market. The segment benefits from its large and structured student base, with nearly 1.4 billion learners enrolled in primary and secondary education worldwide as of 2024. This scale creates strong demand for interactive displays, student devices, internet connectivity, digital content, and learning management platforms.
UNICEF data shows that secondary education enrolment increased by tens of millions of students between 2000 and 2020. During the same period, the number of out-of-school adolescents declined from 98 million to 63 million at the lower-secondary level and from 175 million to 132 million at the upper-secondary level. This expansion in school participation increases the number of classrooms requiring digital learning infrastructure.
Global completion rates have also improved to 88% for primary education and 78% for lower-secondary education. As governments focus on student retention, curriculum modernization, longer learning hours, assessments, and remedial education, schools are increasing investment in smart boards, tablets, classroom software, and data-based learning tools.
By Education System
In 2025, Learning and Content systems held a dominant 34.9% share of the Smart Classroom Market. These systems form the central layer that converts classroom hardware and internet connectivity into teaching, assessment, collaboration, and personalized learning. Learning management systems, digital course platforms, online assessment tools, and educational content libraries are now widely used across schools and universities.
The OECD Digital Education Outlook indicates that most schools across member countries use learning management systems and other digital tools at different education levels. These platforms support millions of classes and tens of millions of students each day, creating strong recurring demand for software subscriptions, digital content, and platform upgrades.
Key Market Segments
By Component
- Hardware
- Software
- Services
By End-user
- K–12 schools
- Higher education institutions
- Vocational & technical / training centers
- Corporate training centers
By Education System
- Learning/content systems
- Collaboration & classroom management systems
- Assessment & student response systems
- Other applications
Geopolitical Impact Analysis
Geopolitical tensions are increasing costs and delivery delays across the Smart Classroom Market supply chain, affecting displays, computers, networking equipment, servers, and other digital learning hardware. UNCTAD reported that container ship transits through the Suez Canal declined by 67%, while total canal transits fell by 42%. Panama Canal transits also decreased by 49%, forcing many shipments between Asia, Europe, and the Americas to use longer routes around the Cape of Good Hope.
These disruptions pushed average container spot freight rates from Shanghai up by 122%, including a 256% increase on routes to Europe. Higher fuel, insurance, and operating costs have also affected shipments of laptops, interactive panels, routers, and other equipment assembled in East Asia. As a result, landed hardware costs can rise by double digits, while delivery times may increase by 10–20 days on major trade routes.
Trade policy pressures are also affecting electronic components and finished information and communication technology products. WTO tariff profiles show that major economies apply MFN duties of around 2–7% on many electronic integrated circuits and 2–4% on laptops and data-processing machines. Recent trade actions tracked by the WTO and IMF indicate that effective duties on selected ICT products have increased by several percentage points in some bilateral trade flows.
An additional tariff increase of 3–5% on displays, memory chips, or portable computers can add tens of dollars to each unit and hundreds of thousands of dollars to large school-district deployments. Energy price volatility reported by the IEA and longer shipping routes further increase manufacturing and transportation costs, placing continued pressure on smart classroom hardware, software, and service pricing.
Regional Analysis
In 2025, North America dominated the Smart Classroom Market with a 38.9% share, generating approximately USD 39.06 billion in revenue. The region’s leading position is supported by high technology adoption across K–12 schools, universities, and corporate training centers. Strong education and information technology budgets, reliable broadband networks, and widespread one-to-one device programs continue to support demand for interactive displays, learning and content platforms, student devices, and classroom management software.
Asia Pacific is expected to be the fastest-growing region due to expanding student populations, large digital education programs, and rising investment in school connectivity. Increasing enrolment across China, India, Southeast Asia, and other developing economies is encouraging governments and private education providers to introduce technology-enabled classrooms in urban and semi-urban areas.
Europe, Latin America, and the Middle East & Africa remain important regional markets, although growth is generally slower because of differences in public spending, internet access, and device availability. North America is expected to remain the revenue leader, while Asia Pacific continues to narrow the gap through large-scale deployments and long-term national digital education strategies.
Key Regions and Countries
North America
- US
- Canada
Europe
- Germany
- France
- The UK
- Spain
- Italy
- Rest of Europe
Asia Pacific
- China
- Japan
- South Korea
- India
- Australia
- Rest of APAC
Latin America
- Brazil
- Mexico
- Rest of Latin America
Middle East & Africa
- GCC
- South Africa
- Rest of MEA
Market Dynamics
Drivers
| Driver | (~) % CAGR | Geographic Relevance | Impact Timeline |
|---|---|---|---|
| Government Mandate Driven Infrastructure Rollouts | +2.8% | Asia Pacific (India, China, Southeast Asia), Middle East | Short term (≤ 2 years) |
| AI and Adaptive Learning Platform Adoption | +2.3% | North America, Western Europe, East Asia | Medium term (2 to 4 years) |
| Post Pandemic Hybrid Learning Normalization | +1.7% | Global, with highest velocity in North America and Europe | Short term (≤ 2 years) |
| Rising Demand for Interactive Flat Panels and AV Hardware Refresh | +1.5% | North America, Western Europe, Gulf Cooperation Council | Short term (≤ 2 years) |
| Cloud Based LMS and SaaS Content Delivery Expansion | +1.2% | Global, led by North America, Australia, United Kingdom | Medium term (2 to 4 years) |
| Corporate and Vocational Training Sector Entry | +0.5% | North America, Europe, India | Long term (≥ 4 years) |
Government Mandate Driven Infrastructure Rollouts
Government-backed procurement programs are becoming a major long-term growth driver for the Smart Classroom Market. In India, the Samagra Shiksha scheme had approved 146,040 smart classrooms across government schools by May 2025. Each eligible school can receive a non-recurring grant of INR 240,000 for interactive boards, licensed devices, and connectivity equipment.
The PM SHRI program also plans to upgrade more than 14,500 schools into model institutions under a 60:40 central and state funding structure. The Union Budget 2025 further supported broadband connectivity for government secondary schools in rural areas through BharatNet, creating a predictable multi-year demand pipeline for classroom hardware and digital services.
Large public tenders can reduce hardware gross margins by around 8–12% compared with retail sales. However, they involve very low customer acquisition costs and can generate recurring revenue from maintenance, content, training, and software contracts. Similar digital education programs across China, Gulf countries, and Southeast Asia are also supporting synchronized replacement and new classroom deployment cycles.
Restraints
| Restraint | (~) % CAGR | Geographic Relevance | Impact Timeline |
|---|---|---|---|
| Student Data Privacy Regulation and Compliance Cost Burden | -2.1% | United States, European Union, India (DPDP Act 2023) | Short term (≤ 2 years) |
| High Upfront Capital Expenditure for Hardware Deployment in Under Resourced Institutions | -1.8% | Sub Saharan Africa, South and Southeast Asia, Latin America | Short term (≤ 2 years) |
| Inconsistent Power and Broadband Infrastructure in Rural Markets | -1.4% | Rural India, Sub Saharan Africa, parts of Southeast Asia | Medium term (2 to 4 years) |
| Tariff Escalation on Imported Electronic Components | -1.0% | United States, India, Southeast Asia | Short term (≤ 2 years) |
| Budget Austerity and Delayed Public Education Spending after Fiscal Tightening | -0.8% | Western Europe, parts of Latin America | Medium term (2 to 4 years) |
Student Data Privacy Regulation and Compliance Cost Burden
Different student data privacy rules are increasing compliance costs and delaying smart classroom procurement. In the United States, FERPA limits how vendors use student data, while COPPA requires parental consent for children under 13. State laws, including those in California, also restrict commercial profiling and reduce the scope for advertising-supported business models.
In the European Union, GDPR requires public education institutions to appoint Data Protection Officers, support data deletion requests, and manage cross-border transfers. These requirements can add an estimated 15–25% to the annual information technology capital spending of a mid-sized education platform. India’s Digital Personal Data Protection Act 2023, supported by rule-setting during 2024 and 2025, requires verifiable parental consent for users under 18.
These compliance requirements may extend vendor onboarding and institutional approval timelines by around 3–6 months, as schools conduct privacy and data protection reviews. Software-focused providers may also experience net margin pressure of approximately 4–7 percentage points due to higher spending on legal teams, security systems, and compliance engineering. Privacy restrictions can further limit high-margin features such as biometric engagement tracking, behavioural analytics, and advertising-based data monetization.
Challenges
| Challenge | (~) % CAGR | Geographic Relevance | Mitigation Horizon |
|---|---|---|---|
| Teacher Digital Literacy Gap | -1.9% | Global, most acute in South Asia, Sub Saharan Africa, Latin America | Medium term (2 to 4 years) |
| Hardware Supply Chain Concentration Risk | -1.3% | Global with dependence on East Asian manufacturing hubs | Long term (≥ 4 years) |
| Fragmented LMS and Platform Interoperability | -1.0% | Global, especially in North America and Europe multi vendor environments | Medium term (2 to 4 years) |
| Content Localization and Multilingual Depth | -0.8% | India, Southeast Asia, Middle East, Sub Saharan Africa | Long term (≥ 4 years) |
| Device Lifecycle and E Waste Cost Management | -0.5% | Western Europe, North America, East Asia | Long term (≥ 4 years) |
Teacher Digital Literacy Gap
The single largest ceiling constraint on realizing the Smart Classroom Market’s growth potential is not hardware availability or software capability but the persistent structural deficit in educator readiness to use installed technology effectively. Deployments of interactive flat panels, artificial intelligence driven adaptive learning platforms, and cloud based learning management environments routinely achieve utilization rates of only 30 to 45% of installed feature capacity within the first 12 months after installation.
Teacher training costs for a single school in India typically range from around ₹5,000 to ₹15,000 per school for on site onboarding, and this figure excludes the recurring cost of continuous professional development. When 60 to 75% teacher adoption rates, a commonly cited minimum threshold for positive learning outcome impact, are not achieved within about 3 months of deployment, institutions often defer second phase hardware refresh cycles, which suppresses repeat purchase revenue for vendors.
The long term corporate adjustment required is a shift from treating teacher training as a cost recovery line item in hardware contracts toward bundling it as a multi year professional development subscription tied to platforms, which is estimated to add around 8 to 14% to annual recurring revenue per contract while structurally improving retention and renewal rates for providers.
Opportunities
| Opportunity | (~) % CAGR | Geographic Relevance | Execution Window |
|---|---|---|---|
| SaaS and Subscription Based Content Monetization | +2.6% | Global, led by North America, Europe, East Asia | Medium term (2 to 4 years) |
| Emerging Market Greenfield School Digitization | +1.8% | Sub Saharan Africa, South and Southeast Asia, Latin America | Long term (≥ 4 years) |
| AR VR and Immersive Learning Integration | +1.5% | North America, Europe, East Asia, Gulf Cooperation Council | Long term (≥ 4 years) |
| Higher Education and University Campus Modernization | +1.2% | North America, Western Europe, Australia, India | Medium term (2 to 4 years) |
| AI Powered Learning Analytics and Outcome Based Pricing | +1.0% | North America, United Kingdom, Australia, Singapore | Long term (≥ 4 years) |
| Private and Special Needs Education Vertical Expansion | +0.6% | North America, Western Europe | Medium term (2 to 4 years) |
SaaS and Subscription Based Content Monetization
This opportunity represents future upside rather than a current market driver because the Smart Classroom Market remains largely hardware-led. Interactive flat panels, projectors, and device bundles account for most contract value, while software is often sold through one-time licenses or low-margin maintenance agreements.
A shift toward software-as-a-service content subscriptions could improve profitability. These agreements may include digital content libraries, AI-based assessments, learning management platforms, and teacher training. Hardware-only contracts generally generate gross margins of around 18–28%, while bundled subscription models can deliver recurring gross margins of approximately 65–80% at scale because cloud-based content has a low incremental delivery cost.
Subscription models can also improve revenue visibility and reduce dependence on irregular capital spending cycles. Customer acquisition cost recovery may decline from about 24–36 months under hardware-heavy models to nearly 8–14 months under subscription-focused models. To capture this opportunity, vendors must develop curriculum-aligned content and offer flexible pricing structures, including per-seat, per-school, and district-wide plans.
Key Players Analysis
Tier-1 companies in the Smart Classroom Market include Samsung Electronics, LG Corp, Microsoft, Google, Apple, Dell Technologies, and Cisco Systems. These large technology vendors support digital classrooms through hardware, software, cloud services, and collaboration platforms. Samsung reported KRW 333.6 trillion, or about USD 250–260 billion, in 2025 revenue, including KRW 14.8 trillion from Visual Display and Digital Appliances in Q4 2025.
The company is estimated to hold an 8–10% share of global interactive display and classroom monitor shipments. Microsoft Cloud generated USD 168 billion in FY25, while Azure reached USD 75 billion and Intelligent Cloud grew by 21–26% year over year. Dell’s Client Solutions Group recorded USD 48.4 billion in FY25 revenue, while Apple’s Mac and iPad products serve tens of millions of student devices. Apple and Dell are each positioned within the 5–8% share range for classroom computing devices. Cisco also generates multi-billion-dollar revenue from Webex and related collaboration services.
Tier-2 companies include SMART Technologies ULC, Promethean World, BenQ, ViewSonic, Panasonic, Lenovo, Boxlight, and Hitachi. These players mainly compete in interactive displays, projectors, and education-focused solutions. Promethean reported USD 267.4 million in 2024 revenue and targeted up to a 15% global share, supported by nearly USD 500 million in ActivPanel-related revenue. Dell generated USD 3.0 billion in Client Solutions operating income. Tier-2 specialists generally compete within a 2–5% global share range.
Top Key Players in the Market
- SMART Technologies ULC
- Promethean World Ltd.
- Samsung Electronics Co., Ltd.
- LG Corp.
- BenQ Corporation
- ViewSonic Corporation
- Panasonic Corporation
- Lenovo Group Limited
- Cisco Systems Inc.
- Microsoft Corporation
- Google LLC
- Dell Technologies Inc.
- Apple Inc.
- Boxlight Corporation
- Hitachi Ltd.
Recent Developments
- In June 2026, Samsung Electronics introduced new education tools for its Android-based Interactive Display range at ISTELive 26. The company added Samsung Account Management Solution, AI Assistant, and 3 new display models. Its WAHX-M series also introduced Samsung’s first 98-inch interactive display, alongside 65-inch, 75-inch, and 86-inch options for classrooms and lecture halls.
- In July 2025, Microsoft joined the American Federation of Teachers, OpenAI, Anthropic, and the United Federation of Teachers to launch the National Academy for AI Instruction. The USD 23 million initiative is designed to provide free AI training and curriculum support to 1.8 million AFT members, beginning with K–12 educators.
- In July 2025, SMART Technologies began global shipments of the SMART Board GX Plus, an affordable interactive display developed for budget-conscious schools. The product provides up to 40 touch points, built-in Android 13, SMART Ink annotation, over-the-air updates, and compatibility with Windows, Mac, and ChromeOS, strengthening the company’s position in classroom display solutions.
Report Scope
| Report Features | Description |
|---|---|
| Market Value (2025) | USD 100.4 Billion |
| Forecast Revenue (2035) | USD 259.6 Billion |
| CAGR (2026-2035) | 10.0% |
| Base Year for Estimation | 2025 |
| Historic Period | 2020-2024 |
| Forecast Period | 2026-2035 |
| Report Coverage | Revenue Forecast, Market Dynamics, Competitive Landscape, Recent Developments |
| Segments Covered | By Component (Hardware, Software, Services); By End-user (K–12 schools, Higher education institutions, Vocational & technical/training centers, Corporate training centers); By Education System (Learning/content systems, Collaboration & classroom management systems, Assessment & student response systems, Other applications) |
| Regional Analysis | North America – US, Canada; Europe – Germany, France, The UK, Spain, Italy, Rest of Europe; Asia Pacific – China, Japan, South Korea, India, Australia, Singapore, Rest of APAC; Latin America – Brazil, Mexico, Rest of Latin America; Middle East & Africa – GCC, South Africa, Rest of MEA |
| Competitive Landscape | SMART Technologies ULC, Promethean World Ltd., Samsung Electronics Co., Ltd., LG Corp., BenQ Corporation, ViewSonic Corporation, Panasonic Corporation, Lenovo Group Limited, Cisco Systems Inc., Microsoft Corporation, Google LLC, Dell Technologies Inc., Apple Inc., Boxlight Corporation, Hitachi Ltd. |
| Customization Scope | Customization for segments and region/country-level will be provided. Moreover, additional customization can be done based on the requirements. |
| Purchase Options | We have three licenses to opt for: Single User License, Multi-User License (Up to 5 Users), Corporate Use License (Unlimited Users and Printable PDF) |





























