


Report Overview
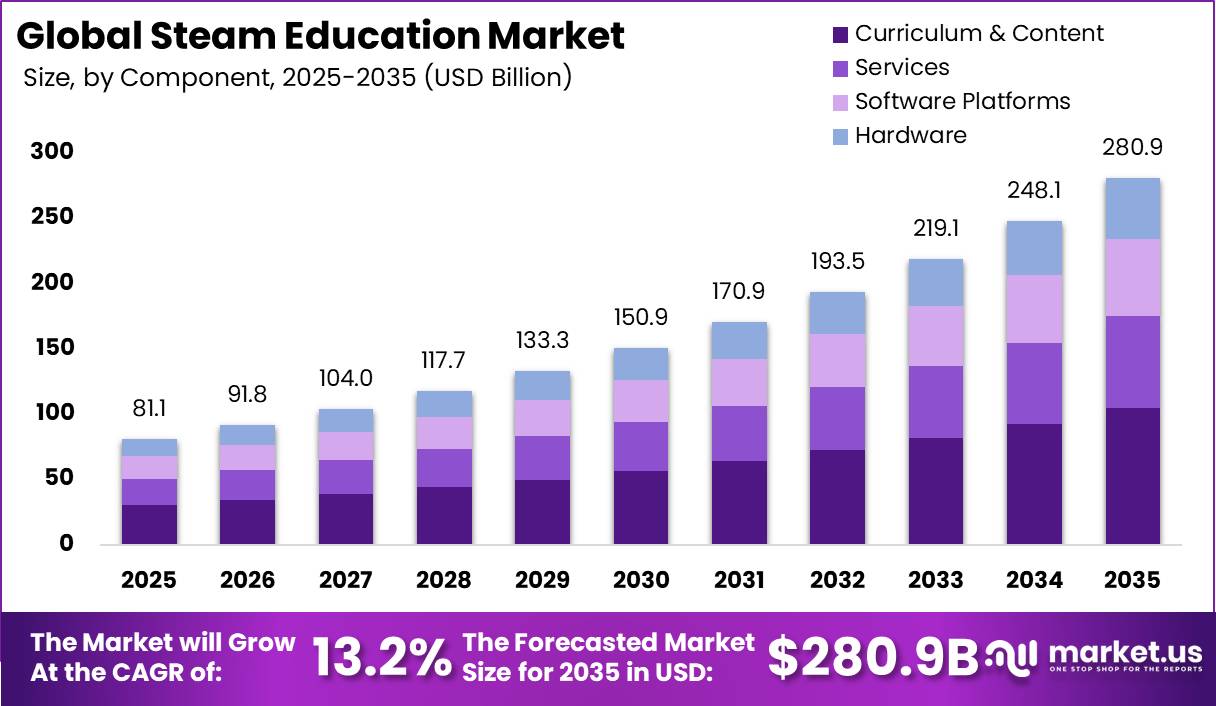
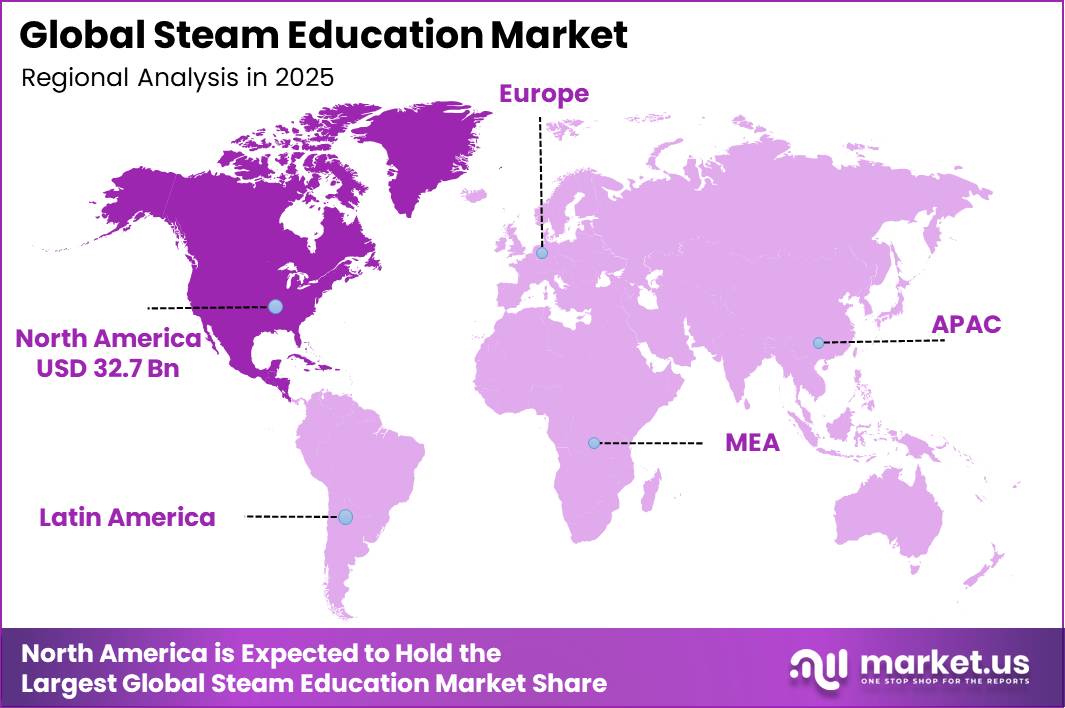
In 2025, the Steam Education Market was valued at USD 81.1 billion. The market is projected to grow at a CAGR of 13.2% during 2026–2035, reaching approximately USD 280.9 billion by 2035. North America dominated the global market in 2025, accounting for more than 40.3% of the total market share and generating approximately USD 32.7 billion in revenue.
According to UNESCO’s Global Education Monitoring work, global education spending reached USD 5.8 trillion in 2022, with 64% of this coming from high-income countries that are the main adopters of STEAM curriculum and digital learning tools. The World Bank reports that governments continue increasing investments in education, skills development, curriculum modernization, teacher training, digital learning resources, and laboratory infrastructure through large-scale education projects.
These investments are accelerating the adoption of STEAM platforms, educational software, robotics kits, coding tools, and interactive learning technologies across schools and higher education institutions. North America dominated the Global STEAM Education Market in 2025, accounting for more than 40.30% of the global market share and generating approximately USD 32.7 billion in revenue.
The region’s leadership is supported by high education spending, advanced digital infrastructure, and strong demand for STEM-skilled professionals. In the United States, annual public education spending is close to USD 1 trillion, while the U.S. Bureau of Labor Statistics projects STEM occupations to grow by 8.1% between 2024 and 2034, more than twice the growth rate of overall employment.
Key Takeaway
- The Global STEAM Education Market was valued at USD 81.1 billion in 2025 and is projected to reach USD 280.9 billion by 2035, expanding at a CAGR of 13.2% during the forecast period 2026–2035.
- By Component, Curriculum & Content dominated the market with a 37.4% share in 2025
- By Learning Type, Formal Education accounted for the largest market share of 56.7% in 2025
- By Technology, Cloud & LMS held the highest market share of 29.3% in 2025
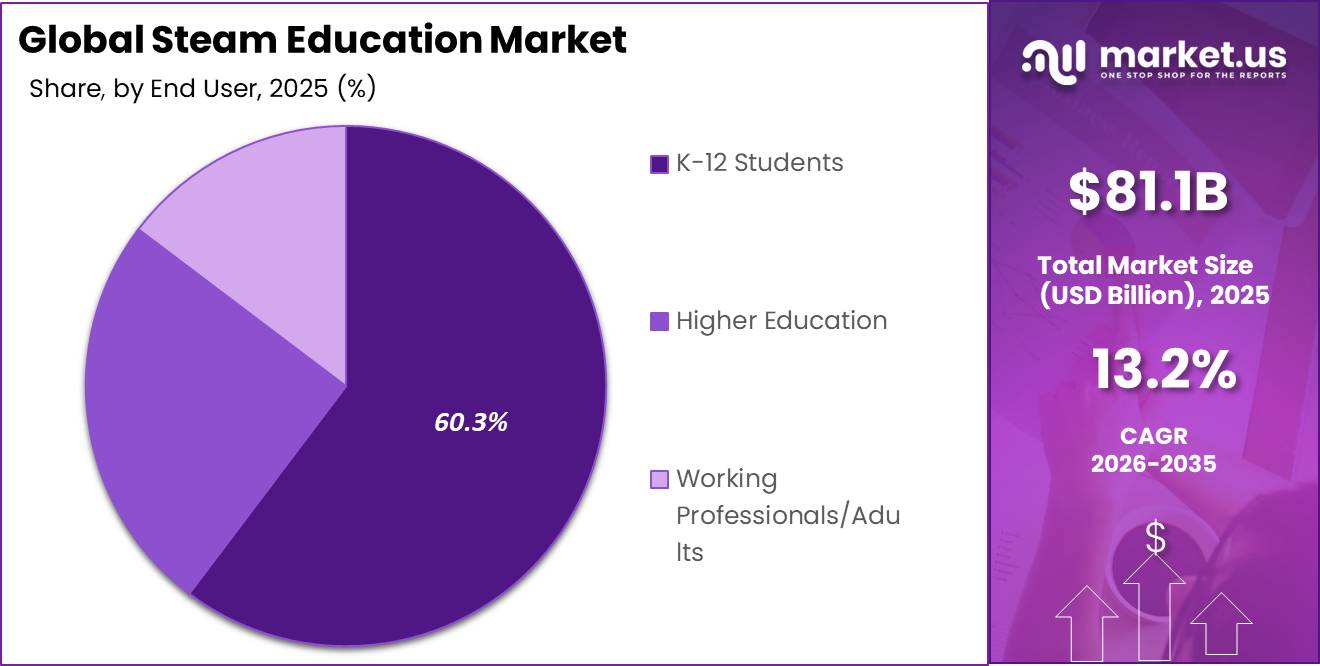
- By End-User, K-12 Students led the market with a 60.3% share in 2025
- By Region, North America dominated the global market with a 40.3% share in 2025
By Component
Curriculum & Content dominates with a 37.4% share in the By Component segment. Curriculum and content form the foundation of STEAM education because every technology investment, classroom program, and policy initiative requires structured learning materials, lesson frameworks, and assessment models to deliver measurable outcomes.
According to the OECD, countries continue to invest significantly in education systems, with OECD members spending an average of 4.7% of GDP on educational institutions, supporting teaching resources, curriculum development, and digital learning materials. UNESCO emphasizes that technology adoption in education is effective only when supported by well-designed curricula that define learning objectives, skills development, and assessment approaches.
By Learning Type
Formal Education dominates with a 56.7% share in the Global STEAM Education Market by Learning Type segment. This dominance is driven by the large-scale adoption of STEAM programs across schools, colleges, and universities, where structured curricula, assessments, and accreditation systems support long-term technology integration.
According to UNESCO, global higher education enrollment reached approximately 269 million students in 2024, reflecting the vast institutional base through which STEAM learning initiatives are delivered. Formal education systems also benefit from established funding mechanisms that support curriculum modernization, teacher development, laboratories, and digital learning infrastructure.
By Technology
Cloud & LMS dominate with a 29.3% share in the By Technology segment. Cloud-based Learning Management Systems (LMS) have become the primary technology foundation for STEAM education by enabling centralized management of digital content, assessments, student data, and interactive learning resources across large educational networks.
According to the World Bank, digital education transformation increasingly depends on technology platforms that support connectivity, data-driven decision-making, and improved learning delivery at scale. UNESCO also highlights the growing importance of digital learning platforms for expanding access to quality education and supporting flexible learning models.
By End-User
K-12 Students dominate with a 60.3% share in the end-user segment of the Global STEAM Education Market. This leadership is supported by the extensive global school-age learner base and the priority given to early development of science, technology, engineering, and digital skills.
According to UNESCO, approximately 1.4 billion students were enrolled in school in 2024, making K-12 education the largest institutional channel for implementing STEAM curricula, digital learning platforms, robotics programs, and coding initiatives. Governments and education authorities increasingly focus on introducing technology skills at early learning stages to prepare students for evolving workforce requirements.
UNICEF highlights that around 65% of teenagers lack the digital skills needed for 90% of current jobs, increasing the need for structured digital and STEM-focused education during school years. K-12 institutions also benefit from government-backed curriculum reforms, teacher training programs, and investments in educational technology infrastructure.
Key Market Segments
By Component
- Curriculum & Content
- Services
- Software Platforms
- Hardware
By Learning Type
- Formal Education
- Informal Education
- Self-paced/Online Learning
By Technology
- Cloud & LMS
- AI & Adaptive Learning
- Gamification Tools
- AR/VR
- Robotics Kits
- Others
By End-User
- K-12 Students
- Higher Education
- Working Professionals/Adults
Geopolitical Impact Analysis
Geopolitical tensions are increasing costs across the STEAM Education Market by disrupting electronics supply chains, raising manufacturing expenses, and extending delivery timelines. In 2025, the United States introduced additional 10% tariffs on a broad range of Chinese imports, while average effective tariff rates increased to around 17.9%, the highest level since 1934, contributing to an estimated 1.3% increase in consumer prices.
Since many classroom electronics and robotics components are manufactured in East Asia, these tariffs have increased landed component costs by approximately 8–12%. Rising energy costs have added further pressure, with electricity and natural gas prices increasing by 15–25% year over year in key manufacturing regions, increasing production costs for educational technology equipment.
Global shipping disruptions are also affecting the availability and pricing of STEAM education products. According to UNCTAD, disruptions across the Red Sea, Suez Canal, and Panama Canal are expected to increase global consumer prices by around 0.6% by 2025 due to higher freight costs. Alternative shipping routes have added approximately 10–15 days to transit times, while spot container freight rates have increased by 25–40% compared with pre-disruption levels.
Regional Analysis
North America dominated the global STEAM Education Market in 2025, accounting for approximately 40.3% of total revenue and generating around USD 32.7 billion in market value. The region’s leadership is supported by strong adoption of integrated science, technology, engineering, arts, and mathematics programs across K–12 and higher education.
High investment in digital learning infrastructure, the presence of established edtech providers, and early adoption of STEAM-based teaching models have strengthened market growth. Mature online learning platforms, classroom technology solutions, and experiential learning ecosystems further support the region’s position as the leading revenue contributor.
Asia Pacific is expected to be the fastest-growing region in the STEAM Education Market, driven by expanding education technology adoption, rising demand for STEM/STEAM programs, and government initiatives focused on future-ready skills. Countries such as China and India are experiencing increased adoption due to large student populations, growing digital education infrastructure, and investments in innovative learning approaches.
Key Regions and Countries
North America
- US
- Canada
Europe
- Germany
- France
- The UK
- Spain
- Italy
- Rest of Europe
Asia Pacific
- China
- Japan
- South Korea
- India
- Australia
- Rest of APAC
Latin America
- Brazil
- Mexico
- Rest of Latin America
Middle East & Africa
- GCC
- South Africa
- Rest of MEA
Market Dynamics
Drivers
| Driver | (~) % Impact on CAGR | Geographic Relevance | Impact Timeline |
|---|---|---|---|
| Government Curriculum Mandates & National Education Policy Reforms | +2.8% | Global — high concentration in South & Southeast Asia, EU, North America | Short term (≤ 2 years) |
| Accelerating EdTech Platform Adoption & Digital Infrastructure Buildout | +2.1% | Global — North America (36% market share), Asia-Pacific fastest-growing | Short term (≤ 2 years) |
| Corporate Workforce Skills Gap Driving Employer-Sponsored STEAM Programs | +1.9% | Global — especially USA, Germany, Japan, South Korea | Medium term (2–4 years) |
| Arts Integration Pedagogical Shift Widening Total Addressable Learner Base | +1.4% | India, EU, Latin America | Medium term (2–4 years) |
| Rising Parental & Societal Demand for Future-Proof Skill Development | +1.2% | Global — urban Asia, Middle East, North Africa | Short term (≤ 2 years) |
| Gamification & Immersive Learning (AR/VR/Robotics) Boosting Engagement Metrics | +0.9% | North America, Western Europe, East Asia | Medium term (2–4 years) |
Government Curriculum Mandates & National Education Policy Reforms
The single most potent demand catalyst for the STEAM education market is the wave of binding national policy mandates that have transitioned arts-integrated STEM curricula from an experimental elective to a compulsory instructional pillar.
India’s National Education Policy 2020, fully operational in school boards by academic year 2023–24, mandates that arts, crafts, and music be co-equal with science and mathematics at every schooling level, directly creating institutional procurement demand across a system that serves over 250 million school-going students, the largest such population on earth.
India’s Union Budget 2024–25 allocated Rs 1,20,628 crore to education overall (with Rs 73,008 crore directed to school education & literacy), embedding new Centre of Excellence in Artificial Intelligence funding and PM SHRI National schools within a mandate that structurally accelerates STEAM materials, teacher-training, and lab-infrastructure procurement cycles.
Restraints
| Restraint | (~) % Impact on CAGR | Geographic Relevance | Impact Timeline |
|---|---|---|---|
| Sustained EdTech Venture Capital Contraction Freezing Early-Stage Capital Formation | -2.4% | Global — most acute in USA, India, UK | Short term (≤ 2 years) |
| Affordability & Household Income Constraints in Low- & Middle-Income Markets | -1.8% | Sub-Saharan Africa, South Asia, Latin America | Medium term (2–4 years) |
| Regulatory Data-Privacy & Child Online Safety Compliance Costs | -1.2% | EU (GDPR), USA (COPPA/FERPA), India (DPDP Act 2023) | Short term (≤ 2 years) |
| Public School Budget Austerity & Delayed Institutional Procurement Cycles | -1.0% | USA, UK, South Africa, Brazil | Short term (≤ 2 years) |
| High Hardware & Lab-Kit Unit Economics Pricing Out Low-Fee Private Schools | -0.7% | India, Southeast Asia, West Africa | Medium term (2–4 years) |
Sustained EdTech Venture Capital Contraction Freezing Early-Stage Capital Formation
Venture capital investment in EdTech collapsed from a pandemic-era peak to $2.4 billion globally in 2024, an 89% decline from the 2021 high, and the deterioration deepened into 2025, with Q1 2025 global EdTech funding of $410 million representing a 35% year-over-year drop versus Q1 2024’s $580 million. In the United States specifically, Q1 2025 venture disbursements fell 50% to $150 million compared to $300 million in Q1 2024.
For STEAM-specific startups, which typically depend on hardware-software hybrid product stacks carrying gross margins of 35–50%, well below pure SaaS benchmarks of 70–80%, this capital drought is structurally asymmetric: robotics kits, AR/VR rigs, and lab consumables require CapEx-intensive production tooling and carry 6–12-month working capital cycles that pure-play digital platforms do not.
The average global EdTech check size rose to $7.8 million in early 2025 only because investors concentrated capital in late-stage, proven platforms, leaving seed and Series A rounds in STEAM hardware-software bundles effectively unfunded.
Challenges
| Challenge | (~) % CAGR | Geographic Relevance | Mitigation Horizon |
|---|---|---|---|
| Qualified STEAM Teacher Supply Deficit | -2.2% | Global — most severe in Sub-Saharan Africa, rural South Asia, rural USA | Long term (≥ 4 years) |
| Digital Infrastructure Gap in Rural Markets | -1.6% | Sub-Saharan Africa, rural India, Southeast Asia, rural Latin America | Long term (≥ 4 years) |
| Gender & Socioeconomic Participation Gap | -1.1% | Global — most acute in MENA, South Asia, Sub-Saharan Africa | Long term (≥ 4 years) |
| Content Localisation & Linguistic Fragmentation | -0.8% | India, Africa, Southeast Asia, Latin America | Medium term (2–4 years) |
| Assessment Standardisation Absence | -0.6% | Global — particularly developing-country school boards | Medium term (2–4 years) |
Qualified STEAM Teacher Supply Deficit
The structural scarcity of qualified STEAM educators represents the single deepest ceiling constraint on market growth, operating independently of any capital or policy lever. UNESCO’s 2024 Global Report on Teachers documented a shortfall of 44 million primary and secondary teachers globally by 2030, with STEM and STEAM specialisations disproportionately underrepresented in some middle-income countries such as Malaysia and Türkiye; more than 80% of secondary schools already face an inadequate supply of mathematics and science teachers.
In the United States, the pipeline has materially deteriorated: the number of new STEM teachers graduating from higher education institutions fell 37%, from approximately 32,000 annually in 2011 to roughly 20,000 by 2022, and science and mathematics ranked as the second and third most-frequently reported shortage subjects nationally in the 2024–25 school year.
STEAM teachers face uniquely high attrition because STEM graduates command substantial salary premiums in private-sector roles, with the projected shortfall in computing and mathematics workers alone estimated at 6 million in the USA and 1 million in Germany by 2030; the opportunity cost of teaching is prohibitively high.
Retention incentives such as England’s 8% gross salary supplement for early-career maths and physics teachers reduced departure rates by 23%, but the cost of retaining one additional teacher through incentive pay still runs 32% below the cost of training a replacement, meaning systemic under-investment compounds annually.
Opportunities
| Opportunity | (~) % Potential CAGR | Geographic Relevance | Execution Window |
|---|---|---|---|
| AI-Powered Adaptive Learning Personalisation Platform Layer | +3.1% | Global — North America, India, China, EU lead adoption | Short term (≤ 2 years) |
| B2B Corporate Upskilling & Workforce Reskilling Adjacency | +2.3% | Global — USA, Germany, Japan, GCC, India IT corridor | Medium term (2–4 years) |
| Emerging-Market Mobile-First STEAM Micro-Learning Expansion | +1.8% | Sub-Saharan Africa, South Asia, Southeast Asia, Latin America | Medium term (2–4 years) |
| Public-Private Co-Investment in National STEAM Lab Infrastructure | +1.4% | India, ASEAN, Gulf Cooperation Council states | Medium term (2–4 years) |
| STEAM Content Licensing & IP Monetisation for OEM EdTech Platforms | +1.0% | Global — primarily USA, UK, Australia, India | Long term (≥ 4 years) |
| Special Needs & Neurodiverse Learner Segment Dedicated Tooling | +0.7% | North America, Western Europe, Australia | Long term (≥ 4 years) |
AI-Powered Adaptive Learning Personalisation Platform Layer
This is explicitly untapped white space rather than an active driver: while AI tools are commercially available, fewer than 14% of current graduates are assessed as AI-ready by employers per the 2026 Pearson/AWS AI Readiness Report, and 53% of employers report difficulty sourcing AI-competent candidates a gap that confirms the existing STEAM delivery infrastructure has not yet embedded systematic AI personalisation at scale.
The AI-in-Education market was valued at $7.52 billion in 2025 and is projected to reach $10.6 billion in 2026, growing at a 40.9% CAGR, but the vast majority of this capital is concentrated in post-secondary and workforce training, leaving the K-12 and informal STEAM personalisation layer arguably the highest-leverage intervention point commercially underserved.
A STEAM platform operator that successfully embeds adaptive AI engines can structurally shift its unit economics: adaptive recommendation reduces content churn, extends average session duration by an estimated 25–40%, and reduces remedial instructor intervention cost, collectively expanding platform net revenue retention above 110% in institutional accounts.
The adjacent TAM K-12 STEM education globally was valued at approximately $60.1 billion in 2024, projected to reach $132 billion by 2030, and remains primarily served by static curriculum content rather than AI-personalised delivery, making the delta between current penetration and addressable market the largest single monetisable white space in the sector.
Key Players Analysis
The global STEAM education market is shaped by the financial and strategic weight of large technology platforms and specialist hardware/content providers, with their own disclosures providing the clearest view of competitive hierarchy.
Microsoft reported total revenue of about USD 245.1 billion for FY 2024, with roughly USD 96.2 billion from cloud‑centric businesses and around USD 61.4 billion from devices and related computing, supported by about USD 27.0 billion in R&D spend, which collectively underscores how its cloud, AI and endpoint stacks act as core infrastructure for LMS, coding and robotics solutions deployed in STEAM classrooms.
Apple disclosed net sales of approximately USD 383.3 billion for 2024, including around USD 200.6 billion from iPhone and over USD 68.0 billion from Mac and iPad combined, plus roughly USD 90.0 billion in Services, highlighting the scale of its installed base and app ecosystem that host creativity, coding and design tools across K‑12 and higher‑education STEAM programs.
On the specialist side, LEGO Group’s 2024 figures show revenue of about DKK 74.3 billion (around USD 10.8 billion) and operating profit near DKK 18.7 billion, alongside a global store footprint exceeding 1,000 locations, which gives LEGO Education a strong institutional and retail channel to push robotics and hands‑on STEAM kits into schools.
Top Key Players in the Market
- Chaihuo
- DFrobot
- Gaotu Techedu Inc
- LEGO
- Makeblock
- Pearson
- Roblox Corporation
- Stride
- Ubtech Robotics
- Youbetter
- Others
Recent Developments
- In June 2026, Roblox Corporation announced a global expansion of its Roblox Education initiative, targeting over 25 million students across more than 40 countries by 2028, supported by a dedicated USD 60 million investment pool for curriculum development and educator training.
- In March 2026, the European Commission launched a STEM–STEAM skills foundry pilot across strategic sectors, aiming to involve companies in mentoring young student entrepreneurs; the initial phase is designed to support several thousand learners annually and is funded under EU education and competitiveness budgets exceeding EUR 100 million for 2026.
Report Scope
| Report Features | Description |
|---|---|
| Market Value (2025) | USD 81.1 Billion |
| Forecast Revenue (2035) | USD 280.9 Billion |
| CAGR (2026-2035) | 13.2% |
| Base Year for Estimation | 2025 |
| Historic Period | 2020-2024 |
| Forecast Period | 2026-2035 |
| Report Coverage | Revenue Forecast, Market Dynamics, Competitive Landscape, Recent Developments |
| Segments Covered | By Component (Curriculum & Content, Services, Software Platforms, Hardware), By Learning Type (Formal Education, Informal Education, Self-paced/Online Learning), By Technology (Cloud & LMS, AI & Adaptive Learning, Gamification Tools, AR/VR, Robotics Kits, Others), By End-User (K-12 Students, Higher Education, Working Professionals/Adults) |
| Regional Analysis | North America – US, Canada; Europe – Germany, France, The UK, Spain, Italy, Rest of Europe; Asia Pacific – China, Japan, South Korea, India, Australia, Singapore, Rest of APAC; Latin America – Brazil, Mexico, Rest of Latin America; Middle East & Africa – GCC, South Africa, Rest of MEA |
| Competitive Landscape |
Chaihuo, DFRobot, Gaotu Techedu Inc, LEGO, Makeblock, Pearson, Roblox Corporation, Stride, UBTECH Robotics, Youbetter, Others |
| Customization Scope | Customization for segments and region/country-level will be provided. Moreover, additional customization can be done based on the requirements. |
| Purchase Options | We have three licenses to opt for: Single User License, Multi-User License (Up to 5 Users), Corporate Use License (Unlimited Users and Printable PDF) |





























