


Report Overview
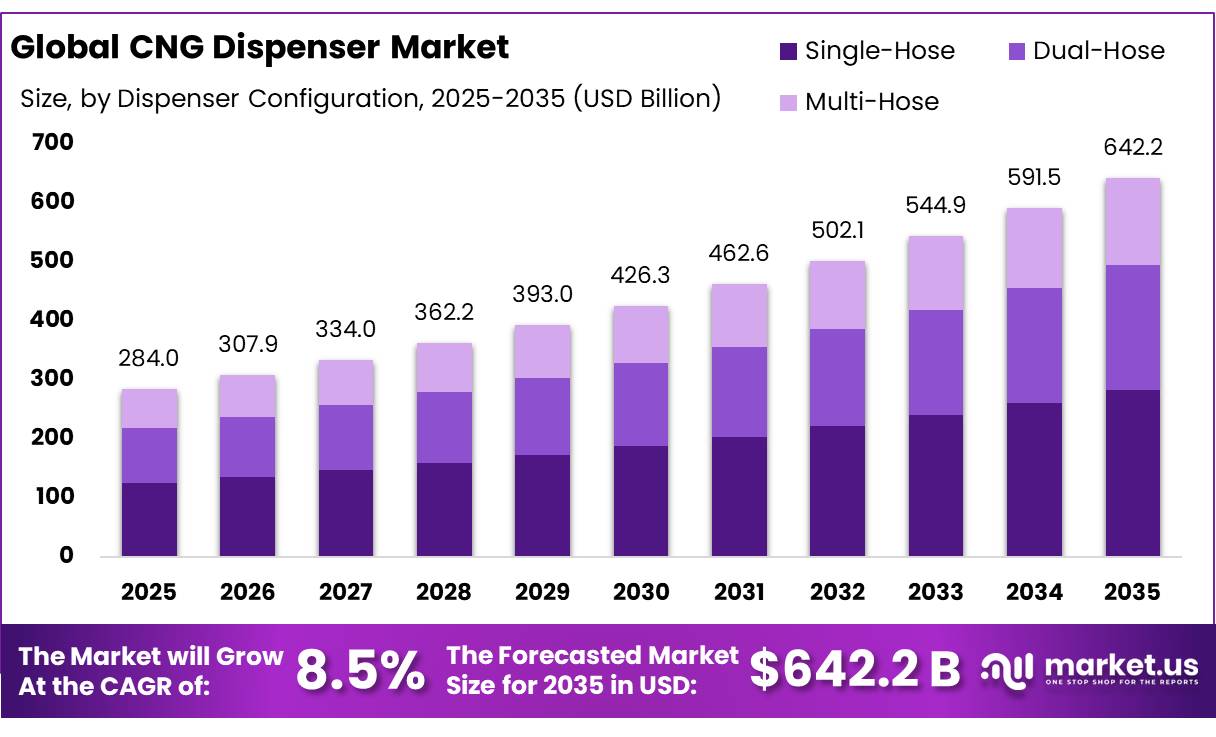
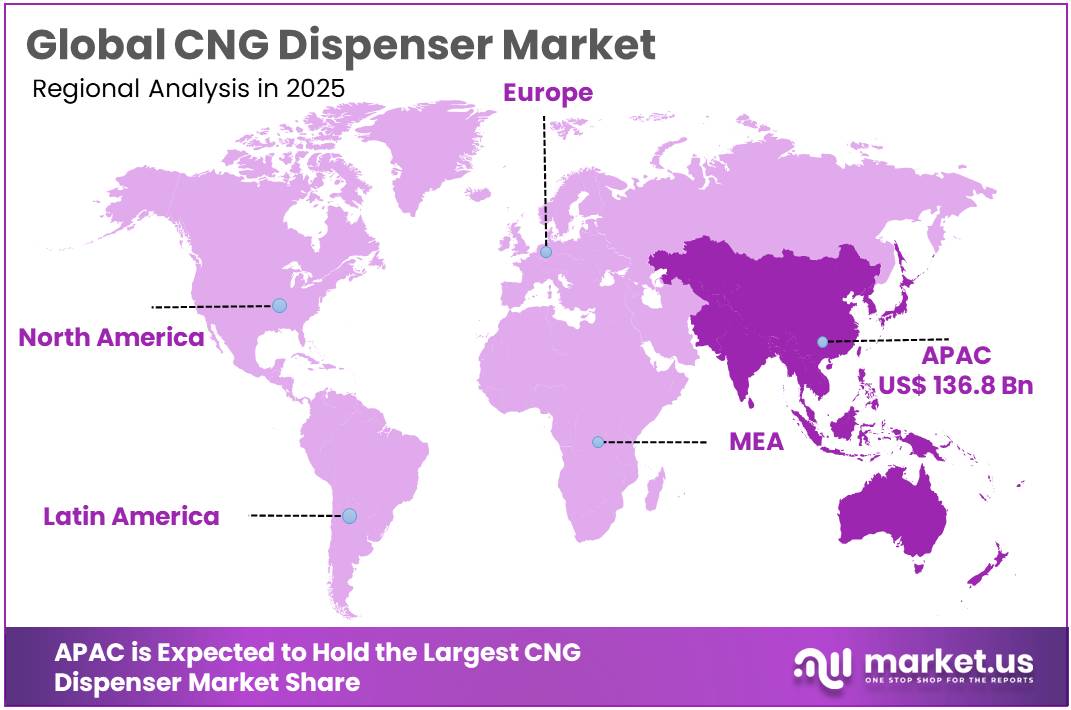
The Global CNG Dispenser Market size is expected to be worth around USD 642.2 Billion by 2035, from USD 284.0 Billion in 2025, growing at a CAGR of 8.5% during the forecast period from 2026 to 2035. In 2025, Asia-Pacific held a dominant market position, capturing more than a 48.21% share, holding USD 136.8 Billion revenue.
The CNG dispenser industry forms an important part of the alternative-fuel infrastructure ecosystem, supplying compressed natural gas to passenger vehicles, buses, municipal fleets and heavy-duty trucks. A typical station combines compressors, storage cylinders, valves, metering systems, hoses and dispensers designed for high-pressure fueling. The U.S. Department of Energy identifies 3 main CNG station configurations: fast-fill, time-fill and combination-fill.
- The U.S. Department of Energy states that natural gas powers more than 175,000 vehicles in the United States and roughly 23 million vehicles worldwide. More than 700 public CNG stations were available across the United States in the latest DOE infrastructure assessment.
Fuel availability remains another important supporting factor. U.S. marketed natural-gas production reached a record 118.5 billion cubic feet per day in 2025, rising by 5.3 Bcf/d from the previous year. Appalachia alone supplied 36.6 Bcf/d, equivalent to 31% of U.S. marketed production. Strong domestic gas availability can support stable CNG station operations and encourage investments in upgraded compressors, dispensers and storage systems, particularly for commercial fleets with predictable daily fueling requirements.
- Heavy-duty vehicle development is also creating new growth potential. Cummins’ X15N natural-gas engine delivers up to 500 horsepower and 1,850 lb-ft of torque, allowing natural gas to move further into long-haul trucking applications. In 2025, Cummins reported growing deployment interest from major fleets, which can increase demand for high-flow CNG dispensers capable of serving larger tanks and reducing vehicle turnaround time.
Renewable natural gas adds another future opportunity. The U.S. EPA expects renewable natural gas to remain the largest source of cellulosic biofuel used in transportation, although future growth will increasingly depend on the size of the CNG and LNG vehicle fleet. EPA also noted that much of the existing natural-gas fleet is already supplied with renewable fuel, showing the close link between vehicle adoption and dispenser infrastructure growth.
Key Takeaways
- CNG Dispenser Market size is expected to be worth around USD 642.2 Billion by 2035, from USD 284.0 Billion in 2025, growing at a CAGR of 8.5%.
- Single-Hose held a dominant market position, capturing more than a 44.15% share.
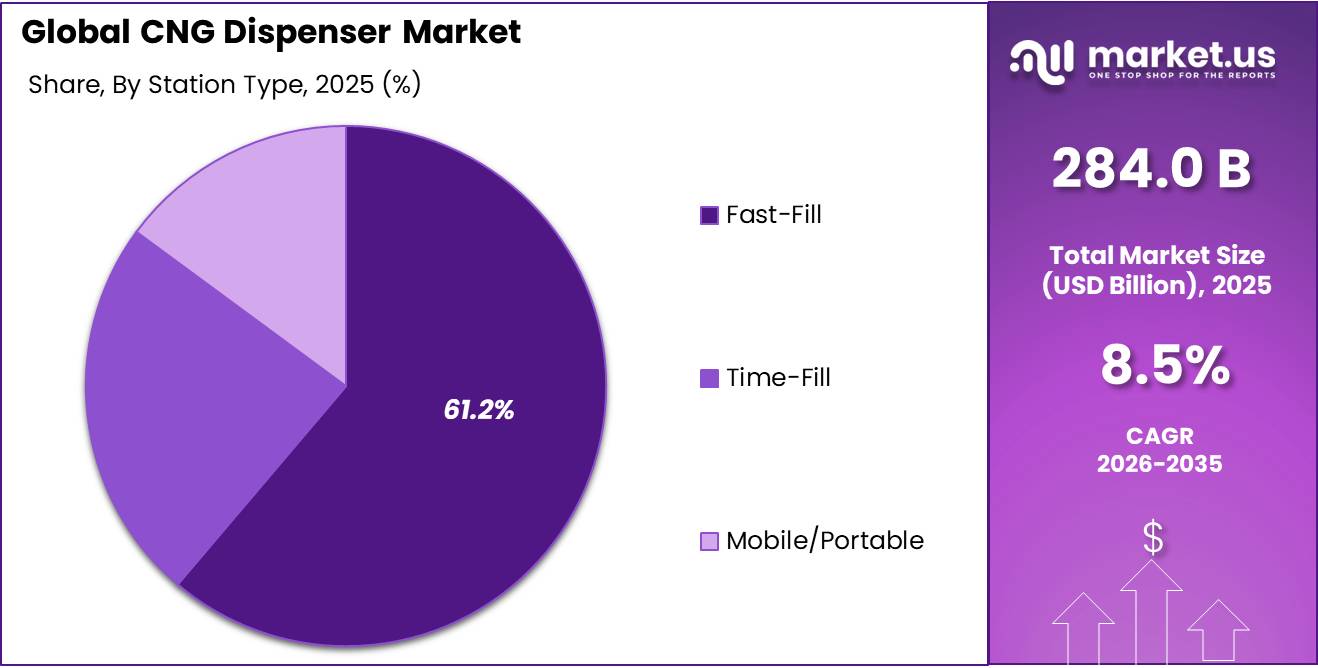
- Fast-Fill held a dominant market position, capturing more than a 61.23% share.
- Public Retail Stations held a dominant market position, capturing more than a 52.34% share.
- Asia-Pacific held a dominant CNG Dispenser Market position, capturing more than a 48.21% share and reaching USD 136.8 billion.
By Dispenser Configuration Analysis
Single-Hose CNG Dispensers Lead with 44.15% Share on Simple, Cost-Efficient Station Design
In 2025, Single-Hose held a dominant market position, capturing more than a 44.15% share. Single-hose dispensers remain widely used because they offer a simpler fueling layout, require fewer dispensing components, and suit stations where one vehicle is served at a time. Their straightforward design can reduce installation complexity and make maintenance easier, particularly at smaller public stations and dedicated fleet sites.
Government infrastructure data supports the continuing need for CNG dispensing equipment. The U.S. Department of Energy identifies 3 main CNG station types: fast-fill, time-fill, and combination-fill, with all public CNG stations offering a fast-fill option. Single-hose units fit well within these installations where operators prioritize compact layouts and controlled fueling flow.
- Fuel availability also remains supportive. U.S. marketed natural gas production reached a record 118.5 billion cubic feet per day in 2025, increasing by 5.3 Bcf/d from the previous year. Appalachia, Permian, and Haynesville together represented 67% of marketed production. A strong gas-supply base helps support continued operation of CNG stations and replacement demand for dispensers, hoses, meters, valves, and associated hardware.
Dual-Hose dispensers are gaining importance in the CNG Dispenser Market because they can improve fueling flexibility at locations serving buses, refuse vehicles, commercial fleets, and other high-utilization vehicles. By providing two fueling hoses from one dispenser structure, operators can reduce waiting time, support different vehicle connection arrangements, and make better use of busy refueling islands.
By Station Type Analysis
Fast-Fill CNG Stations Lead with 61.23% Share as Drivers Prioritize Quick Refueling
In 2025, Fast-Fill held a dominant market position, capturing more than a 61.23% share. Fast-fill stations remain widely preferred because they can refuel vehicles quickly and work well at public stations, truck stops, bus depots, and commercial fleet locations. Their design uses larger compressors and high-pressure storage vessels, allowing gas to be delivered rapidly through dispensers when vehicles arrive.
- The U.S. Department of Energy states that there are 3 main CNG station types: fast-fill, time-fill, and combination-fill. It also notes that all public CNG stations offer a fast-fill option, which directly supports the segment’s strong position in public fueling infrastructure. Fast-fill systems commonly store CNG at around 4,300 psi before dispensing it to vehicles.
Time-Fill stations represent an important segment of the CNG Dispenser Market, particularly for bus fleets, refuse trucks, municipal vehicles, delivery fleets, and other vehicles that return to a central depot each day. These systems normally fill vehicles directly from the compressor over several hours, reducing the need for large high-pressure storage systems and allowing multiple parked vehicles to refuel overnight.
By End User Analysis
Public Retail Stations Lead CNG Dispenser Market with 52.34% Share as Public Fast-Fill Access Expands
In 2025, Public Retail Stations held a dominant market position, capturing more than a 52.34% share. Public retail locations remain important because they provide open access to private motorists, commercial vehicles, taxis, buses, and freight operators that cannot depend on dedicated depot infrastructure. These stations usually rely on fast-fill dispensers, high-pressure storage, metering equipment, and payment systems designed for frequent vehicle turnover.
- The U.S. Department of Energy recorded 9 public CNG stations in Arizona, 8 in Arkansas, and 3 in Alabama on December 31, 2025. Public CNG stations also rely heavily on fast-fill capability, as DOE states that all public CNG stations offer a fast-fill option. This operating model makes public retail locations a key customer base for high-flow dispensers, compressors, storage vessels, hoses, valves, and digital payment equipment.
Private Fleet Depots represent an important end-user segment in the CNG Dispenser Market because buses, refuse trucks, delivery vehicles, municipal fleets, and logistics operators often return to a central location after daily service. This allows operators to install dedicated time-fill or combination-fill systems and refuel multiple vehicles under controlled conditions without depending on public retail availability.
Key Market Segments
By Dispenser Configuration
- Single-Hose
- Dual-Hose
- Multi-Hose
By Station Type
- Fast-Fill
- Time-Fill
- Mobile/Portable
By End User
- Public Retail Stations
- Private Fleet Depots
- Transit and Bus Fleets
- Industrial and Mining Sites
Driver Analysis
India CGD station rollout
As of April 2026, India had 8,948 operational CNG stations against a pro-rata target of 6,889, and the minimum work programme still points to 18,336 CNG stations by 2034, implying a remaining build-out of roughly 9,400 stations over the coming years; PNG Drive 2.0 alone added 474 CNG stations, extended CGD supply to 32 new districts, and connected 23 new geographical areas into the primary gas pipeline network. Even the more conservative March 2026 ministerial update cited more than 8,600 stations, up from 738 in 2014, confirming that the installed-base expansion is structural rather than cyclical.
For dispenser manufacturers, each greenfield site usually requires 2 to 8 dispensers depending on layout, vehicle mix, and redundancy, which translates into an analyst-modeled addressable demand of roughly 18,000 to 55,000 dispenser units embedded in the remaining Indian rollout alone, before replacements and retrofits.
The commercial model is also improving: faster clearances under a 10-day processing mandate and temporary six-month approval exemption for CNG compressors lower project gestation, while new stations in Tier-2 and Tier-3 cities reduce direct competition from EV fast charging and keep asset utilization focused on taxis, buses, and commercial fleets. That combination makes India’s rollout a direct +2.8 percentage-point support to 2026 baseline CAGR because it pulls both OEM unit sales and higher-margin service contracts for metering calibration, software integration, valves, hoses, and dispenser refurbishment
Drivers Impact Analysis
| Driver | (~) % Impact on CAGR | Geographic Relevance | Impact Timeline |
|---|---|---|---|
| India CGD station rollout | +2.8% | India core, South Asia spill-over | Short term (≤ 2 years) |
| Fleet corridor fueling build-out | +1.9% | India, China, EU logistics corridors | Medium term (2-4 years) |
| Bio-CNG/RNG dispenser conversion | +1.6% | India, UK, U.S., Brazil | Medium term (2-4 years) |
| Gas-grid expansion into new districts | +1.4% | India Tier-2/3 cities, China inland, Brazil | Short term (≤ 2 years) |
| Station throughput digitization | +1.1% | Global urban CNG networks | Short term (≤ 2 years) |
| Heavy-vehicle decarbonization hedging | +0.9% | UK, EU, India, Brazil | Long term (≥ 4 years) |
Restraint Analysis
EV Infrastructure Substitution
Global electric-truck sales more than doubled in 2025 to approximately 9% of total truck sales, with China accounting for the bulk of growth and one in four Chinese trucks sold being electric, while public charging points suitable for heavy-duty vehicles reached an estimated 70,000 globally at end-2025. India is simultaneously building a competing infrastructure base: public charging points reached 52,718 by July 2026, including 16,561 fast chargers, and the government allocated INR 2,000 crore for nationwide public charging under PM E-DRIVE, creating a parallel procurement pipeline for the same station sites, electrical contractors, and fleet customers targeted by CNG retailers.
In an analyst forecourt-allocation model, a USD 1.5–3.0 million capex envelope can finance either a high-throughput CNG compression-and-dispensing installation or a phased charging hub with 6–12 DC fast-charging points, and a site owner choosing the latter removes potential demand for 2–6 CNG dispensers plus associated service revenue; if only 15% of planned multi-fuel locations redirect investment, the addressable dispenser pipeline can shrink by 8–12% in electrification-priority markets. The effect is strongest in China, the EU, North America, and premium Indian urban corridors, where government incentives, fleet procurement mandates, and charging interoperability reduce EV deployment risk; consequently, this restraint is estimated to deduct 2.2 percentage points from achievable CNG dispenser CAGR over 2026–2030.
Restraint Impact Analysis
| Restraint | (~) % Impact on CAGR | Geographic Relevance | Impact Timeline |
|---|---|---|---|
| EV infrastructure substitution | -2.2% | China, EU, India, North America | Medium term (2-4 years) |
| High station CapEx | -1.8% | APAC emerging, LatAm, Africa | Short term (≤ 2 years) |
| Gas-price volatility | -1.6% | Asia, EU, import-dependent markets | Short term (≤ 2 years) |
| Permitting and safety compliance | -1.3% | India, EU, Middle East, LatAm | Medium term (2-4 years) |
| Compressor and parts dependency | -1.1% | Global, especially import markets | Short term (≤ 2 years) |
| Declining OEM CNG vehicle choice | -0.9% | EU, China, North America | Long term (≥ 4 years) |
Opportunity Analysis
Bio-CNG Certification Dispensers
India’s CBG blending obligation started at 1% in FY2025-26, rises to 3% in FY2026-27, 4% in FY2027-28, and 5% from FY2028-29; the policy is intended to facilitate about 750 CBG projects and approximately INR 37,500 crore of investment by 2028-29, creating a future compliance-led need for more robust gas-quality, batch-traceability, and reporting systems at retail nodes. In Europe, Guarantees of Origin can certify 1 MWh increments of renewable biomethane and are issued, transferred, and cancelled through recognized registries, yet most station hardware is not sold as a bundled physical-fuel-plus-environmental-attribute product.
A dispenser OEM could capture this white space by combining a certified mass-flow meter, methane-quality interface, QR or fleet-card receipt, cloud carbon ledger, and annual audit workflow; an analyst model indicates a USD 8,000–25,000 incremental hardware-and-software package per outlet, recurring platform fees of USD 100–400 per dispenser monthly, and a 3–6 percentage-point gross-margin improvement relative to commodity dispenser-only sales.
The commercial proof point exists in UK freight: 16 public-access Bio-CNG stations supplied 5,598 tonnes in August 2026 to an average 2,268 vehicles per day, but this high-throughput network remains limited in geographic scope and does not yet represent a globally standardized certificate-enabled dispenser category. Capturing that gap through accredited integrations with CGD entities, renewable-gas registries, and fleet reporting systems could add approximately 2.1 percentage points above baseline market CAGR, particularly in India, the UK, Germany, the Netherlands, the United States, and Brazil.
Opportunity Impact Analysis
| Opportunity | (~) % Potential CAGR | Geographic Relevance | Execution Window |
|---|---|---|---|
| Bio-CNG certification dispensers | +2.1% | India, UK, EU, U.S., Brazil | Medium term (2-4 years) |
| Freight depot fast-fill systems | +1.8% | India, UK, EU, U.S., Brazil | Short term (≤ 2 years) |
| Dispenser-as-a-Service | +1.5% | India, APAC emerging, Africa, LatAm | Medium term (2-4 years) |
| Retrofit and uptime subscriptions | +1.3% | North America, India, EU core | Short term (≤ 2 years) |
| CGD consolidation roll-ups | +1.1% | India, Africa, South Asia | Long term (≥ 4 years) |
| Modular daughter-station exports | +1.0% | Africa, South Asia, LatAm, GCC | Medium term (2-4 years) |
Challenges Analysis
High-Pressure Service Talent
India’s 2026 mobile CNG/CBG refueling rules further require direct supervision by an authorized and trained responsible person, periodic mock drills, documented leak and ESD checks, maintenance records, and hoses designed for a minimum burst pressure four times maximum operating pressure, expanding the technician competency requirement as networks decentralize.
An analyst workforce model indicates that one fully trained technician can sustainably cover 20–35 connected dispenser positions or 8–15 compressor-equipped stations when travel, preventive maintenance, emergency callouts, certification, and parts logistics are included; a network adding 1,000 dispenser points therefore requires roughly 30–50 additional field technicians plus 8–15 controls specialists, while a 15–25% vacancy or turnover rate can extend mean-time-to-repair from 12–18 hours to 30–48 hours in secondary markets.
The resulting 2–5 percentage-point availability loss lowers fuel throughput, increases warranty reserves by an estimated 0.5–1.5% of equipment revenue, and makes fleet customers demand higher penalty-backed service levels; suppliers must respond through accredited technician academies, remote diagnostics, standardized fault libraries, dealer certification, and regional spares hubs, but this multi-year capability build imposes an estimated -1.3 percentage-point friction drag on CAGR across India, emerging APAC, Africa, and Latin America.
Challenges Impact Analysis
| Challenge | (~) % CAGR Friction | Geographic Relevance | Mitigation Horizon |
|---|---|---|---|
| High-pressure service talent | -1.3% | India, APAC, Africa, LatAm | Medium term (2-4 years) |
| LNG supply shock exposure | -1.2% | Asia, EU, import-dependent markets | Medium term (2-4 years) |
| Multi-vendor uptime coordination | -1.0% | Global CNG networks | Medium term (2-4 years) |
| Connected-forecourt cyber risk | -0.9% | EU, North America, India | Medium term (2-4 years) |
| Certification localization burden | -0.8% | EU, India, GCC, Africa | Long term (≥ 4 years) |
| Uneven corridor utilization | -0.7% | APAC, LatAm, Africa, EU freight routes | Long term (≥ 4 years) |
Geopolitical Impact Analysis
In 2026, reduced LNG flows through the Strait of Hormuz pushed natural-gas prices higher in Europe and Asia, although U.S. Henry Hub prices remained comparatively protected. The U.S. Energy Information Administration projected Henry Hub natural gas at about US$3.80 per MMBtu in 2026, showing how regional supply structures can limit or amplify war-related price shocks.
Europe remains more exposed to geopolitical gas risk. The European Commission stated in September 2026 that Qatari LNG production was still shut down and that geopolitical uncertainty continued to create significant gas-price volatility. The EU has also strengthened storage and diversification measures since Russia’s invasion of Ukraine, with gas storage capable of supplying up to 35% of winter consumption.
For CNG dispenser suppliers, this creates mixed effects. Higher gas-price volatility can delay new station investment where fleet economics weaken, while energy-security concerns can encourage domestic gas, renewable natural gas, and fleet-fueling infrastructure. In the U.S., CNG still averaged about US$3.08 per gasoline-gallon equivalent in April 2026, supporting continued fleet use where gas supply remains stable.
Regional Insights
In 2025, Asia-Pacific held a dominant CNG Dispenser Market position, capturing more than a 48.21% share and reaching USD 136.8 billion. The region benefits from extensive natural-gas vehicle infrastructure, large commercial fleets, and continued investment in alternative-fuel stations. China is strengthening technical standards for this ecosystem. In 2026, the country’s national standardization system advanced a new standard specifically covering CNG vehicle fueling stations. A separate 2025 standard project for CNG vehicle filling receptacles specifies working pressures of 20 MPa and 35 MPa, supporting safer, standardized dispenser connections and high-pressure fueling equipment.
North America is positioned as a fast-growing regional opportunity as commercial fleets continue using CNG for refuse collection, transit, delivery, and municipal transport. U.S. Department of Energy historical data shows that public CNG stations remained distributed across numerous states at the end of 2025. Arizona had 9 public CNG stations, Arkansas recorded 8, and Alabama had 3. The DOE also confirms that all public CNG stations provide a fast-fill option, creating continuing demand for high-pressure dispensers, compressors, storage banks, flow meters, hoses, and digital station controls.
Key Regions and Countries Insights
- North America
- US
- Canada
- Europe
- Germany
- France
- The UK
- Spain
- Italy
- Rest of Europe
- Asia Pacific
- China
- Japan
- South Korea
- India
- Australia
- Rest of APAC
- Latin America
- Brazil
- Mexico
- Rest of Latin America
- Middle East & Africa
- GCC
- South Africa
- Rest of MEA
Key Players Analysis
Gilbarco Veeder-Root strengthens its CNG dispenser position through ANGI Energy Systems, which supplies dispensers, compressors, fuel-management systems, and distributed controls. Its SK700-II CNG platform supports 250-bar and 300-bar inlet pressure and can be configured with 1 or 2 hoses per side for retail or fleet fueling. Gilbarco is part of Vontier, a global industrial-technology group generating around USD 3 billion in annual revenue, giving ANGI broad financial and distribution support for alternative-fuel infrastructure. Gilbarco Veeder-Root
Tatsuno Corporation maintains a strong position in CNG dispensing through its wider alternative-fuel equipment portfolio covering CNG, LNG, LPG, and hydrogen. The company employs 1,220 people in Japan, while the wider Tatsuno Group had 1,844 employees. Tatsuno holds more than 60% of Japan’s conventional fuel-dispenser market and has filed over 5,000 patent, utility-model, and design applications. Its established manufacturing, metering, and high-pressure gas expertise supports expansion of CNG dispensing systems across Asia and international fueling markets. tatsuno-corporation.com
Kraus Global focuses on high-pressure CNG dispensing for public stations and commercial fleets. Its Fleet Series CNG dispenser supports 1,000 to 4,500 SCFM flow configurations, a standard target filling pressure of 3,600 psi, and system components rated to at least 5,000 psi. The platform offers single- and dual-hose configurations, Coriolis mass-flow metering with about ±1% accuracy, and operation from -40°C to +50°C. These specifications position Kraus well for heavy-duty and high-throughput CNG refueling applications.
Top Key Players Outlook
- Gilbarco Veeder-Root (ANGI)
- Tatsuno Corporation
- Kraus Global
- Bennett Pump Company
- Scheidt & Bachmann
- Sanki Industry Group
- Censtar Science & Technology
- Parker Hannifin
- Tulsa Gas Technologies
- Greka Engineering
- OPW (Dover)
- Chart Industries
- FTI International Group
- Other Key Players
Recent Developments
- In April 2026, Merlin Fueling announced a strategic partnership with Bennett Pump Company and became an authorized distributor, strengthening Bennett’s commercial reach across fuel-station customers in the U.S. Bennett’s current CNG dispenser supports up to 2 products and 2 hoses, delivers a flow rate of up to 100 kg/min, operates on 115/230 VAC at 50/60 Hz, and functions across temperatures from -30°C to +50°C.
- July 2026, Scheidt & Bachmann the 30-year anniversary of its System Service team and 60 years of its Energy Retail activities, indicating continued investment in service and distribution capacity. Scheidt & Bachmann reported 3,638.5 employees in its 2024 sustainability report, including 3,301.5 in Europe and 256 in North America, supporting a broad international service base.
Report Scope
| Report Features | Description |
|---|---|
| Market Value (2025) | USD 284.0 Bn |
| Forecast Revenue (2035) | USD 642.2 Bn |
| CAGR (2026-2035) | 8.5% |
| Base Year for Estimation | 2025 |
| Historic Period | 2020-2024 |
| Forecast Period | 2026-2035 |
| Report Coverage | Revenue Forecast, Market Dynamics, Competitive Landscape, Recent Developments |
| Segments Covered | By Dispenser Configuration (Single-Hose, Dual-Hose, Multi-Hose), By Station Type (Fast-Fill, Time-Fill, Mobile/Portable), By End User (Public Retail Stations, Private Fleet Depots, Transit and Bus Fleets, Industrial and Mining Sites) |
| Regional Analysis | North America – US, Canada; Europe – Germany, France, The UK, Spain, Italy, Rest of Europe; Asia Pacific – China, Japan, South Korea, India, Australia, Singapore, Rest of APAC; Latin America – Brazil, Mexico, Rest of Latin America; Middle East & Africa – GCC, South Africa, Rest of MEA |
| Competitive Landscape | Gilbarco Veeder-Root (ANGI), Tatsuno Corporation, Kraus Global, Bennett Pump Company, Scheidt & Bachmann, Sanki Industry Group, Censtar Science & Technology, Parker Hannifin, Tulsa Gas Technologies, Greka Engineering, OPW (Dover), Chart Industries, FTI International Group, Other Key Players |
| Customization Scope | Customization for segments, region/country-level will be provided. Moreover, additional customization can be done based on the requirements. |
| Purchase Options | We have three licenses to opt for: Single User License, Multi-User License (Up to 5 Users), Corporate Use License (Unlimited User and Printable PDF) |





































