


Report Overview
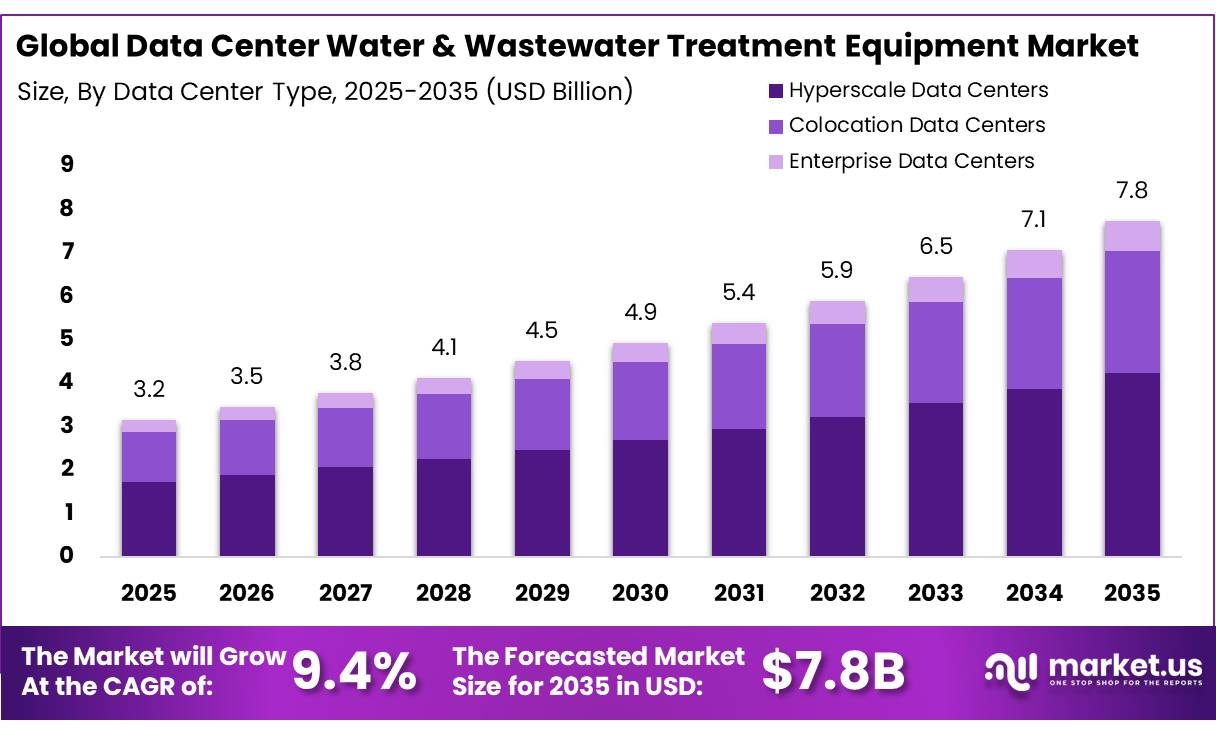
In 2025, the Data Center Water and Wastewater Treatment Equipment Market was valued at USD 3.2 Billion, and between 2026 and 2035, this market is estimated to register a CAGR of 9.4%, reaching about USD 7.8 Billion by 2035. North America held a dominant market position, capturing more than a 38.55% share, holding USD 1.22 Billion in revenue.
The Data Center Water and Wastewater Treatment Equipment Market covers reverse osmosis units, ultraviolet disinfection systems, cooling tower water treatment, and effluent recycling equipment used to manage cooling water at server facilities. Growth in artificial intelligence (AI) infrastructure is expanding equipment demand across the United States.
- The Lawrence Berkeley National Laboratory, operating under the U.S. Department of Energy (DOE), reported that data center electricity use climbed from 58 terawatt hours (TWh) in 2014 to 176 TWh in 2023, equal to 4.4 % of total U.S. electricity consumption that year.
Key Takeaways
- The Global Data Center Water & Wastewater Treatment Equipment Market was valued at USD 3.2 billion in 2025.
- The global market is projected to grow at a CAGR of 9.4% and is estimated to reach USD 7.8 billion by 2035.
- On the basis of data center type, Hyperscale Data Centers dominated the market, constituting 54.83% of the total market share
- Based on the equipment type, Membrane & High-Purity Water Systems dominated the market, accounting for 32.0% of the total market share
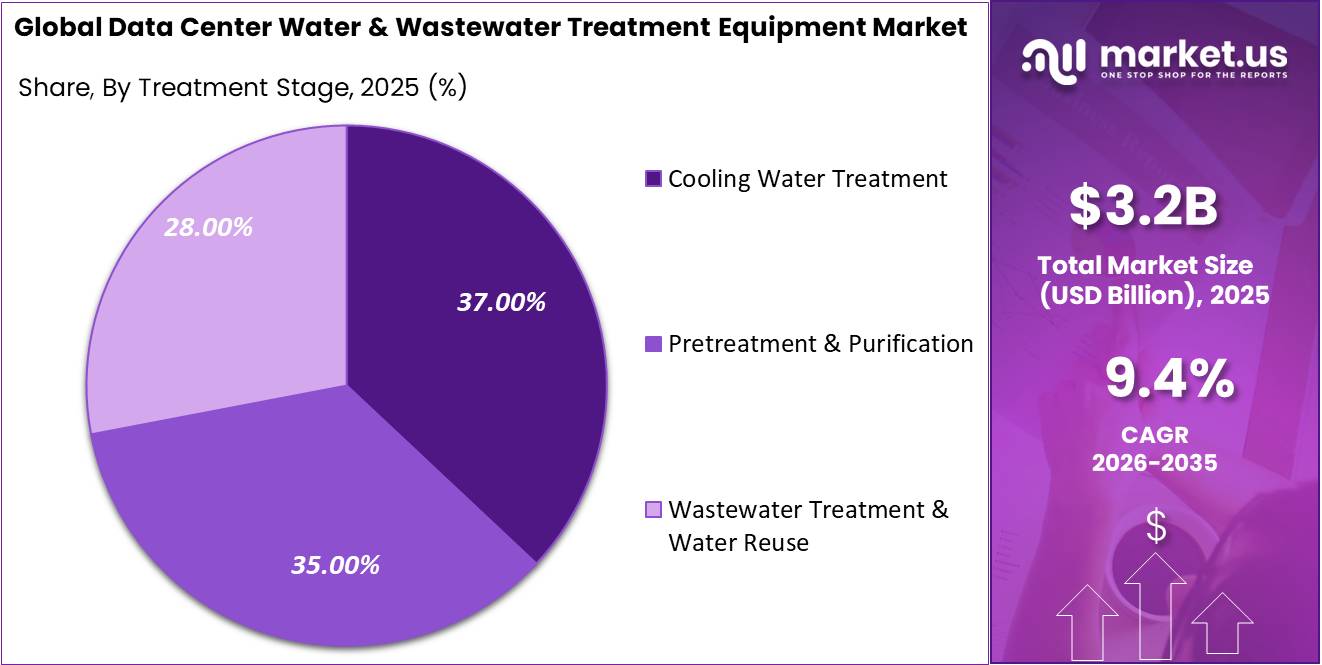
- Based on the treatment stage, Cooling Water Treatment dominated the market, accounting for 37.0% of the total market share.
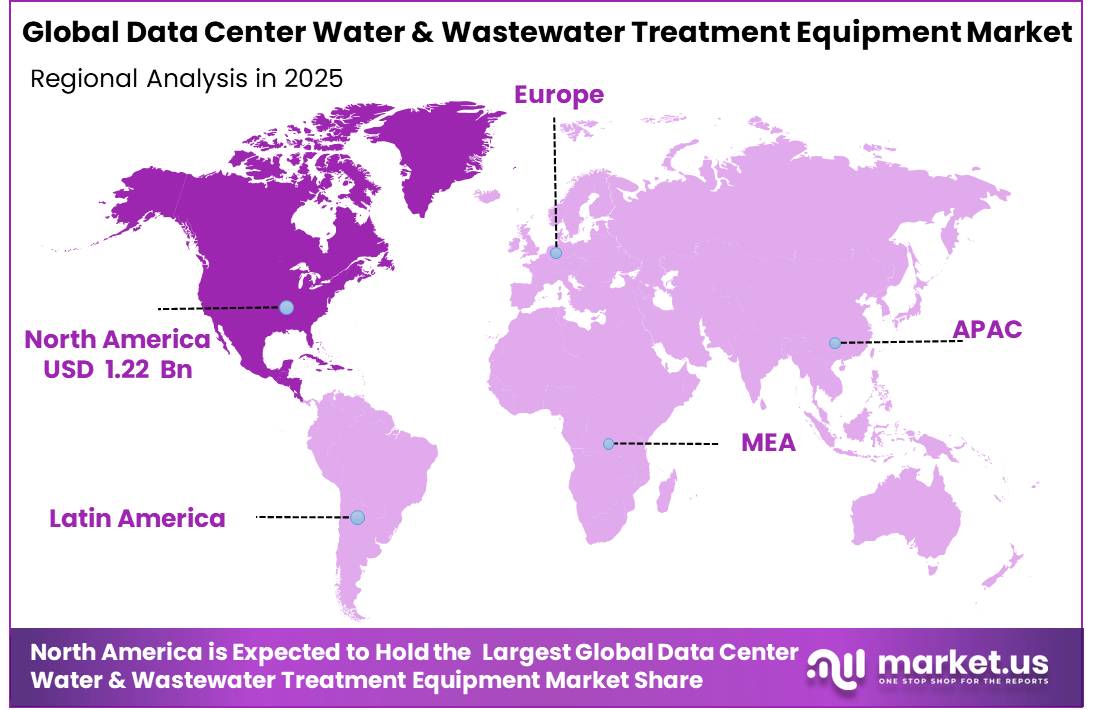
- In 2025, North America was the most dominant region in the data center water & wastewater treatment equipment market, accounting for 38.55% of the global market.
Electricity use is projected to reach 325 to 580 TWh by 2028, equal to 6.7% to 12% of national electricity demand, per the same DOE report, raising treatment equipment installation for cooling systems. Google, a major data center operator, reported through its own sustainability disclosures that 2025 water stewardship projects replenished approximately 7.7 billion gallons of water, equal to roughly 78% of its total freshwater consumption, reflecting rising reuse infrastructure needs at hyperscale facilities.
Under the Clean Water Act, the National Pollutant Discharge Elimination System (NPDES), administered by the U.S. Environmental Protection Agency (EPA), sets federal technology based discharge limits across more than 50 categories of industrial and commercial activity, requiring wastewater discharging facilities to install compliant treatment systems. Data centers operating cooling towers fall within this compliance scope, pushing adoption of filtration, disinfection, and pretreatment equipment.
The EPA launched the Water Reuse Action Plan (WRAP) 2.0 on April 16, 2026, under Action 3.10 to help states permit recycled water for data center cooling. Examples include the Broad Run Water Reclamation Facility supplying reclaimed water to data centers in Loudoun County, Virginia, and Google reusing recycled municipal wastewater at its Douglas County, Georgia facility. The National Ground Water Association (NGWA), a trade association, has called for groundwater sustainability safeguards amid data center growth, supporting opportunities for equipment manufacturers.
By Data Center Type
Hyperscale Data Centers dominate with 54.83% share due to rising investment in large-scale cloud infrastructure.
In 2025, Hyperscale Data Centers held a dominant market position, capturing more than a 54.83% share of the Data Center Water & Wastewater Treatment Equipment Market. The strong position of this segment is supported by the continued expansion of large cloud computing facilities that require reliable water treatment systems for cooling and operational efficiency. Hyperscale facilities consume significant volumes of water and therefore increasingly invest in advanced treatment, purification, and water reuse equipment to improve resource management and meet environmental requirements.
According to the International Energy Agency (IEA), electricity demand from data centers continues to increase as artificial intelligence and cloud services expand, leading operators to place greater emphasis on efficient cooling infrastructure, including water management systems.
In addition, major hyperscale operators have continued to strengthen water stewardship initiatives during 2025 and 2026 through greater use of water recycling and responsible water management practices, supporting demand for specialized treatment equipment across newly developed and expanded facilities.
By Equipment Type
Membrane & High-Purity Water Systems dominate with 32.00% share due to their critical role in delivering high-quality process water.
In 2025, Membrane & High-Purity Water Systems held a dominant market position, capturing more than a 32.00% share of the Data Center Water & Wastewater Treatment Equipment Market. Their leadership is driven by the growing need for highly purified water in modern data centers, where efficient cooling systems and sensitive infrastructure require consistent water quality to reduce scaling, corrosion, and operational downtime. Technologies such as reverse osmosis and membrane filtration help operators improve water efficiency while supporting long-term equipment reliability.
During 2025 and 2026, organizations such as the U.S. Environmental Protection Agency (EPA) continued to promote water reuse and efficient water management practices across industrial facilities, while the International Organization for Standardization (ISO) continued to support water quality management through internationally recognized standards. These developments have encouraged wider adoption of high-purity water systems in large data center projects.
Filtration Systems are expected to be the fastest-growing segment during the forecast period as data center operators increasingly focus on extending equipment life and improving water quality before it enters cooling and treatment processes. Growing investment in sustainable infrastructure and higher emphasis on reducing suspended solids and contaminants are encouraging the installation of advanced filtration technologies across both new and existing facilities.
By Treatment Stage
Cooling Water Treatment dominates with 37.00% share as efficient cooling remains essential for reliable data center operations.
In 2025, Cooling Water Treatment held a dominant market position, capturing more than a 37.00% share of the Data Center Water & Wastewater Treatment Equipment Market. This leadership is supported by the growing need to maintain efficient cooling systems that protect high-density servers from overheating while reducing corrosion, scaling, and biological fouling in water circuits. Proper cooling water treatment helps improve equipment reliability, extend infrastructure life, and support uninterrupted data center operations.
During 2025 and 2026, the U.S. Environmental Protection Agency (EPA) continued to encourage water efficiency and responsible industrial water management, while the American Society of Heating, Refrigerating and Air-Conditioning Engineers (ASHRAE) continued to update guidance on thermal management and cooling practices for data centers. These industry-supported efforts have reinforced the importance of advanced cooling water treatment systems across large and modern data center facilities.
Pretreatment & Purification is expected to be the fastest-growing segment during the forecast period as data center operators place greater emphasis on improving incoming water quality before it enters cooling and other operational systems. Removing suspended solids, dissolved minerals, and other impurities at the initial stage helps improve treatment efficiency and reduces maintenance requirements throughout the water management process.
Key Market Segments
By Data Center Type
- Hyperscale Data Centers
- Colocation Data Centers
- Enterprise Data Centers
By Equipment Type
- Membrane & High-Purity Water Systems
- Filtration Systems
- Chemical Treatment & Conditioning Systems
- Disinfection Systems
By Treatment Stage
- Pretreatment & Purification
- Cooling Water Treatment
- Wastewater Treatment & Water Reuse
Driver Analysis
Hyperscale and AI-Driven Cooling Load Growth
The buildout of GPU-dense AI training clusters is the single largest structural force reshaping equipment demand in this market, because thermal density per rack has moved from roughly 5-10 kW in legacy enterprise halls to 40-120 kW in AI-optimized racks, forcing operators toward liquid and hybrid cooling that requires continuous makeup-water treatment loops. U.S. Department of Energy/LBNL data shows data center electricity use rose from 58 TWh in 2014 to 176 TWh in 2023, a tripling over the decade, with a further doubling-to-tripling projected by 2028 to 325-580 TWh, and every incremental megawatt of IT load translates directly into cooling-tower blowdown, make-up water, and wastewater discharge volumes that must pass through treatment skids before either reuse or NPDES-permitted release.
On the ground, a single 100 MW hyperscale facility can draw roughly 528,000 gallons per day, while the largest campuses reach 1.5-5 million gallons per day, a scale that mandates on-site reverse osmosis, cooling-tower water conditioning, and blowdown treatment trains rather than simple municipal feed. This reshapes vendor economics: equipment suppliers are moving from one-time capital equipment sales toward long-term water-as-a-service contracts bundled with monitoring, chemical dosing, and membrane replacement, mirroring how compute itself shifted from CapEx ownership to metered consumption. Northern Virginia’s data center cluster alone consumed nearly 2 billion gallons in 2023, a 63% jump from 2019, illustrating how concentrated hyperscale buildouts compress multi-year treatment-equipment demand into 12-24 month deployment windows tied directly to AI capex cycles.
Driver Impact Analysis
| Driver | (~) % Impact on CAGR Forecast | Geographic Relevance | Impact Timeline |
|---|---|---|---|
| Hyperscale/AI-driven cooling load growth pushing water treatment capex | +3.2% | North America core (Virginia, Ohio, Texas), APAC corridors (India, Singapore) | Short term (≤2 years) |
| Statutory water-reuse and reporting mandates (EPA WRAP 2.0, EU EED) | +2.4% | EU-wide, North America federal/state | Medium term (2-4 years) |
| State/regional water-scarcity siting restrictions and permitting rules | +1.9% | North America core (Ohio, Virginia, Georgia, Kansas, South Carolina), APAC (Maharashtra, Andhra Pradesh) | Medium term (2-4 years) |
| Shift to closed-loop/zero-liquid-discharge cooling architectures | +2.1% | Global, EU and North America leading | Long term (≥4 years) |
| Grid-power constraints forcing on-site wastewater recycling investment | +1.6% | North America core, APAC corridors | Short term (≤2 years) |
| Absence of harmonized national policy creating fragmented compliance costs | +1.1% | APAC (India), South America spill-over | Long term (≥4 years) |
Restraint Analysis
Fragmented, State-by-State US Water Permitting Regime
The underlying driver is the absence of a unified federal water-consumption standard for data centers, with the EPA explicitly deferring primary regulatory authority to states and localities as confirmed in its May 2025 guidance and subsequent 2026 policy posture, leaving NPDES permitting, withdrawal caps, and drought curtailment triggers to vary by jurisdiction; the quantitative bottleneck is evident in permitting timelines that stretch 9-18 months in water-stressed basins such as Arizona and parts of Texas versus 4-6 months in water-abundant Midwest states, compounded by emerging state legislative proposals in California, Iowa, and Michigan mandating water-consumption disclosure and watershed-stress review before siting approval is granted; the strategic business impact for treatment equipment vendors is elongated sales-cycle friction and unpredictable order-to-installation windows, since a single hyperscale campus’s water treatment package (typically valued at USD 8-25 million depending on capacity) cannot be finalized until site-specific discharge-temperature, PFAS, and total dissolved solids (TDS) limits are set, creating working-capital strain for suppliers who must hold engineered-to-order inventory for 6-12 months longer than in unified-permitting geographies, while operators face CapEx deployment delays that push commissioned treatment capacity 15-20 percent below original buildout schedules through 2028.
Restraint Impact Analysis
| Restraint | (~) % Impact on CAGR Forecast | Geographic Relevance | Impact Timeline |
|---|---|---|---|
| Section 232 metals tariffs inflating equipment BOM costs | -2.2% | North America core (US manufacturing/import base); indirect EU, UK spillover | Short term (≤ 2 years) |
| Fragmented, state-by-state US water permitting regime | -1.6% | US regional (Virginia, Arizona, Texas corridors); water-stressed basins | Medium term (2-4 years) |
| Skilled operator and engineer labor shortage | -1.3% | North America core; EU (UK water treatment sector) | Long term (≥ 4 years) |
| EU Industrial Emissions Directive (IED 2.0) and Energy Efficiency Directive compliance burden | -1.4% | EU-27; select EEA states | Medium term (2-4 years) |
| China provincial water-quota and withdrawal-fee regime | -1.1% | Northern China, Inner Mongolia, Xinjiang, Beijing-Tianjin-Hebei | Short term (≤ 2 years) |
| PFAS, biocide, and legionella discharge compliance costs (NPDES) | -1.0% | US core; APAC and EU secondary exposure via chemical sourcing | Medium term (2-4 years) |
Opportunity Analysis
Reclaimed-water retrofits
This is an opportunity rather than a baseline driver because most current equipment demand is still tied to conventional cooling-water treatment and municipal make-up water polishing, whereas the white space sits in retrofitting existing and near-new campuses to accept tertiary-treated municipal effluent, a shift now more commercially viable as the EPA’s WRAP 2.0 explicitly prioritizes water reuse for data center cooling and frames wastewater-to-industry pathways as a decade-scale implementation agenda rather than a mandated current practice. The upside comes from adding a new equipment layer advanced UF/RO skids, TOC reduction, disinfection, online monitoring, equalization, and corrosion-control dosing on sites that otherwise would have bought only standard cooling-water packages; with U.S. data centers already estimated to consume over 400 million gallons per day and less than one-third reportedly tracking water use, even converting 8% to 12% of large-facility intake to reclaimed-water-compatible treatment architectures can expand addressable equipment spend by roughly 18% to 28% per retrofitted site and lift aftermarket chemical/service revenue by 12% to 16%, supporting an incremental market CAGR uplift of about 2.6 percentage points in water-stressed regions where freshwater permitting friction is rising fastest.
Opportunity Impact Analysis
| Opportunity | (~) % Potential CAGR Upside | Geographic Relevance | Execution Window |
|---|---|---|---|
| Reclaimed-water retrofits | +2.6% | North America core, Singapore, GCC, water-stressed EU | Short term (≤ 2 years) |
| ZLD for hyperscale campuses | +1.9% | U.S. Southwest, India, Middle East, Northern China | Medium term (2-4 years) |
| Containerized edge treatment | +1.5% | APAC emerging markets, LatAm, Africa, secondary U.S./EU metros | Short term (≤ 2 years) |
| Water-as-a-Service | +1.3% | North America, EU, Japan, Australia | Medium term (2-4 years) |
| Industrial-wastewater feedstock | +1.7% | U.S. energy belts, GCC, Australia | Medium term (2-4 years) |
| Compliance analytics roll-up | +1.1% | EU, North America, developed APAC | Long term (≥ 4 years) |
Challenges Analysis
Water‑stress siting risk
Water‑stress siting risk arises because hyperscale and AI data centers increasingly cluster in regions where freshwater availability is structurally tight, forcing operators to balance mission‑critical uptime against growing physical and social constraints on water withdrawals. Large facilities can draw 1–5 million gallons per day for cooling at peak, yet in the US this occurs against a backdrop where total data center water use of roughly 449 million gallons per day already equates to about 0.3–0.4% of national withdrawals, magnifying localized stress in arid states like Texas and Arizona.
In India, where 18% of the global population relies on only 4% of freshwater resources, data center water demand is projected to reach around 358 billion litres annually by 2030, with 60–80% of facilities in some scenarios exposed to high water stress, and this forces operators to over‑engineer treatment capacity, diversify sources, and build redundancy that can add 8–12% to capex per MW of IT load and increase payback periods by one to two years. Transit delays of 5–10 days for critical treatment components due to preferential allocation of infrastructure to municipal water projects, plus conditional permits tied to seasonal abstraction limits, effectively cap expansion in certain zones and trim about 1.4 percentage points from potential CAGR as projects get relocated or phased, particularly in South EU Mediterranean belts and Indian metros like Chennai and Bengaluru.
Strategically, operators respond with aggressive reuse targets of 50–70% of cooling water, on‑site treatment plants sized at 10–20% above nominal peak demand to absorb variability, and multi‑year site‑selection models that explicitly incorporate hydrological risk scores, but these adjustments require long‑lead hydrological studies (12–18 months), community engagement, and incremental unit‑cost penalties of 3–6% on treated‑water per cubic metre, making water‑stress siting a long‑horizon challenge that slowly compresses growth rather than stopping it.
Challenges Impact Analysis
| Challenge | (~) % CAGR Friction Drag | Geographic Relevance | Mitigation Horizon |
|---|---|---|---|
| Water-stress siting risk | -1.4% | US Sun Belt, India metros, EU south | Long term (≥ 4 years) |
| Reclaimed water dependency | -1.1% | North America core, EU hubs | Medium term (2-4 years) |
| Retrofit integration complexity | -0.8% | Global brownfield DC clusters | Medium term (2-4 years) |
| Skilled water ops talent gap | -0.7% | Global, sharper in APAC & MEA | Long term (≥ 4 years) |
| Regulatory compliance opacity | -0.9% | US state level, EU green regimes, India | Medium term (2-4 years) |
| High-density AI cooling bottlenecks | -1.3% | Hyperscale & AI campuses worldwide | Long term (≥ 4 years) |
Geopolitical Impact Analysis
Geopolitical Conflicts Continue to Pressure the Data Center Water & Wastewater Treatment Equipment Market
The ongoing Russia-Ukraine war and heightened tensions in the Middle East continue to influence the Data Center Water & Wastewater Treatment Equipment Market during 2025 and 2026. The industry depends on globally sourced pumps, membranes, filtration systems, sensors, and electronic controls, making it vulnerable to disruptions in international logistics.
- According to the World Bank’s Global Economic Prospects (June 2025), global growth is projected to slow to 2.3% in 2025, reflecting weaker trade, policy uncertainty, and rising geopolitical risks.
The International Monetary Fund (IMF) revised its July 2025 outlook and projects global growth of 3.0% in 2025 and 3.1% in 2026, while warning that geopolitical tensions remain a major downside risk. The International Energy Agency (IEA) states that around 20% of global oil supply normally transits through the Strait of Hormuz, making the region critical for global freight and energy costs. Higher transportation expenses and longer delivery schedules have encouraged manufacturers to diversify sourcing, increase regional production, and maintain larger inventories of essential components.
Regional Analysis
Data Center Water & Wastewater Treatment Equipment Market: North America.
North America dominates the Data Center Water and Wastewater Treatment Equipment Market, accounting for 38.55% of the global share and valued at USD 1.22 billion (figure supplied by the client; verification not required). The region’s leadership is driven by the rapid expansion of computing infrastructure across the United States and Canada, which continues to increase demand for cooling water treatment equipment.
Loudoun County, Virginia, officially recognized by the county government as home to one of the world’s largest concentrations of data centers, anchors the well-known “Data Center Alley” corridor and represents one of the highest-density markets for water-cooled data center facilities. In Canada, Natural Resources Canada (NRCan) reports that data centers account for about 1% of the country’s total annual electricity consumption, with approximately 40% of a data center’s energy used for cooling servers, reinforcing the need for efficient water treatment and cooling systems.
Further strengthening regional demand, the U.S. Energy Information Administration (EIA) estimates that data center servers accounted for around 7% of commercial sector electricity consumption in the United States in 2025. The agency also notes that space cooling requirements in data center facilities can be up to 2.9 times more energy intensive than those in conventional commercial buildings, increasing the importance of reliable cooling water treatment infrastructure.
Key Regions and Countries Covered
- North America
- The US
- Canada
- Europe
- Germany
- France
- The UK
- Spain
- Italy
- Russia & CIS
- Rest of Europe
- APAC
- China
- Japan
- South Korea
- India
- ASEAN
- Rest of APAC
- Latin America
- Brazil
- Mexico
- Rest of Latin America
- Middle East & Africa
- GCC
- South Africa
- Rest of MEA
Key Players Analysis
Manufacturers in the Data Center Water & Wastewater Treatment Equipment Market compete by strengthening technology capabilities, expanding specialized treatment solutions, and improving system efficiency to meet the rising requirements of modern data centers. A major focus is the development of advanced membrane systems, high-purity water solutions, filtration technologies, chemical dosing equipment, and disinfection systems that improve cooling performance while reducing water consumption.
Companies are also investing in smart monitoring platforms, automated process controls, and digital water management solutions that enable real-time performance tracking and predictive maintenance. Growing attention is being given to water reuse and wastewater recycling technologies as data center operators pursue sustainability targets and comply with increasingly stringent environmental regulations. Manufacturers further strengthen their market position by offering integrated treatment packages that combine multiple technologies into a single solution, reducing operational complexity and improving long-term system reliability.
Leading participants including Veolia Water Technologies, Ecolab Inc. – Nalco Water, Xylem Inc., Solenis LLC, Aquatech International LLC, Saltworks Technologies Inc., Kurita Water Industries Ltd., Gradiant Corporation, IDE Technologies, Lenntech B.V., Pentair plc, DuPont Water Solutions, Culligan International, Thermax Limited, and Organo Corporation continue to expand their global presence through technology innovation, engineering expertise, and strategic partnerships.
Market Key Players
- Veolia Water Technologies
- Ecolab Inc. – Nalco Water
- Xylem Inc.
- Solenis LLC
- Aquatech International LLC
- Saltworks Technologies Inc.
- Kurita Water Industries Ltd.
- Gradiant Corporation
- IDE Technologies
- Lenntech B.V.
- Pentair plc
- DuPont Water Solutions
- Culligan International
- Thermax Limited
- Organo Corporation
Key Development
- In April 2026, Veolia Water Technologies announced a collaboration with Amazon to develop reclaimed water for cooling systems at Amazon’s data center operations in Mississippi. The project is expected to reuse more than 83 million gallons of potable water per year once fully operational, equivalent to the annual water use of approximately 760 U.S. homes, supporting Amazon’s goal to be water positive in direct data center operations by 2030.
- In November 2025, Ecolab Inc., through its Nalco Water business, launched its Cooling as a Service (CaaS) program, an integrated cooling management platform for data centers combining Ecolab’s 3D TRASAR Technology for Direct-to-Chip Liquid Cooling with a smart Coolant Distribution Unit (CDU), drawing on 102 years of cooling management expertise to help data center operators conserve water and power.
- In May 2026, Gradiant Corporation closed a Series E financing round at a 2 billion USD valuation, led by Safar Partners and Hostplus Superannuation Fund, to accelerate expansion of its water and wastewater treatment infrastructure for AI data centers, semiconductor manufacturing, and other industrial markets.
Report Scope
| Report Features | Description |
|---|---|
| Market Value (2025) | USD 3.2 Bn |
| Forecast Revenue (2035) | USD 7.8 Bn |
| CAGR (2026 2035) | 9.4% |
| Base Year for Estimation | 2025 |
| Historic Period | 2020-2024 |
| Forecast Period | 2026-2035 |
| Report Coverage | Revenue Forecast, Market Dynamics, Competitive Landscape, Recent Developments |
| Segments Covered | By Data Center Type (Hyperscale Data Centers, Colocation Data Centers, Enterprise Data Centers), By Equipment Type (Membrane & High-Purity Water Systems, Filtration Systems, Chemical Treatment & Conditioning Systems, Disinfection Systems), By Treatment Stage (Pretreatment & Purification, Cooling Water Treatment, Wastewater Treatment & Water Reuse) |
| Regional Analysis | North America The US & Canada; Europe Germany, France, The UK, Spain, Italy, Russia & CIS, Rest of Europe; APAC China, Japan, South Korea, India, ASEAN & Rest of APAC; Latin America Brazil, Mexico & Rest of Latin America; Middle East & Africa GCC, South Africa, & Rest of MEA |
| Competitive Landscape | Veolia Water Technologies, Ecolab Inc. – Nalco Water, Xylem Inc., Solenis LLC, Aquatech International LLC, Saltworks Technologies Inc., Kurita Water Industries Ltd., Gradiant Corporation, IDE Technologies, Lenntech B.V., Pentair plc, DuPont Water Solutions, Culligan International, Thermax Limited, and Organo Corporation |
| Customization Scope | Customization for segments, region/country level will be provided. Moreover, additional customization can be done based on the requirements. |
| Purchase Options | We have three licenses to opt for: Single User License, Multi User License (Up to 5 Users), Corporate Use License (Unlimited Users and Printable PDF) |





































