


Report Overview
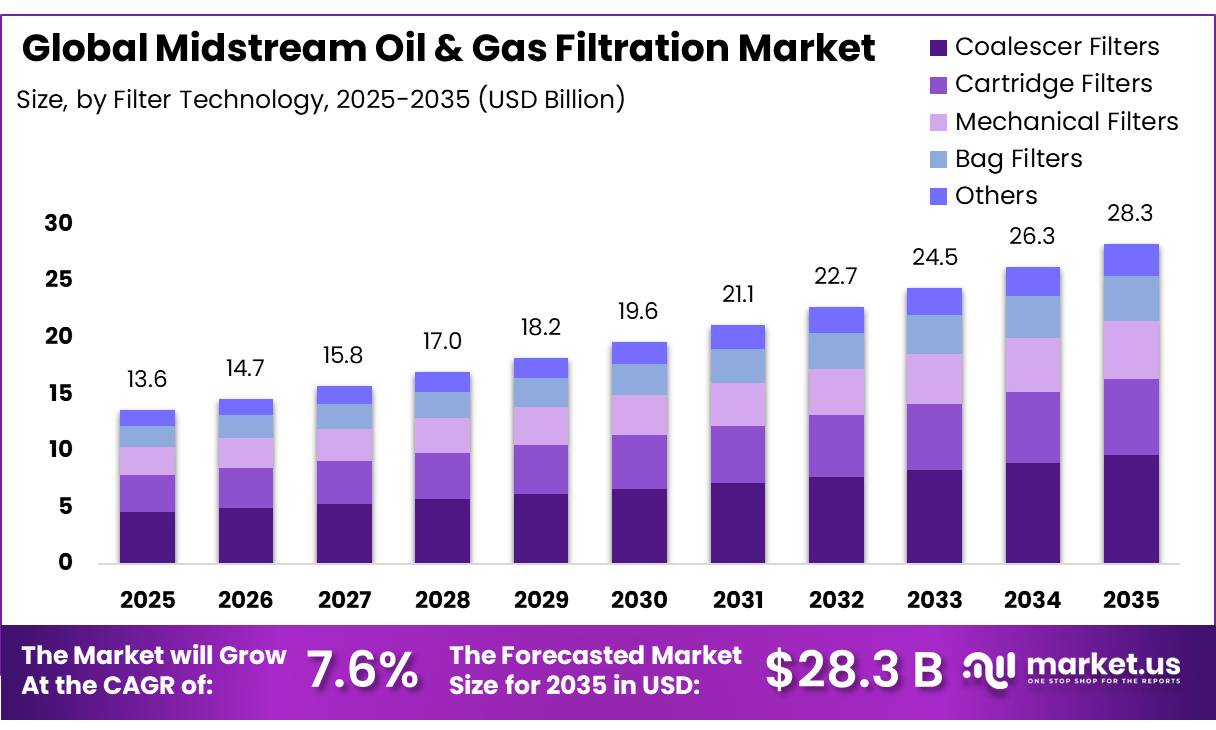
In 2025, the Global Midstream Oil And Gas Filtration Market was valued at USD 13.6 billion, and between 2026 and 2035, this market is estimated to register a CAGR of 7.6%, reaching about USD 28.3 billion by 2035. North America held a dominant market position, capturing more than a 38.10% share, holding USD 5.19 billion in revenue.
Midstream oil and gas filtration covers equipment that removes solids, liquids, aerosols, and chemical contaminants from natural gas and hydrocarbon streams before compression, transportation, liquefaction, storage, or transfer. The market serves gas processing plants, compressor stations, pipelines, liquefied natural gas terminals, storage facilities, refineries, and petrochemical sites.
- In March 2026, the United States Energy Information Administration reported that marketed natural gas production averaged 118.5 billion cubic feet per day in 2025.
Key Takeaways
- The global midstream oil and gas filtration market was valued at USD 13.6 billion in 2025.
- The global market is projected to grow at a CAGR of 7.6% and is estimated to reach USD 28.3 billion by 2035.
- On the basis of filter technology, coalescer filters dominated the market, constituting 34.0% of the total market share.
- Based on filter media, metallic filters led the midstream oil and gas filtration market, comprising 27.0% of the total market.
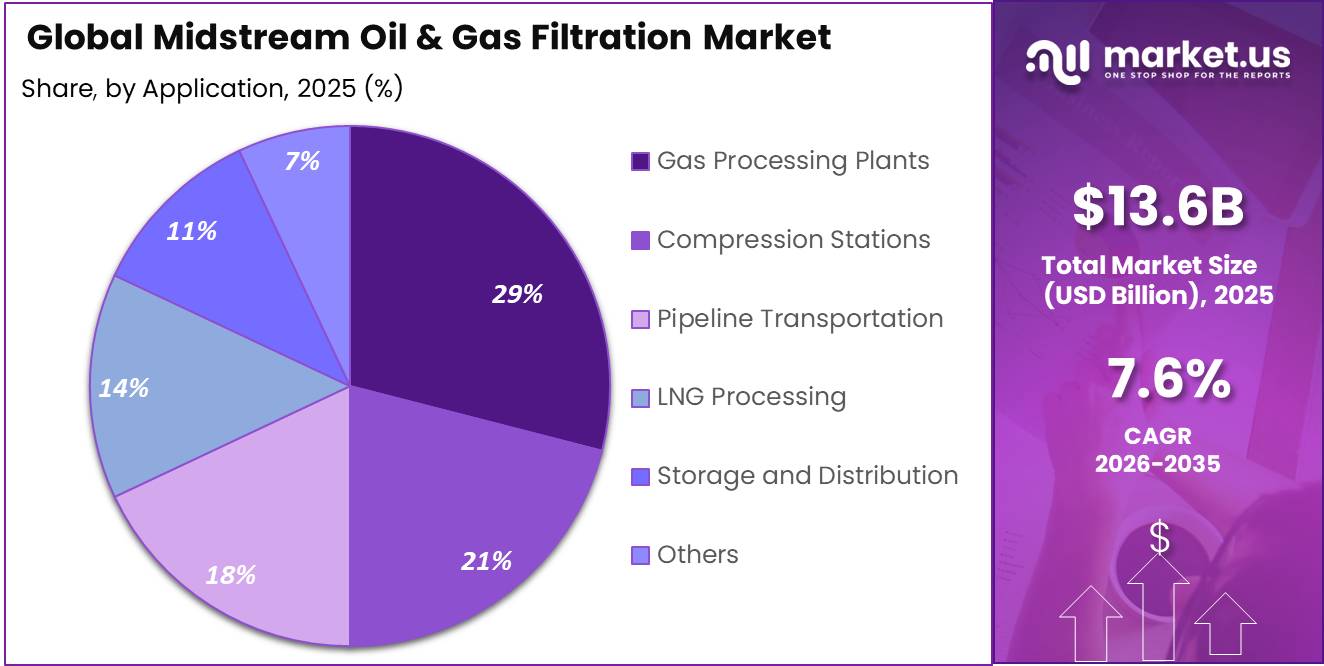
- Among applications, gas processing plants held a major share in the market, accounting for 29.0% of the market share.
- Among end users, natural gas processing companies dominated the market, representing 27.0% of the total market share.
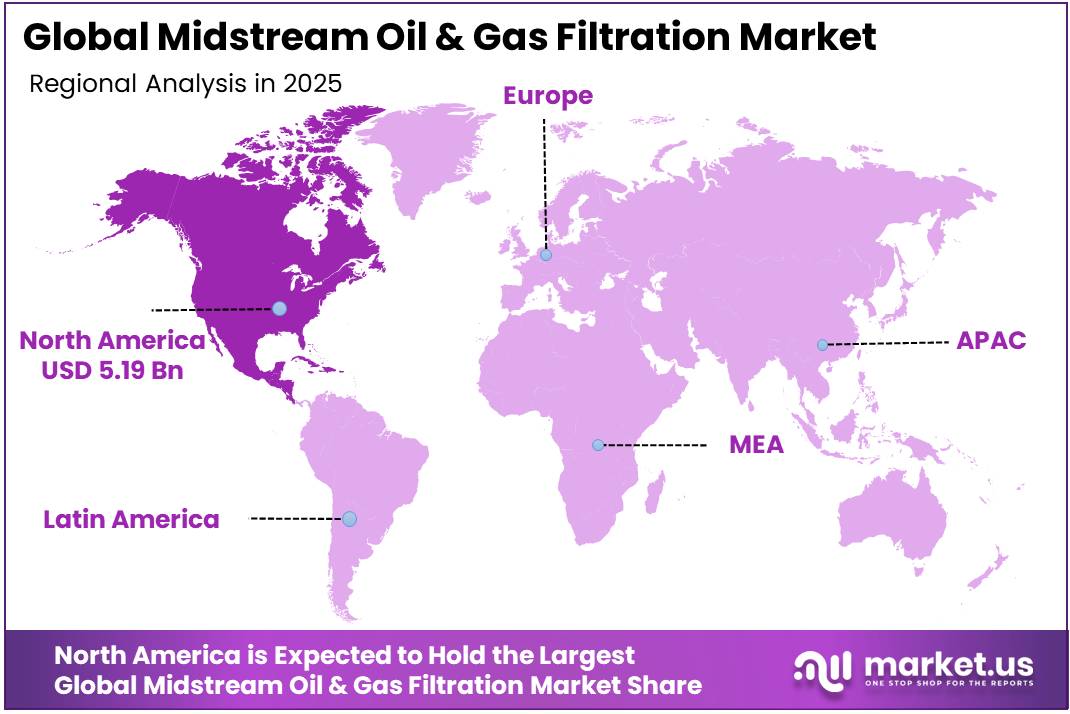
- In 2025, North America was the most dominant region in the midstream oil and gas filtration market, accounting for 38.1% of the total market.
The industrial base is supported by a large and expanding pipeline network that requires continuous protection of compressors, meters, valves, and downstream equipment. In July 2026, the Pipeline and Hazardous Materials Safety Administration recorded 413,330 miles of United States gas transmission and gathering pipelines for 2025, including 113,170 miles of gathering lines. These assets create recurring demand for coalescer, cartridge, bag, mechanical, activated-carbon, metallic, fiberglass, and polymer filtration systems.
Growth is being driven by higher liquefied natural gas throughput and new takeaway infrastructure. The International Energy Agency stated in January 2026 that global liquefied natural gas production increased by almost 7% in 2025, equal to 38 billion cubic metres. In May 2026, the Energy Information Administration reported that developers planned 44.9 billion cubic feet per day of new United States pipeline capacity for 2026 and 2027, with 70% already under construction.
Government safety and emissions initiatives are strengthening filtration, monitoring, and asset-integrity requirements. The Pipeline and Hazardous Materials Safety Administration updated 37 reference standards under federal pipeline rules, with major provisions taking effect in January 2026. In February 2026, the Environmental Protection Agency extended the reporting-year 2025 greenhouse-gas deadline for petroleum and natural gas systems. Future opportunities remain strongest in high-efficiency liquid removal, compressor protection, liquefied natural gas pretreatment, automated condition monitoring, low-emission vent filtration, and retrofit systems for aging assets. Digital sensing can improve maintenance timing and reliability.
Filter Technology Analysis
Coalescer Filters dominate with 34.00% as reliable separation protects gas infrastructure
In 2025, Coalescer Filters held a dominant market position, capturing more than a 34.00% share. Their leadership reflected their ability to remove liquid aerosols, water droplets, compressor oil, and fine solids from natural gas streams. These filters protect compressors, dehydration units, meters, valves, and downstream pipelines while supporting stable flow and lower maintenance requirements. Their use remains important at gas processing plants, compressor stations, liquefied natural gas facilities, and transmission systems handling variable contamination loads.
- In April 2026, according to the Federal Energy Regulatory Commission, the proposed Sabine Pass Stage 5 expansion included three liquefaction trains with 300 billion cubic feet of annual capacity each, an additional 50 billion cubic feet from a boil-off gas re-liquefaction unit, and a 7 billion cubic feet-per-day feed-gas pipeline.
Cartridge Filters are the growing segment because operators need compact, replaceable elements for capturing rust, pipe scale, sand, and other solid particles. Their simple maintenance, broad media compatibility, and suitability as prefilters support use before coalescers and sensitive equipment. Demand is expected to rise with pipeline expansions, processing upgrades, and stricter contamination-control practices across markets.
Filter Media Analysis
Metallic filters lead with 27.00% as durable media support demanding gas operations
In 2025, Metallic held a dominant market position, capturing more than a 27.00% share. Its leadership reflected strong resistance to pressure, heat, corrosion, and mechanical stress across demanding midstream operations. Sintered metal media provide stable pore structures, support cleaning and reuse, and capture solid contaminants without frequent element replacement. These qualities make metallic filters suitable for gas processing plants, compressor protection, pipeline services, refineries, petrochemical facilities, and storage terminals requiring consistent performance under changing operating conditions.
- In June 2026, according to the United States Energy Information Administration, natural gas plant liquids production reached 3,935,222 million cubic feet during 2025. Monthly production in April 2026 totaled 341,899 million cubic feet, indicating substantial processing volumes requiring dependable contaminant control.
Activated Carbon is the growing segment because it adsorbs mercury, volatile organic compounds, hydrogen sulfide, odors, and other trace contaminants from gas streams. Its importance is increasing in liquefied natural gas pretreatment, pipeline-quality gas production, vapor recovery, and amine purification. Granular and pelletized formats offer flexible system design, while carbon reactivation can support lower waste generation and longer material use across processing facilities.
Application Analysis
Gas Processing Plants dominate with 29.00% as continuous purification protects critical equipment
In 2025, Gas Processing Plants held a dominant market position, capturing more than a 29.00% share. Their leadership reflected the continuous need to remove water, acid gases, heavy hydrocarbons, nitrogen, solids, and other impurities before pipeline delivery or downstream recovery. Filtration protects separators, dehydration units, compressors, meters, valves, and heat exchangers, helping plants maintain product quality, stable throughput, and reliable equipment performance across changing feed conditions.
- In April 2026, according to the Federal Energy Regulatory Commission, the Southeast Compression Utility and Reliability Expansion Project received authorization for new compression facilities in Louisiana and Mississippi and was designed to provide 280,000 dekatherms per day of firm natural gas transportation capacity.
Compression Stations are the growing segment because pipeline systems require pressure restoration during transportation. Filters capture liquids, oil mist, rust, and particulate matter that can damage rotating components or reduce efficiency. Transmission expansion, gas movements, compressor upgrades, and stricter reliability expectations are supporting demand for coalescing and cartridge systems. Growth will also depend on condition monitoring, lower pressure loss, longer service intervals, and modern filtration designs suited to new stations and retrofits.
End User Analysis
Natural Gas Processing Companies dominate with 27.00% as filtration protects gas quality
In 2025, Natural Gas Processing Companies held a dominant market position, capturing more than a 27.00% share. Their leadership reflected the need to condition raw gas before pipeline delivery, storage, liquefaction, or use. These companies depend on coalescers, cartridges, metallic media, and activated carbon to remove liquids, aerosols, solids, mercury, and contaminants. Reliable filtration protects compressors, dehydration units, meters, valves, and heat exchangers while supporting stable product quality and plant operation.
- In February 2026, according to the United States Energy Information Administration, natural gas pipeline projects completed during 2025 added approximately 3 billion cubic feet per day of capacity. Around 85% of this capacity, equal to 5.3 billion cubic feet per day, delivered gas to the South Central region.
Pipeline Operators are the growing segment as expanding transmission and gathering networks require contaminant control at compressor stations, metering sites, interconnections, and delivery points. Filters reduce damage from rust, pipe scale, oil mist, water, and black powder. Demand is also supported by system upgrades, higher throughput, integrity programs, and the need for lower pressure loss, longer service intervals, and predictable maintenance.
Key Market Segments
By Filter Technology
- Coalescer Filters
- Cartridge Filters
- Mechanical Filters
- Bag Filters
- Others
By Filter Media
- Activated Carbon
- Metallic
- Fiberglass
- Synthetic Polymer
- Cellulose
- Others
By Application
- Gas Processing Plants
- Compression Stations
- Pipeline Transportation
- LNG Processing
- Storage and Distribution
- Others
By End User
- Natural Gas Processing Companies
- Pipeline Operators
- LNG Operators
- Storage Terminal Operators
- Refineries
- Petrochemical Companies
- Others
Driver Analysis
Pipeline & LNG capacity expansion driving filtration intensity
Between 2024 and 2026, sanctioned midstream capacity—pipeline mileage and LNG handling—has continued to grow, with multiple sources pointing to multi‑billion‑dollar pipeline programs in North America, expanded trunk lines in the Middle East, and rising interconnector capacity in Europe to diversify away from single‑supplier dependencies. Public forecasts suggest midstream filtration revenues rising from roughly USD 3.0 billion in 2026 toward the upper single‑digit billions by the early 2030s, driven largely by throughput growth rather than pure price.
Every additional billion cubic feet per day of gas throughput or several hundred thousand barrels per day of liquids adds incremental loading on filters, strainers and coalescers to protect compressors, valves and cryogenic equipment; operators are targeting contamination levels well below 5–10 ppm solids and strict moisture/condensate control to avoid CAPEX‑intensive equipment failures and unplanned downtime, which can cost USD 0.5–1.5 million per event for large compressor stations.
The structural impact on business models is material: filtration suppliers move from unit‑based hardware sales to lifecycle‑oriented offerings, combining engineered skids, cartridges, and long‑term service agreements indexed to throughput or operating hours, which justifies the ~1.9 percentage‑point uplift to CAGR as greenfield and brownfield capacity add recurring consumables and service revenue streams over the 2–4 year build‑out horizon.
Drivers Impact Analysis
| Driver | (~) % Impact on CAGR | Geographic Relevance | Impact Timeline |
|---|---|---|---|
| Pipeline & LNG capacity expansion driving filtration intensity | +1.9% | North America core, APAC corridors, Middle East trunk lines, EU interconnects | Medium term (2–4 years) |
| Tightening emissions, methane and effluent regulations | +1.6% | North America core, EU, UK, select APAC (China, India), GCC | Long term (≥ 4 years) |
| Digitalization, IoT and predictive maintenance in filtration | +1.3% | North America, EU, APAC industrial clusters | Medium term (2–4 years) |
| Aging pipeline and storage infrastructure retrofits | +1.1% | North America legacy, CIS, Latin America, parts of APAC | Short–Medium term (≤ 4 years) |
| Shift in production patterns, shale & gas-heavy mix | +1.0% | North America, APAC (China, India), Middle East, Latin America | Medium term (2–4 years) |
| Energy-transition led product innovation and low-emission designs | +0.9% | EU, UK, North America, APAC transition hubs | Long term (≥ 4 years) |
Restraint Analysis
Capex volatility and project deferrals
In practical terms, when benchmark crude moves by 20–30 USD/barrel within 6–12 months and gas prices swing by 30–40%, operators typically cut, re‑sequence or slow projects, translating into filtration order push‑outs of 12–24 months and, in some cases, cancellation of optional capacity; the impact is magnified by the fact that filtration hardware is often procured late in the EPC cycle, so any pipeline or LNG terminal delay immediately suppresses related filtration demand. Industry supply chain commentary further highlights critical equipment lead times, permitting delays and storage constraints as familiar bottlenecks that compound financial caution.
Strategically, this restraint destroys value by compressing OEM and filtration vendor revenue visibility, forcing them to maintain inventory buffers and engineering resources against a lumpy order book, which in turn erodes margins through under‑utilization and discounting pressure when projects resume in clustered waves; smaller filtration suppliers exposed to single regions can see year‑on‑year order variability exceeding 15–20%, undermining ROI on advanced product development. Over a 2–4 year horizon, such capex cyclicality plausibly trims ~2.0 percentage points from otherwise attainable CAGR, especially in North America, the Middle East and APAC corridors where large trunkline and LNG programs are most exposed to volatile price signals and shifting policy around hydrocarbons.
Restraint Impact Analysis
| Restraint | (~) % Impact on CAGR Forecast | Geographic Relevance | Impact Timeline |
|---|---|---|---|
| Capex volatility and project deferrals | -2.0% | North America core, Middle East, APAC corridors | Medium term (2–4 years) |
| High upfront cost and long payback | -1.7% | Developing APAC, Latin America, Africa, CIS | Long term (≥ 4 years) |
| Supply-chain stress and long lead times | -1.5% | Global, esp. NA/EU/APAC industrial zones | Short–Medium term (≤ 4 years) |
| Operational complexity, fouling and O&M burden | -1.3% | Global pipelines, gas plants, terminals | Medium term (2–4 years) |
| Competition from alternative separation & deferral to minimal spec | -1.1% | Cost-sensitive NA/APAC/MEA segments | Medium term (2–4 years) |
| Energy-transition demand erosion | -0.9% | EU/UK, North America, APAC transition hubs | Long term (≥ 4 years) |
Opportunity Analysis
Adjacent industrial & high‑purity filtration verticals
If midstream filtration vendors leverage their expertise in high‑pressure, high‑temperature, corrosive environments and coalescing technologies to address industrial air and gas filtration segments where purity specifications can be in the ppb–ppm range and downtime costs reach six‑figure levels per incident, they could capture incremental TAM on top of the ~USD 3–5 billion midstream filtration revenue pool suggested by multiple sources, effectively accessing a broader industrial filtration market that is several times this size.
An aggressive adjacency strategy—e.g., redeploying midstream‑grade technologies into electronics fabs, chemical plants and data‑center cooling systems—could realistically add 20–30% revenue uplift over a 5–7 year horizon, corresponding to roughly +2.2 percentage points of CAGR upside, as product platforms are repackaged, certified and sold into new verticals with higher margin potential and more diversified cycle exposure compared to oil & gas alone.
Opportunity Impact Analysis
| Opportunity | (~) % Potential CAGR | Geographic Relevance | Execution Window |
|---|---|---|---|
| Adjacent industrial & high-purity filtration verticals | +2.2% | APAC industrial clusters, EU, North America | Medium term (2–4 years) |
| SaaS-style filtration performance & availability contracts | +1.9% | North America core, EU, advanced APAC | Short–Medium term (≤ 4 years) |
| Data-center, LNG and hydrogen corridor M&A roll-ups | +1.8% | North America, Middle East, APAC hubs | Medium term (2–4 years) |
| Effluent reuse and water-positive midstream offerings | +1.6% | EU/UK, North America, APAC urban corridors | Long term (≥ 4 years) |
| Modular rental and temporary filtration fleets | +1.4% | Global project markets, APAC/MEA, LatAm | Short–Medium term (≤ 4 years) |
| Cross-industry OEM partnerships & platforming | +1.3% | Global, esp. EU, Japan, Korea, US | Medium–Long term (≥ 4 years) |
Challenges Analysis
Raw‑material and component volatility
Over 2024–2026, steel price swings of 20–40% year‑on‑year, elastomer and polymer cost inflation in the mid‑teens percent, and episodic scarcity of specialty alloys have forced filtration fabricators to reprice projects multiple times, while extended lead times for flanges, valves and tailored housings stretching from typical 8–10 weeks toward 14–20 weeks make it difficult to align EPC schedules for LNG or pipeline projects in the Middle East and Asia-Pacific.
Strategically, this friction forces corporate adjustments such as multi‑sourcing, hedging, buffer‑stock strategies and dynamic contract structures with escalation clauses, all of which add transactional complexity, dilute negotiating leverage and raise SG&A overhead; assuming raw‑material volatility takes 1–2 percentage points off achievable project NPV for a significant share of the market and induces cautious CAPEX pacing, a modeled drag of around -1.4 percentage points on the theoretical growth ceiling over the next 2–4 years is consistent with observed steel and component price dispersion and the documented difficulty filtration vendors have in meeting accelerated schedules without sacrificing margin.
Challenges Impact Analysis
| Challenge | (~) % CAGR Friction Drag | Geographic Relevance | Mitigation Horizon |
|---|---|---|---|
| Raw-material and component volatility | -1.4% | North America core, EU steel hubs, APAC fabrication | Medium term (2–4 years) |
| Complex supply chains and long lead times | -1.3% | Global energy corridors, NA/EU/APAC logistics | Medium term (2–4 years) |
| Feed variability, fouling and reliability risk | -1.2% | Global pipelines, gas plants, LNG | Long term (≥ 4 years) |
| Talent, digitalization and change-management gap | -1.1% | Global, esp. NA/EU/APAC large operators | Long term (≥ 4 years) |
| Integration with legacy assets and multi-OEM environments | -1.0% | North America legacy, CIS, LatAm, MEA | Medium term (2–4 years) |
| Trade, tariff and freight volatility | -0.9% | NA/EU importers, APAC/MEA project hubs | Short–Medium term (≤ 4 years) |
Geopolitical Impact Analysis
Middle East Disruptions and Trade Realignment Reshaping Midstream Filtration Demand
Geopolitical conflict is reshaping midstream filtration through disrupted liquefied natural gas flows, terminal utilization, and investment uncertainty. In July 2026, the International Energy Agency reported that the Strait of Hormuz had carried almost 20% of liquefied natural gas supply. Gulf loadings fell by 35 billion cubic metres, while non-Gulf production added 27 billion cubic metres.
- In January 2026, 27 European Union member states adopted a stepwise ban on Russian pipeline gas and liquefied natural gas. Russian gas represented an estimated 13% of European Union imports in 2025, worth more than €15 billion annually, increasing pressure on terminals and interconnections.
Equipment procurement is exposed to trade policy. In June 2026, the White House reported 50% tariffs on metal products, 25% on derivative products, and a temporary 15% on fixed industrial machinery and power equipment. These measures can raise costs for filter housings, pressure vessels, skids, replacement components, and fabrication inputs used across midstream filtration systems.
These developments encourage localized fabrication, supplier diversification, and filtration capacity at rerouted terminals and pipeline systems. Enforcement can impose penalties of at least €2.5 million on individuals, €40 million on companies, or 3.5% of worldwide annual turnover. Consequently, operators face stricter origin verification, longer supplier qualification, and greater demand for traceable materials and standardized equipment.
Regional Analysis
North America dominates with 38.10% and USD 5.19 billion, while Europe grows fastest
In 2025, North America held a dominant position in the Midstream Oil & Gas Filtration Market, capturing more than a 38.10% share and generating USD 5.19 billion. Its leadership was supported by gas-processing assets, pipeline networks, liquefied natural gas terminals, and operating standards.
- In October 2025, the United States Energy Information Administration reported that United States liquefaction capacity stood at 15.4 billion cubic feet per day, sustaining filtration demand across feed-gas treatment, compression, transfer, and export facilities.
Europe is the fastest-growing region, driven by liquefied natural gas diversification, storage security, pipeline interconnections, and tighter emissions requirements. The European Commission reported that liquefied natural gas represented 45% of European Union gas imports in 2025, while import volumes reached 131 billion cubic metres. Regional regasification capacity also expanded by 8%, supporting investment in coalescers, cartridge systems, activated-carbon units, and metallic filters used at terminals, compressor stations, storage sites, and cross-border transmission infrastructure.
Key Regions and Countries Covered
- North America
- The US
- Canada
- Europe
- Germany
- France
- The UK
- Spain
- Italy
- Russia & CIS
- Rest of Europe
- APAC
- China
- Japan
- South Korea
- India
- ASEAN
- Rest of APAC
- Latin America
- Brazil
- Mexico
- Rest of Latin America
- Middle East & Africa
- GCC
- South Africa
- Rest of MEA
Key Players Analysis
Midstream oil and gas filtration manufacturers are strengthening competitiveness through higher-flow designs, compact vessels, durable media, and aftermarket coverage. In 2026, Pall Corporation introduced SepraSol Plus horizontal liquid-gas coalescers and high-flow gas filters to reduce vessel size and element count while maintaining 99.98% filtration efficiency. Eaton expanded mechanically cleaned filtration with laser-perforated elements designed for uniform particle retention and longer operating life.
Strategic consolidation and service reach are also shaping company positioning. Donaldson completed its approximately USD 829 million acquisition of Facet Filtration in May 2026, adding fuel and fluid filtration capabilities and an installed customer base. Pall, Eaton, Donaldson, Jonell Systems, CECO Environmental, and Graver Technologies compete through application engineering, replacement-element availability, material selection, and lifecycle-cost reduction.
Market Key Players
- Pall Corporation
- Parker Hannifin Corporation
- Eaton Corporation plc
- Pentair plc
- 3M Company
- Jonell Systems
- Graver Technologies, LLC
- CECO Environmental Corp.
- FTC Filters, LLC
- Clark-Reliance Corporation
- Hilliard Corporation
- Donaldson Company, Inc.
- Fil-Trek Corporation
- Saifilter
- Brother Filtration Equipment Co., Ltd.
Key Development
- In February 2026, Donaldson Company, Inc. introduced ArmorSeal, a next-generation air-filtration technology developed for high-vibration and high-dust operating environments. The design uses a precision spin-welded joint and reduces filter-removal force by 30% compared with the company’s RadialSeal technology.
- In June 2026, CECO Environmental Corp. completed its acquisition of Thermon Group Holdings, expanding its portfolio with industrial process-heating and thermal-management capabilities. The combined business continues to operate under the CECO Environmental name and remains led by Chief Executive Officer Todd Gleason.
- In February 2026, FTC Filters showcased its gas-processing filtration technologies at the Laurence Reid Gas Conditioning Conference. A Permian Basin facility using its Invicta filtration system extended amine-filter operating periods from weekly replacements to more than four weeks, while its Cyphon technology addressed inlet-gas coalescing requirements.
Report Scope
| Report Features | Description |
|---|---|
| Market Value (2025) | USD 13.6 Bn |
| Forecast Revenue (2035) | USD 28.3 Bn |
| CAGR (2026-2035) | 7.6% |
| Base Year for Estimation | 2025 |
| Historic Period | 2020-2024 |
| Forecast Period | 2026-2035 |
| Report Coverage | Revenue Forecast, Market Dynamics, Competitive Landscape, Recent Developments |
| Segments Covered | By Filter Technology (Coalescer Filters, Cartridge Filters, Mechanical Filters, Bag Filters, and Others), By Filter Media (Activated Carbon, Metallic, Fiberglass, Synthetic Polymer, Cellulose, and Others), By Application (Gas Processing Plants, Compression Stations, Pipeline Transportation, LNG Processing, Storage and Distribution, and Others), By End User (Natural Gas Processing Companies, Pipeline Operators, LNG Operators, Storage Terminal Operators, Refineries, Petrochemical Companies, and Others) |
| Regional Analysis | North America – The US & Canada; Europe – Germany, France, The UK, Spain, Italy, Russia & CIS, Rest of Europe; APAC– China, Japan, South Korea, India, ASEAN & Rest of APAC; Latin America– Brazil, Mexico & Rest of Latin America; Middle East & Africa– GCC, South Africa, & Rest of MEA |
| Competitive Landscape | Pall Corporation, Parker Hannifin Corporation, Eaton Corporation plc, Pentair plc, 3M Company, Jonell Systems, Graver Technologies, LLC, CECO Environmental Corp., FTC Filters, LLC, Clark-Reliance Corporation, Hilliard Corporation, Donaldson Company, Inc., Fil-Trek Corporation, Saifilter, and Brother Filtration Equipment Co., Ltd. |
| Customization Scope | Customization for segments, region/country-level will be provided. Moreover, additional customization can be done based on the requirements. |
| Purchase Options | We have three licenses to opt for: Single User License, Multi-User License (Up to 5 Users), Corporate Use License (Unlimited Users and Printable PDF) |





































