
Quick Navigation
Market Overview
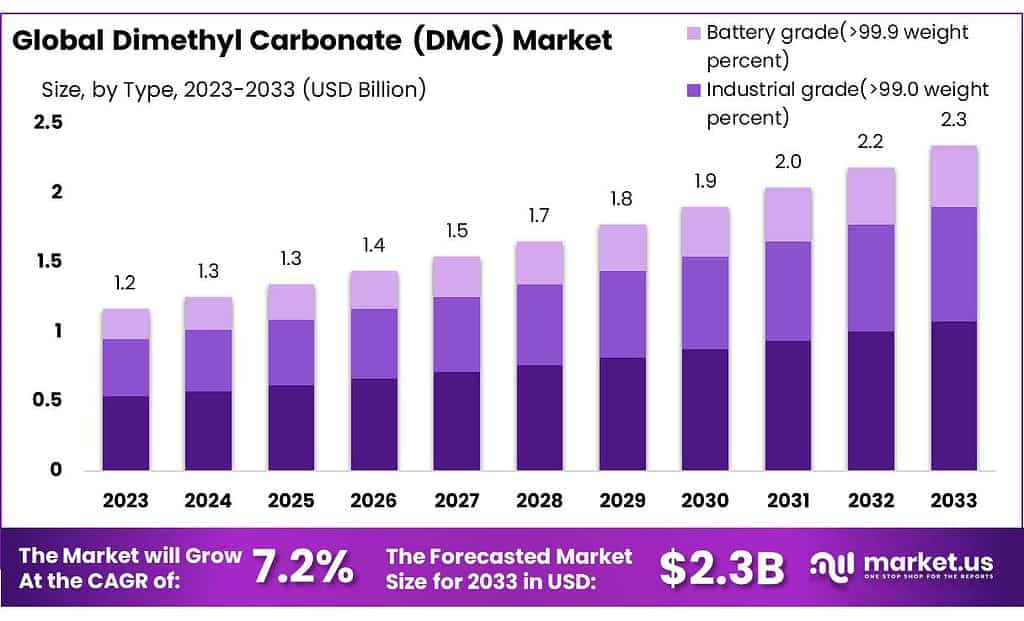
The Dimethyl Carbonate (DMC) Market size is expected to be worth around USD 2.3 billion by 2033, from USD 1.2 Bn in 2023, growing at a CAGR of 7.2% during the forecast period from 2023 to 2033.
The Dimethyl Carbonate (DMC) Market encompasses the global industry involved in the production, distribution, and utilization of dimethyl carbonate, a versatile chemical compound. Dimethyl carbonate is commonly used as a solvent, fuel additive, and intermediate in the synthesis of various chemicals.
The market involves the cultivation and processing of raw materials, as well as the manufacturing and trade of dimethyl carbonate, serving industries such as pharmaceuticals, paints and coatings, plastics, and alternative fuels. The market dynamics include factors influencing production, demand, and regulatory considerations related to the use of dimethyl carbonate across diverse applications.
Key Takeaways
- Market Growth Projection: DMC market aims to reach USD 2.3 billion by 2033, growing at a CAGR of 7.2% from 2023’s USD 1.2 billion.
- Carbomer Types’ Dominance: In 2023, Carbomer types, including 940, 980, and 934, secured over 45% market share, notably in cosmetics and medicines.
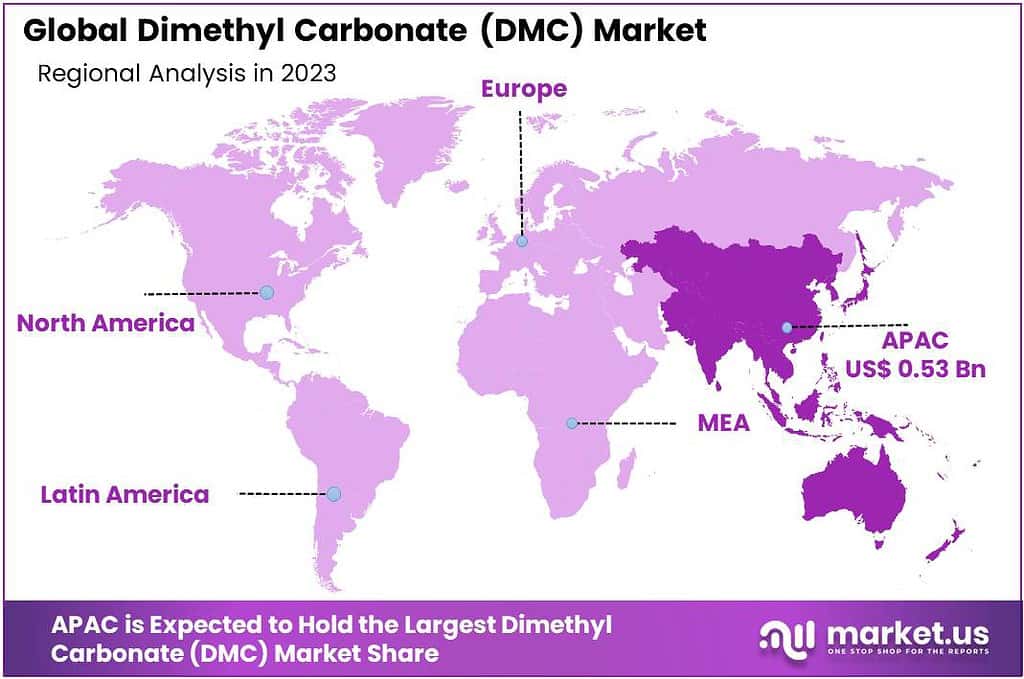
- Regional Analysis Highlights: Asia Pacific dominates with over 42% market revenue, driven by India, while the Middle East & Africa secures the second-largest revenue share.
By Source
Dimethyl Carbonate (DMC) can be obtained through two primary sources, synthetic production and natural processes. Synthetic DMC is manufactured in controlled environments such as laboratories or industrial facilities using chemical reactions involving various compounds. This manufacturing method does not rely on naturally occurring materials and involves specific procedures designed for mass production. Synthetic DMC is often preferred for its consistent quality and reliable supply, which meets the demands across various industries.
On the other hand, natural DMC is derived from natural sources or renewable materials using processes that occur in nature. This form of DMC might be obtained through bio-based or eco-friendly methods that rely on organic or sustainable resources. Natural DMC production methods tend to align with environmentally conscious practices and may appeal to industries seeking more sustainable alternatives. Both synthetic and natural DMC have their distinct production processes and qualities.
Synthetic DMC is manufactured with precision and consistency, while natural DMC may align better with eco-friendly practices and appeal to consumers or industries focused on sustainability. The choice between these sources often depends on the specific needs and priorities of industries and consumers within various applications.
By Type
In 2023, within the Dimethyl Carbonate (DMC) market, there was a notable dominance of Carbomer, encompassing variants like Carbomer 940, 980, and 934. Among these variations, one specific Carbomer type seized a substantial market share of over 45%.
This particular type seemed to resonate strongly with consumers and industries, establishing itself as a preferred choice across various applications. Carbomer 940 is really good at thickening stuff, and it’s used a lot in making things like gels and creams in cosmetics, medicines, and personal care stuff. It’s especially useful because it makes clear gels and helps keep these products stable.
Carbomer 980 is quite similar to Carbomer 940 but might work a bit differently. It also thickens things and keeps them stable, and it’s used in medicines and personal care items like gels and creams. Carbomer 934 is another kind, and it’s mainly used in medicines and personal care stuff too. It helps in making pills or capsules that release medicine slowly in the body, making sure the medicine works well.
Each Carbomer type possesses distinct properties, such as viscosity, compatibility, and application suitability. While they share similarities in being used as thickening agents or stabilizers, their specific characteristics make them suitable for various products across pharmaceutical, cosmetic, and personal care industries. The choice of Carbomer type often depends on the desired properties required for specific formulations or applications within these sectors.
By Appearance
Dimethyl Carbonate (DMC) can range in form from liquid to white powder. Liquid DMC appears much like any other liquid substance, like water or oils, making it suitable for various industries for various uses. Liquid DMC is often utilized in chemical processes, solvent applications or manufacturing procedures where liquid form is essential or advantageous.
DMC can also come in the form of white powder that resembles fine flour or powdered sugar in appearance. This powdered variation serves its own unique set of purposes across industries; such as applications where using powdered ingredients would be more advantageous or necessary, such as for manufacturing products containing specific powdered ingredients.
Liquid and powder forms of DMC are widely utilized across industries due to their individual properties and applications. Selecting between them depends largely upon individual production processes’ individual requirements or functions.
By Function
Dimethyl Carbonate (DMC) serves numerous important roles across industries due to its flexible nature. DMC acts as a thickening agent, altering the consistency of liquids to turn them into thicker forms like gels. This feature makes DMC particularly valuable in industries like cosmetics where attaining specific textures is of utmost importance.
As an emulsifier, DMC facilitates the blending of substances that don’t typically combine well, such as oil and water. This capability makes DMC ideal for producing stable emulsions for various applications requiring oil/water blends such as cosmetics.
DMC plays an essential role as a suspension agent in keeping particles or ingredients evenly dispersed within liquid without sinking or settling, making it invaluable in industries like pharmaceuticals or paints for formulating uniform distribution of components within their formulations. This capability has proven useful across many applications such as paints and pharmaceuticals formulations.
DMC acts as a binding agent, helping hold together components in pharmaceutical tablet formulations by keeping various elements together and thus maintaining structural integrity of pills or tablets by binding their constituent ingredients together. DMC acts as an excellent dispersion agent, dispersing one substance evenly throughout another mixture and creating uniformity of mixtures.
This property finds wide application in industries such as coatings, inks and adhesives where consistent dispersion is key for quality and performance. DMC’s unique combination of thickening, emulsifying, suspending, binding and dispersing properties make it a highly valued component across multiple industries, contributing to processes and product formulations in different ways.
By Application
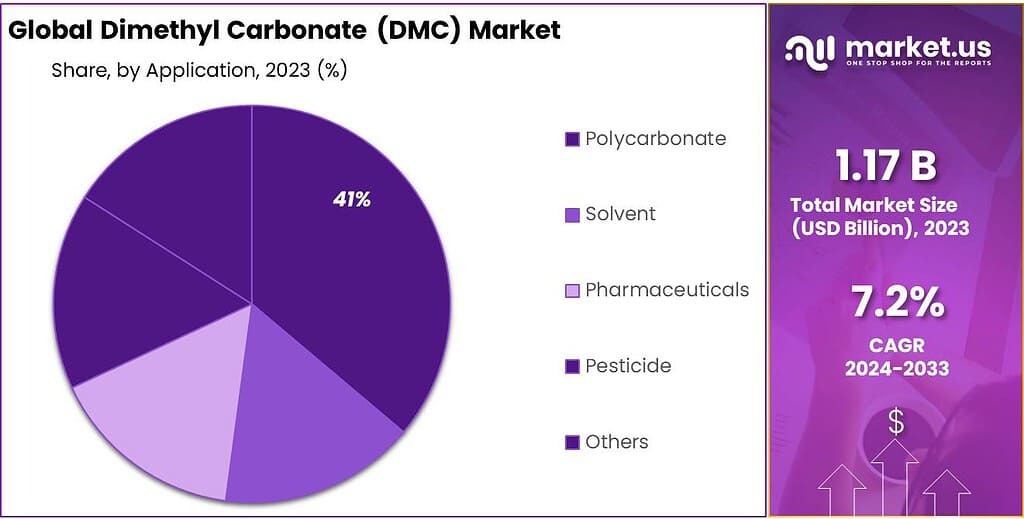
Dimethyl Carbonate (DMC) market dominance among Personal Care Products reached 45% by 2023, meaning DMC was predominantly utilized in various personal care items like skincare products, shampoos and similar consumer goods as opposed to its usage across industries.
DMC was widely utilized across a range of Personal Care Products as well as Pharmaceuticals and Homecare items; however, its prominence as a critical ingredient was most evident within Personal Care Items alone, suggesting its prominence within everyday personal care items.
Pharmaceutical industries utilized DMC in medicine and homecare products with DMC inclusion; homecare industries likely used it in cleaning agents or detergents as well. These sectors did not represent as much of DMC market as did personal care products which made significant use of this ingredient.
DMC was particularly prominent within personal care products in 2023, taking up an overwhelming portion of their applications across pharmaceuticals, homecare products and other applications.
Key Market Segments
By Source
- Synthetic
- Natural
By Type
- Carbomer 940
- Carbomer 980
- Carbomer 934
By Appearance
- Liquid
- White Powder
By Function
- Thickening Agent
- Emulsifier
- Suspending Agent
- Binding Agent
- Dispersion Agent
By Application
- Personal Care Products
- Pharmaceuticals
- Homecare Products
- Others
Drivers
Dimethyl Carbonate (DMC) market growth can be attributed to several key driving forces. One such force is rising demand for eco-friendly and sustainable products – as environmental awareness grows worldwide, industries seek safer solutions like DMC as an environmentally friendly chemical compared to others on the market. DMC’s reputation has propelled its rise across various sectors.
DMC stands out among its competition due to its remarkable versatility. As it serves multiple functions – solvent, cleaner and contributing to pharmaceutical and personal care items production – its adaptability has made it attractive across various industries, which in turn contributes to its market expansion.
DMC market growth has also been spurred on by regulations and environmental policies supporting safer chemicals, with stricter restrictions limiting harmful ones driving demand for alternatives like DMC to skyrocket across various industrial applications. DMC stands as an emerging solution that meets rising consumer demands for sustainable solutions while meeting regulatory pushes for safer chemical usage, both of which serve to propel its market expansion.
Restraints
Dimethyl Carbonate (DMC) market faces some obstacles which impede its progress despite its steady expansion. One major challenge facing DMC among consumers and industries alike is limited awareness. Despite its eco-friendly attributes and numerous applications, there remains limited understanding regarding its benefits or applications – impeding its widespread adoption into various sectors, slowing market expansion.
Moreover, the comparatively higher production costs associated with DMC present a hurdle. The specific manufacturing processes involved in producing DMC can contribute to elevated production expenses. This higher cost makes it less competitive, particularly in markets where price competitiveness plays a crucial role in decision-making.
Furthermore, navigating the regulatory landscape poses challenges for DMC. While supportive regulations can drive market growth, stringent compliance requirements or approval processes can be intricate and time-consuming for manufacturers.
Meeting these regulatory standards or obtaining necessary certifications might pose financial and operational difficulties, impacting the market expansion of DMC. In essence, the limitations in awareness and understanding, higher production costs, and regulatory complexities are notable hurdles that slow down the broader acceptance and market growth of Dimethyl Carbonate across diverse industries.
Opportunities
The Dimethyl Carbonate (DMC) market presents several opportunities for growth and advancement. One significant opportunity lies in the rising global demand for environmentally friendly alternatives. As sustainability continues to dominate industries, DMC’s eco-friendly properties make it an attractive solution. Consumers increasingly prefer chemicals with minimal environmental impacts; creating an ideal opportunity for DMC expansion across various sectors.
Technological developments provide avenues for improving DMC applications and production processes. Research and development efforts may lead to improvements in efficiency, effectiveness and cost-effectiveness – opening doors to new uses and markets for this revolutionary material.
Moreover, the expanding scope of applications for DMC presents promising prospects. Its versatility allows for usage in multiple industries beyond its current applications. Exploring new sectors or enhancing its applications in existing industries, such as energy storage, electronics, or agriculture, could unlock substantial opportunities for market growth.
The increasing focus on regulations and policies favoring safer chemicals and sustainability acts as a driving force. Adherence to stringent regulatory standards and aligning with sustainability goals could position DMC as a preferred choice in various sectors. In summary, the growing demand for environmentally friendly solutions, technological advancements, diversification of applications, and regulatory trends offer significant opportunities for the expansion and advancement of the Dimethyl Carbonate market.
Challenges
One big problem for the Dimethyl Carbonate (DMC) market is that not enough people know about how good it is and what it can do. Even though it’s good for the environment and can do lots of different things, not many folks and businesses really get how useful it can be. Because of this, it’s not being used as much as it could in different areas.
The higher production costs associated with DMC present a hurdle to its competitiveness. The manufacturing processes involved in producing DMC can contribute to elevated production expenses compared to conventional alternatives. This cost factor might hinder its adoption, particularly in price-sensitive markets.
Navigating regulatory frameworks and compliance standards poses challenges. While supportive regulations can drive market growth, stringent compliance requirements or approval processes can be complex and time-consuming for manufacturers. Meeting these regulatory standards or obtaining necessary certifications might pose financial and operational difficulties, impacting the market expansion of DMC.
Additionally, competition from existing chemicals and alternatives is a notable challenge. DMC competes with well-established chemicals in various sectors. Getting companies to choose DMC over other stuff means showing it’s better in how well it works, how much it costs, and how good it is for the environment.
The tough parts for DMC are that not enough people know about it, it costs more to make than some other things, rules about using it can be tricky, and it’s competing against already well-known options. These things make it harder for DMC to become more popular in different industries.
Regional Analysis
Key Regions and Countries
-
North America
- US
- Canada
- Mexico
-
Europe
- Germany
- UK
- France
- Italy
- Russia
- Spain
- Rest of Europe
-
APAC
- China
- Japan
- South Korea
- India
- Rest of Asia-Pacific
-
South America
- Brazil
- Argentina
- Rest of South America
-
MEA
- GCC
- South Africa
- Israel
- Rest of MEA
The Dimethyl Carbonate (DMC) market is characterized by a fragmented landscape, challenging players to navigate and compete effectively. To address this, players are adopting strategic measures, including expansion and collaboration, to cater to the rising demand for moringa components. Noteworthy players in the market are making efforts to broaden their reach and enhance competitiveness.
One such player contributing to the market dynamics is Moringaconnect, which stands out for its approach. Moringaconnect strategically sources moringa products from regions like Ghana. This not only aids in meeting the increasing demand for moringa components but also plays a crucial role in supporting remote populations by providing them with a source of income. The focus on enhancing farmers’ productivity is a key aspect of this strategy, aimed at strengthening market competitiveness.
Key Market Players
- Anhui Newman Fine Chemicals Co. Ltd.
- Evonik Industries AG
- The Lubrizol Corporation
- Maruti Chemicals
- Ashland
- Sumitomo seika chemicals co. Ltd.
- Amnem
- SINOWAY INDUSTRIAL CO. LTD
- Yucheng Jinhe Industrial Co. Ltd
- QINGDAO YINUOXIN NEW MATERIAL CO. LTD
- Other Key Players
Recent Developments
In February 2022, Lotte chemical has announced its expansion plan. The company is planning to build new plant which will produce high quality organic solvents such as dimethyl carbonate for lithium-ion battery electrolyte.
Report Scope
| Report Features | Description |
|---|---|
| Market Value (2022) | US$ 1.2 Bn |
| Forecast Revenue (2032) | US$ 2.3 Bn |
| CAGR (2023-2032) | 7.2% |
| Base Year for Estimation | 2022 |
| Historic Period | 2018-2022 |
| Forecast Period | 2023-2032 |
| Report Coverage | Revenue Forecast, Market Dynamics, COVID-19 Impact, Competitive Landscape, Recent Developments |
| Segments Covered | By Source(Synthetic, Natural, By Type, Carbomer 940, Carbomer 980, Carbomer 934), By Appearance(Liquid, White Powder), By Function(Thickening Agent, Emulsifier, Suspending Agent, Binding Agent, Dispersion Agent), By Application(Personal Care Products, Pharmaceuticals, Homecare Products, Others) |
| Regional Analysis | North America – The US, Canada, & Mexico; Western Europe – Germany, France, The UK, Spain, Italy, Portugal, Ireland, Austria, Switzerland, Benelux, Nordic, & Rest of Western Europe; Eastern Europe – Russia, Poland, The Czech Republic, Greece, & Rest of Eastern Europe; APAC – China, Japan, South Korea, India, Australia & New Zealand, Indonesia, Malaysia, Philippines, Singapore, Thailand, Vietnam, & Rest of APAC; Latin America – Brazil, Colombia, Chile, Argentina, Costa Rica, & Rest of Latin America; Middle East & Africa – Algeria, Egypt, Israel, Kuwait, Nigeria, Saudi Arabia, South Africa, Turkey, United Arab Emirates, & Rest of MEA |
| Competitive Landscape | Anhui Newman Fine Chemicals Co. Ltd., Evonik Industries AG, The Lubrizol Corporation, Maruti Chemicals, Ashland, Sumitomo seika chemicals co. Ltd., Amnem, SINOWAY INDUSTRIAL CO. LTD, Yucheng Jinhe Industrial Co. Ltd, QINGDAO YINUOXIN NEW MATERIAL CO. LTD, Other Key Players |
| Customization Scope | Customization for segments, region/country-level will be provided. Moreover, additional customization can be done based on the requirements. |
| Purchase Options | We have three license to opt for: Single User License, Multi-User License (Up to 5 Users), Corporate Use License (Unlimited User and Printable PDF) |
Frequently Asked Questions (FAQ)
Dimethyl Carbonate (DMC) Market size is expected to be worth around USD 2.3 billion by 2033, from USD 1.2 Bn in 2023
Anhui Newman Fine Chemicals Co. Ltd., Evonik Industries AG, The Lubrizol Corporation, Maruti Chemicals, Ashland, Sumitomo seika chemicals co. Ltd., Amnem, SINOWAY INDUSTRIAL CO. LTD, Yucheng Jinhe Industrial Co. Ltd, QINGDAO YINUOXIN NEW MATERIAL CO. LTD, Other Key Players
 Market")


