


Report Overview
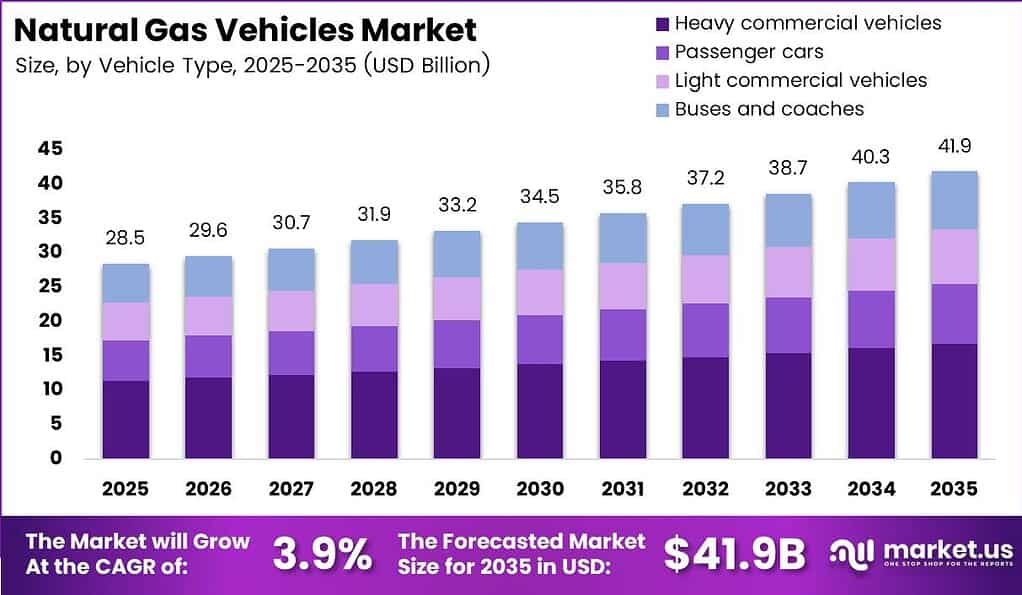
Global Natural Gas Vehicles Market size is expected to be worth around USD 41.9 Billion by 2035 from USD 29.6 Billion in 2026, growing at a CAGR of 3.9% during the forecast period 2026 to 2035. According to the U.S. Alternative Fuels Data Center, natural gas powers more than 175,000 vehicles in the United States and roughly 23 million vehicles worldwide, confirming an established global fleet base that creates ongoing demand for fuel infrastructure and vehicle supply chains.
The Natural Gas Vehicles Market covers road vehicles powered by compressed natural gas, liquefied natural gas, or bi-fuel systems combining natural gas with petrol or diesel. This market spans passenger cars, light commercial vehicles, heavy commercial vehicles, and buses across OEM and aftermarket conversion channels. By contrast, fully electric and hydrogen fuel-cell vehicles are excluded from this scope.
Key Takeaways
- The global Natural Gas Vehicles Market was valued at USD 29.6 Billion in 2026 and is forecast to reach USD 41.9 Billion by 2035.
- The market is growing at a CAGR of 3.9% during the forecast period 2026 to 2035.
- By Fuel Type, Compressed Natural Gas (CNG) dominates with a 71.00% share.
- By Vehicle Type, Heavy commercial vehicles holds the leading position with a 38.00% share.
- By Engine Type, Dedicated natural gas engines account for 51.00% of the market.
- By Propulsion Technology, Internal combustion engine holds a dominant 98.50% share.
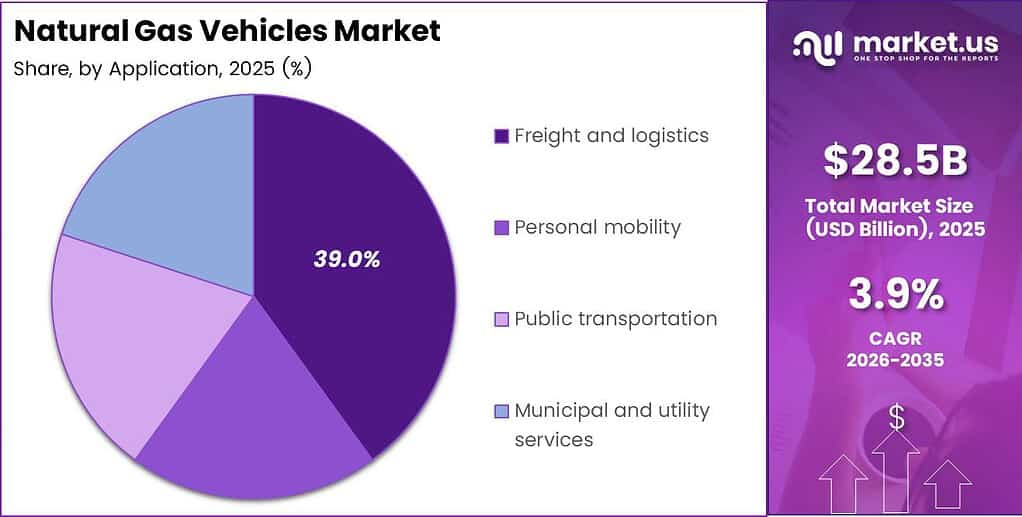
- By Application, Freight and logistics leads with a 39.00% share.
- By Sales Channel, OEM accounts for 65.00% of the market.
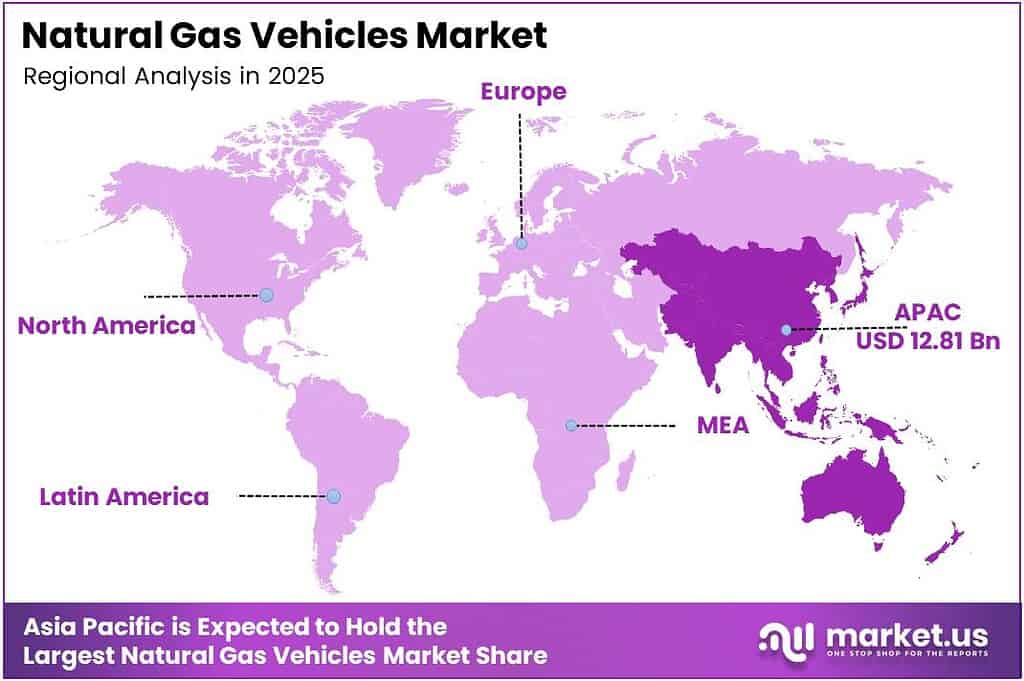
- Asia Pacific is the dominant region with a 45.00% market share, valued at USD 12.81 Billion.
- Europe is the fastest-growing region in the Natural Gas Vehicles Market.
The International Energy Agency forecast natural-gas use as a transport fuel to grow at an average of 2.6% annually during 2021 to 2025, driven primarily by LNG trucks and river transport in Asia. This trajectory establishes Asia as the structural engine of NGV demand, directing capital toward LNG refueling corridors and heavy-truck manufacturing in that region. As a result, vendors with established Asian distribution networks hold a measurable first-mover advantage over new entrants.
India’s refueling network reached 9,096 CNG stations as of July 31, 2026, according to the Petroleum Planning and Analysis Cell. This density converts India from a cluster-based NGV market into a platform for national fleet contracts. Suppliers capable of pairing vehicle sales with bundled fuel and maintenance agreements are best positioned to capture this structural shift.
Global natural-gas demand was forecast to decline by approximately 0.5%, or 20 bcm, in 2026, based on International Energy Agency data. This contraction in overall gas consumption does not uniformly suppress NGV growth, since transport fuel represents a distinct demand segment with its own cost and policy dynamics. In March 2024, Volvo Group agreed to acquire 45% of its HPDI joint venture with Westport for approximately SEK 290 million, plus up to SEK 460 million in performance-based consideration, signaling continued OEM conviction in gas-engine investment.
Type Analysis
Compressed Natural Gas (CNG) dominates with 71.00% due to lower infrastructure cost and broader urban availability.
In 2025, Compressed Natural Gas (CNG) held a dominant market position in the By Fuel Type segment of the Natural Gas Vehicles Market, with a 71.00% share. CNG infrastructure carries lower capital requirements than LNG, making it the preferred choice for urban fleet operators, taxi networks, and public bus systems. This cost advantage locks in recurring fuel revenue for station operators and creates high switching barriers for fleet buyers already integrated into CNG supply chains.
Liquefied Natural Gas (LNG) serves long-haul heavy freight routes where energy density and extended range outweigh the higher infrastructure cost. Global LNG production increased by almost 7%, or 38 bcm, in 2025, with approximately three-quarters of that growth occurring in the second half of the year, according to International Energy Agency data. This expanding supply base reduces LNG price volatility risk for long-haul fleet operators and supports broader adoption of LNG trucks on inter-city freight corridors.
Vehicle Type Analysis
Heavy commercial vehicles dominate with 38.00% due to high mileage economics and fuel-cost sensitivity.
In 2025, Heavy commercial vehicles held a dominant market position in the By Vehicle Type segment of the Natural Gas Vehicles Market, with a 38.00% share. High annual mileage amplifies the per-kilometer fuel-cost advantage of natural gas over diesel, making the total cost of ownership case compelling for freight operators. As per our research, the European Union operated 6.2 million trucks with only 0.3% being electrically chargeable, confirming that gas-powered alternatives face minimal electrification competition in this segment near term.
Passenger cars represent a structurally important sub-segment, particularly in markets where factory-fitted CNG options are widely available and fuel price differentials are large. Indian passenger-vehicle sales reached a record 4.3 million units in FY2024 to 25, rising by 2%, according to the Society of Indian Automobile Manufacturers. In June 2025, Maruti Suzuki launched the Grand Vitara S-CNG with fuel efficiency of 26.6 km/kg and a starting price of ₹13.48 lakh, expanding factory-fitted CNG coverage in India’s largest passenger-car market. In November 2024, Maruti Suzuki also launched the Dzire S-CNG with fuel efficiency of 33.73 km/kg, an 8% improvement over the preceding model, reinforcing consumer confidence in CNG passenger cars.
Light commercial vehicles operate across urban delivery, last-mile logistics, and small-business transport segments where CNG’s lower running cost provides a direct margin advantage. As reported by ACEA, alternative fuels including natural gas, LPG, and ethanol represented 2.6% of new EU truck registrations across the 2020 to 2023 dataset. This share signals early-stage penetration with significant headroom for growth as refueling coverage expands and fuel-price differentials persist. Buses and coaches, along with other vehicle sub-segments, hold the remaining collective share.
Engine Type Analysis
Dedicated natural gas engines dominate with 51.00% due to optimized combustion efficiency and lower per-unit fuel cost.
In 2025, Dedicated natural gas engines held a dominant market position in the By Engine Type segment of the Natural Gas Vehicles Market, with a 51.00% share. These engines are factory-calibrated for natural gas combustion, delivering higher thermal efficiency and lower maintenance costs compared to converted units. Fleet operators running high-annual-mileage routes extract the maximum cost-per-kilometer advantage from dedicated engines, reinforcing purchasing preference in commercial transport segments.
Bi-fuel engines retain a petrol or diesel capability alongside natural gas, allowing vehicles to operate where CNG or LNG refueling infrastructure remains sparse. This flexibility commands a price premium but reduces range-anxiety risk for mixed-route operators. Dual-fuel engines, which supplement diesel combustion with a natural gas injection, serve heavy-duty applications where full substitution of diesel is not yet technically or commercially feasible, and these sub-segments collectively hold the remaining engine-type share.
Propulsion Technology Analysis
Internal combustion engine dominates with 98.50% due to mature technology and lower upfront cost versus hybrid systems.
In 2025, Internal combustion engines held a dominant market position in the By Propulsion Technology segment of the Natural Gas Vehicles Market, with a 98.50% share. Established manufacturing tooling, widespread service capability, and a deep pool of trained technicians reinforce the ICE’s dominance across all vehicle classes. This concentration signals that manufacturers who invest in next-generation gas ICE platforms face low near-term displacement risk from hybrid natural gas configurations.
Hybrid natural gas vehicles combine a gas-powered combustion engine with an electric drivetrain to improve fuel economy and reduce emissions in stop-and-go urban duty cycles. This sub-segment holds the remaining 1.50% share and is positioned at the intersection of NGV and electrification technology. As urban emission regulations tighten, hybrid configurations may attract fleet operators seeking compliance flexibility without full commitment to battery-electric powertrains.
Application Analysis
Freight and logistics dominates with 39.00% due to high fuel consumption and direct cost-reduction incentives.
In 2025, Freight and logistics held a dominant market position in the By Application segment of the Natural Gas Vehicles Market, with a 39.00% share. The European Road Freight Spot Rate Benchmark Index reached 127.7 points in Q2 2024, rising by 3.5 points quarter over quarter, according to International Road Union data. This rate pressure tightens fleet operating margins, making the fuel-cost savings of natural gas a direct procurement lever for logistics operators facing tightening margins.
World merchandise-trade volume growth was forecast to decelerate from 4.6% in 2025 to 1.9% in 2026 before recovering to 2.6% in 2027, based on World Trade Organization data. This slowdown compresses freight volumes in the near term but does not remove cost-reduction pressure from fleet operators, sustaining demand for lower-fuel-cost alternatives like natural gas trucks. Personal mobility remains a significant application driven by bi-fuel and factory-fitted CNG passenger cars in price-sensitive markets.
Public transportation represents a high-visibility application where CNG buses deliver measurable emissions reductions in urban corridors. Houston METRO’s 50 CNG transit buses traveled more than 8.5 million miles and displaced 2.5 million gallons of diesel across the case-study period, according to U.S. Alternative Fuels Data Center data. Municipal and utility services, including waste collection and utility fleets, hold the remaining application share collectively.
Sales Channel Analysis
Original Equipment Manufacturer (OEM) dominates with 65.00% due to factory certification, warranty integration, and buyer financing access.
In 2025, OEM channels held a dominant market position in the By Sales Channel segment of the Natural Gas Vehicles Market, with a 65.00% share. Factory-fitted CNG and LNG vehicles carry full manufacturer warranties and integrate seamlessly with fleet management systems, reducing total ownership risk for buyers. OEM dominance also reflects growing model availability, particularly in Asia, where manufacturers have expanded factory-fitted CNG lineups to capture price-sensitive commercial and passenger-car buyers.
Aftermarket conversion holds the remaining 35.00% share and serves fleet operators seeking to transition existing diesel inventory without capital replacement. The U.S. Alternative Fuels Data Center mandates that covered CNG, LNG, and bi-fuel conversions be inspected at installation and every three years or 36,000 miles thereafter, whichever occurs first. This regulatory inspection cycle creates a recurring revenue stream for certified conversion and service providers. The District of Columbia provided a conversion incentive covering 50% of qualified equipment and labor costs, capped at USD 19,000 per vehicle, illustrating how targeted fiscal policy can accelerate aftermarket conversion adoption.
Key Market Segments
By Fuel Type
- Compressed Natural Gas (CNG)
- Liquefied Natural Gas (LNG)
By Vehicle Type
- Heavy commercial vehicles
- Passenger cars
- Light commercial vehicles
- Buses and coaches
By Engine Type
- Dedicated natural gas
- Bi-fuel
- Dual-fuel
By Propulsion Technology
- Internal combustion engine
- Hybrid natural gas vehicle
By Application
- Freight and logistics
- Personal mobility
- Public transportation
- Municipal and utility services
By Sales Channel
- Original Equipment Manufacturer (OEM)
- Aftermarket/conversion
Regional Analysis
Asia Pacific Dominates the Natural Gas Vehicles Market with a Market Share of 45.00%, Valued at USD 12.81 Billion
Asia Pacific holds a 45.00% share of the global Natural Gas Vehicles Market, valued at USD 12.81 Billion in 2025. Asia-Pacific vehicle production rose by 7.6% to approximately 59.2 million units in 2025, representing more than 61% of global output, according to the International Organization of Motor Vehicle Manufacturers. This production concentration positions the region as the primary supplier of NGVs globally, giving Asian manufacturers a scale and cost advantage over rivals in other regions. In January 2024, Maruti Suzuki announced a ₹350 billion Gujarat greenfield plant targeting annual production capacity of 1 million vehicles, expected to begin operations in FY2028 to 29.
Europe is the fastest-growing region in the Natural Gas Vehicles Market. Data from ACEA shows the EU operating 31.1 million vans, including 6.5 million in France, 4.6 million in Italy, and 4.2 million in Spain. France recorded 120,769 new passenger-car registrations in February 2026, a decline of 15% from February 2025, according to the International Organization of Motor Vehicle Manufacturers. This near-term softness in new registrations does not remove the structural case for CNG and LNG fleet adoption, as tightening EU heavy-duty emission standards continue to push operators toward lower-emission alternatives.
North America maintains a significant established NGV base supported by public CNG infrastructure. As per our research, the United States operated more than 700 public CNG stations and approximately 50 public LNG stations as of 2023. This network supports ongoing fleet adoption in regional logistics, transit, and municipal services, though station density remains lower than in Asia and limits broader commercial expansion without targeted infrastructure investment.
Key Regions and Countries
North America
- US
- Canada
Europe
- Germany
- France
- The UK
- Spain
- Italy
- Rest of Europe
Asia Pacific
- China
- Japan
- South Korea
- India
- Australia
- Rest of APAC
Latin America
- Brazil
- Mexico
- Rest of Latin America
Middle East and Africa
- GCC
- South Africa
- Rest of MEA
Market Dynamics
Market Opportunity Analysis - Underserved regions and low-penetration segments offer entry points for investors and new fleet suppliers
Europe’s fastest-growing status in the Natural Gas Vehicles Market reflects early-stage penetration rather than saturation. The EU operated 31.1 million vans across France, Italy, Spain, and the broader fleet base, yet alternative fuels represented only 2.6% of new EU truck registrations across the 2020 to 2023 period. This gap between fleet size and NGV adoption rates signals significant displacement potential for suppliers able to pair competitive vehicle pricing with expanded refueling coverage.
Maritime-trade growth was forecast to slow from 2.2% in 2024 to 0.5% in 2025 before averaging 2% annually during 2026 to 2030, according to UNCTAD data. This deceleration compresses port throughput volumes and tightens logistics margins, creating cost-reduction pressure that makes LNG-powered port and mine captive fleets more economically attractive. Investors focused on port logistics infrastructure should evaluate LNG fleet conversion as a near-term margin improvement lever.
Average energy prices were forecast to rise by 24% in 2026, with Brent crude oil averaging USD 86 per barrel, based on World Bank data. This energy price environment widens the fuel-cost differential between natural gas and diesel, strengthening the total cost of ownership case for NGV fleet adoption across freight, municipal, and public transit applications. This creates a time-sensitive entry window for NGV suppliers targeting price-sensitive fleet operators in Asia, Latin America, and the Middle East before energy price dynamics shift.
Technology and Innovation Landscape - Engine performance breakthroughs and bio-fuel infrastructure expand the competitive boundaries of natural gas vehicles
Volvo gas-powered trucks offer up to 500 hp, combination loads of up to 60 tonnes, and ranges of up to 1,000 km, according to Volvo Trucks data. These performance specifications place gas-powered heavy trucks on direct operational parity with diesel alternatives in long-haul freight applications. Fleet operators who previously excluded gas trucks on range or payload grounds now face a credible substitution option backed by proven engineering performance.
In September 2024, Cummins began full production of its 15-litre X15N natural-gas engine, offering ratings of up to 500 hp and 1,850 lb-ft of torque. This high-output engine directly targets the North American Class 8 truck segment, where diesel has historically faced no comparable gas-engine alternative. The X15N’s production launch shifts the competitive calculation for fleet procurement managers who have been waiting for a gas engine that matches diesel on power and torque without compromising payload.
Approximately 4,300 bio-LNG stations and 800 bio-CNG stations were operating globally in 2025, with 50 additional stations scheduled to open in 2026, according to IVECO data. This expanding renewable-fuel station network allows fleet operators to access certified low-carbon fuel without modifying existing NGV assets. Suppliers with refueling station partnerships and certified biomethane supply chains hold a structural advantage in markets where carbon-intensity reporting obligations are tightening.
Global LNG production increased by almost 7%, or 38 bcm, in 2025, with approximately three-quarters of this growth occurring in the second half of the year, based on International Energy Agency data. This supply expansion reduces LNG price volatility risk and lowers the sourcing cost for vehicle operators dependent on LNG for long-haul and heavy-duty applications. As a result, LNG corridor development in India, Southeast Asia, and Latin America becomes commercially viable at lower fleet commitment thresholds than previously required.
Drivers
India’s city-gas network expansion is converting the country’s NGV market from isolated metropolitan clusters into a national fleet-sales platform. By 2024, regulators had authorized 307 city-gas geographical areas, while the CNG station network exceeded 8,400 by September 2025. One major regional network alone operated 956 stations and refueled approximately 2.2 million vehicles daily, reducing route-planning risk and enabling national fleet contracts with bundled maintenance and fuel agreements.
Fleet operators across North America and Asia Pacific are capturing a direct fuel-cost advantage by switching to natural gas. This economic case reduces fleet operating costs without requiring new technology commitments, making NGVs a commercially viable near-term procurement decision. Urban air-quality procurement mandates in South Asia and Latin America add a regulatory layer that accelerates public-sector bus and utility fleet conversions, expanding the addressable market for both OEM suppliers and aftermarket conversion providers.
| Driver | (~) % Impact on CAGR Forecast | Geographic Relevance | Impact Timeline |
|---|---|---|---|
| India City-Gas Network Expansion | +0.7% | India | Short term (≤ 2 years) |
| Fleet Fuel-Cost Advantage | +0.5% | North America, Asia-Pacific | Short term (≤ 2 years) |
| Urban Air-Quality Procurement | +0.4% | South Asia, Latin America | Medium term (2–4 years) |
| Heavy-Duty Performance Parity | +0.3% | Global fleet markets | Medium term (2–4 years) |
| Road-Freight Demand Growth | +0.2% | Asia-Pacific, Middle East | Medium term (2–4 years) |
Restraints
Zero-emission policy frameworks in Europe, North America, and China are structurally crowding out natural gas from fleet procurement shortlists. Europe’s amended heavy-duty standards require fleet-average carbon-dioxide reductions of 15% during 2025 to 2029, rising to 45% during 2030 to 2034, 65% during 2035 to 2039, and 90% from 2040. The United States finalized tighter heavy-duty standards in March 2024 for model years beginning in 2027, reinforcing a regulatory shift toward tailpipe-zero technologies rather than lower-emission combustion alternatives.
Electric trucks reached 9% of global truck sales in 2025, intensifying competition for fleet capital, production slots, and public incentives. This policy asymmetry can eliminate NGVs from procurement evaluation before fuel economics are even compared. High incremental vehicle capital costs further restrict adoption among price-sensitive fleets, particularly in emerging markets where financing access is limited and residual-value uncertainty adds long-term risk to fleet investment decisions.
| Restraint | (~) % Impact on CAGR Forecast | Geographic Relevance | Impact Timeline |
|---|---|---|---|
| Zero-Emission Policy Crowding-Out | -0.7% | Europe, North America, China | Short term (≤ 2 years) |
| High Incremental Vehicle CapEx | -0.4% | Global price-sensitive fleets | Short term (≤ 2 years) |
| Limited Public Model Availability | -0.3% | Europe, North America | Medium term (2–4 years) |
| Fleet Financing Hurdles | -0.2% | Emerging markets | Short term (≤ 2 years) |
| Residual-Value Uncertainty | -0.1% | Developed markets | Long term (≥ 4 years) |
Challenges
Methane leakage across production, transmission, refueling, and combustion stages creates a verification burden that weakens the NGV environmental case for fleets subject to carbon accounting. Fossil-fuel production and use generated nearly 120 million metric tonnes of methane in 2023, while approximately 30% of fossil-fuel methane emissions in 2024 were considered preventable at no net cost. This gap between actual and optimal performance signals that the technology and measurement infrastructure to close it already exists, but deployment remains incomplete across most markets.
An analyst operating case places measurement, certified sourcing, engine calibration, and leakage-control costs at roughly 1 to 3% of annual fuel-and-compliance expenditure for carbon-accountable fleets. These costs lengthen sales cycles and add procurement complexity without halting current vehicle purchases. Manufacturers and fuel suppliers that invest in low-slip engines, auditable gas-origin data, and performance warranties can convert this compliance burden into a differentiation advantage over competitors relying on unverified emissions claims.
| Challenge | (~) % CAGR Friction Drag | Geographic Relevance | Mitigation Horizon |
|---|---|---|---|
| Methane Leakage Verification Burden | -0.4% | Global supply chains | Long term (≥ 4 years) |
| Gas Price Volatility Exposure | -0.3% | Europe, LNG-importing Asia | Medium term (2–4 years) |
| Onboard Storage Weight Penalty | -0.2% | Long-haul fleet markets | Medium term (2–4 years) |
| Cylinder Lifecycle Compliance | -0.15% | Global aftermarket | Long term (≥ 4 years) |
| Specialist Service Capability Gaps | -0.1% | Emerging markets | Medium term (2–4 years) |
Opportunities
Renewable natural gas credit stacking offers high-utilization fleet operators a compound economic advantage beyond conventional CNG fuel savings. California’s revised low-carbon-fuel rules, effective July 1, 2025, added a 9% increase in benchmark stringency and set a 22.75% carbon-intensity reduction benchmark. Average transferred credits reached approximately USD 58 per metric tonne in both May and October 2025, providing a monetizable revenue layer on top of existing fuel-cost savings.
Conventional CNG already demonstrated an average fuel-cost advantage of approximately USD 0.35 per diesel-gallon equivalent in October 2024. Under a high-utilization fleet scenario, combined fuel savings and credit revenue could reduce effective fuel cost by approximately USD 0.35 to USD 0.80 per equivalent gallon and expand operating margins by an estimated 3 to 6 percentage points. Fleets that build certified renewable-fuel supply chains and credit-registration systems now will capture this margin upside before regulatory arbitrage closes the window for early movers.
| Opportunity | (~) % Potential CAGR Upside | Geographic Relevance | Execution Window |
|---|---|---|---|
| Renewable Gas Credit Stacking | +0.6% | North America, Europe, India | Medium term (2–4 years) |
| Emerging-Market LNG Corridors | +0.4% | India, Southeast Asia, Latin America | Long term (≥ 4 years) |
| Certified Retrofit-as-a-Service | +0.3% | South Asia, Latin America, Africa | Medium term (2–4 years) |
| Telematics-Led Fuel Optimization | +0.2% | Global commercial fleets | Short term (≤ 2 years) |
| Port and Mine Captive Fleets | +0.15% | Asia-Pacific, Latin America, Australia | Medium term (2–4 years) |
Key Company Insights
Tata Motors Limited reported FY2024 to 25 consolidated revenue of ₹439,700 crore, EBITDA of ₹57,600 crore, and net profit of ₹28,100 crore. This financial scale gives Tata Motors the capital base to sustain simultaneous investment in CNG passenger cars, bi-fuel light commercial vehicles, and electric platforms. In June 2025, Tata Motors launched the Ace Pro in CNG-petrol bi-fuel and electric versions at a starting price of ₹3.99 lakh, directly targeting India’s price-sensitive mini-truck segment with a multi-fuel entry point.
Suzuki Motor Corporation (Maruti Suzuki) reported FY2025 to 26 net sales of ₹1,743,695 million, representing 20.2% growth, confirming its position as a dominant force in India’s passenger-car CNG segment. Maruti Suzuki offered 14 factory-fitted S-CNG models following the addition of the Swift S-CNG in September 2024, giving it the broadest CNG model range of any OEM in the Indian market. In September 2024, the Swift S-CNG launched with certified fuel efficiency of 32.85 km/kg. In January 2024, Maruti Suzuki announced a ₹32 billion fourth production line at Suzuki Motor Gujarat, increasing annual capacity from 750,000 to 1 million vehicles from FY2026 to 27.
Key Players
- Tata Motors Limited
- Suzuki Motor Corporation / Maruti Suzuki
- IVECO Group N.V.
- Volvo Group
- Scania AB
- Daimler Truck AG
- Cummins Inc.
- MAN Truck & Bus SE
- Beiqi Foton Motor Co., Ltd.
- Dongfeng Motor Group Co., Ltd.
- FAW Jiefang Group Co., Ltd.
- Ashok Leyland Limited
- Yutong Bus Co., Ltd.
- Sinotruk — China National Heavy Duty Truck Group
- Westport Fuel Systems Inc.
Recent Developments
- May 7, 2026 – Volvo Trucks announced a new combustion-engine platform supporting gas fuels and delivering up to 4% lower fuel consumption than the preceding engine generation.
- October 6, 2025 – Tesco added 42 IVECO S-Way CNG trucks expected to travel up to 200,000 km each annually and potentially reduce annual CO2 emissions by more than 6,400 tonnes.
- November 14, 2025 – IVECO reported that an S-Way CNG truck traveled more than 1,000 km on a single refueling while consuming less than 21 kg per 100 km.
- September 16, 2025 – Scania reported that its Irizar liquefied-gas coach completed a 700 km return journey without refueling and held a potential range exceeding 1,200 km.
- April 28, 2025 – Daimler Truck North America and Cummins announced summer 2025 production of the fifth-generation Freightliner Cascadia powered by the 15-litre X15N natural-gas engine in 126-inch day-cab and sleeper configurations.
- February 26, 2024 – DHL ordered 178 IVECO S-Way CNG trucks, expanding its CNG fleet to more than 450 vehicles.
- July 10, 2024 – IVECO and the Italian National Research Council published a study showing compressed biomethane could reduce climate-changing gases by up to 96% and nitrogen-oxide emissions by up to 72% versus diesel in the analyzed application.
- August 22, 2024 – Volvo Trucks and DSV signed an agreement covering 300 electric trucks and 500 additional Volvo trucks equipped with diesel and gas drivelines for delivery during 2024 to 2026.
Report Scope
| Report Features | Description |
|---|---|
| Market Value (2025) | USD 29.6 Billion |
| Forecast Revenue (2035) | USD 41.9 Billion |
| CAGR (2026-2035) | 3.9% |
| Base Year for Estimation | 2025 |
| Historic Period | 2020-2024 |
| Forecast Period | 2026-2035 |
| Report Coverage | Revenue Forecast, Market Dynamics, Market Opportunity Analysis, Technology and Innovation Landscape, Competitive Landscape, Recent Developments |
| Segments Covered | By Fuel Type (Compressed Natural Gas (CNG), Liquefied Natural Gas (LNG)), By Vehicle Type (Heavy commercial vehicles, Passenger cars, Light commercial vehicles, Buses and coaches), By Engine Type (Dedicated natural gas, Bi-fuel, Dual-fuel), By Propulsion Technology (Internal combustion engine, Hybrid natural gas vehicle), By Application (Freight and logistics, Personal mobility, Public transportation, Municipal and utility services), By Sales Channel (Original Equipment Manufacturer (OEM), Aftermarket/conversion) |
| Regional Analysis | North America (US and Canada), Europe (Germany, France, The UK, Spain, Italy, and Rest of Europe), Asia Pacific (China, Japan, South Korea, India, Australia, and Rest of APAC), Latin America (Brazil, Mexico, and Rest of Latin America), Middle East and Africa (GCC, South Africa, and Rest of MEA) |
| Competitive Landscape | Tata Motors Limited, Suzuki Motor Corporation / Maruti Suzuki, IVECO Group N.V., Volvo Group, Scania AB, Daimler Truck AG, Cummins Inc., MAN Truck & Bus SE, Beiqi Foton Motor Co., Ltd., Dongfeng Motor Group Co., Ltd., FAW Jiefang Group Co., Ltd., Ashok Leyland Limited, Yutong Bus Co., Ltd., Sinotruk, Westport Fuel Systems Inc. |
| Customization Scope | Customization for segments, region/country-level will be provided. Additional customization can be done based on requirements. |
| Purchase Options | We have three licenses to opt for: Single User License, Multi-User License (Up to 5 Users), Corporate Use License (Unlimited User and Printable PDF) |





































