


Report Overview
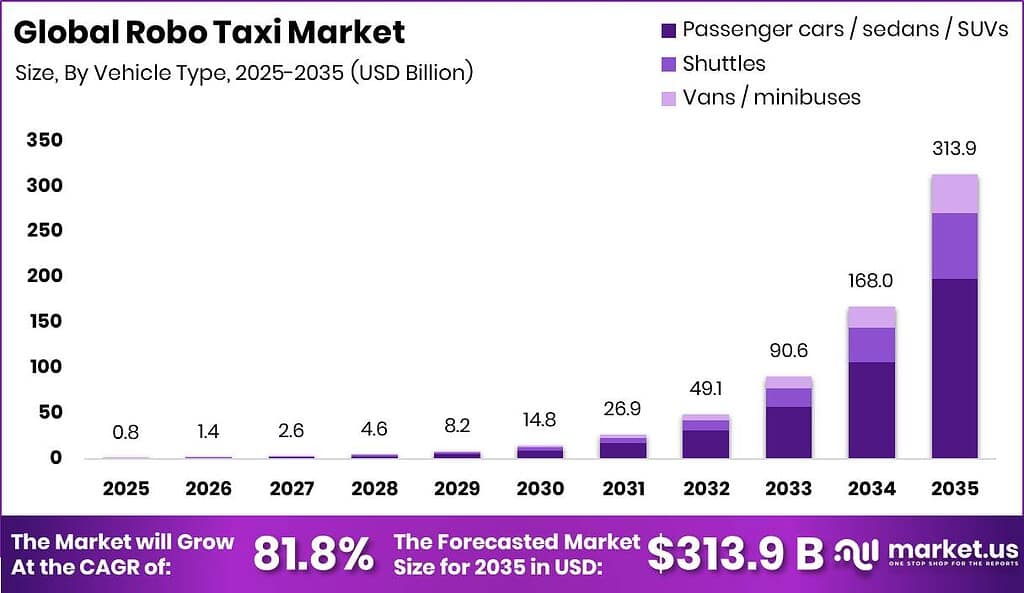
Global Robo Taxi Market size is expected to be worth around USD 313.9 Billion by 2035 from USD 0.8 Billion in 2025, growing at a CAGR of 81.8% during the forecast period 2026 to 2035. This trajectory makes the Robo Taxi Market one of the fastest-scaling commercial transport segments in recorded industry history, driven by the convergence of mature sensor hardware, commercial regulatory permitting, and integrated ride-hailing distribution.
The robo taxi market covers fully autonomous and semi-autonomous on-demand vehicle services that operate without a human safety driver in the primary commercial configuration. The market spans passenger transportation, shared mobility, and goods delivery sub-sectors, segmented by level of autonomy, propulsion type, vehicle class, and service model. Operators deploy fleets through ride-hailing apps, station-based dispatch systems, and subscription rental arrangements across urban and suburban geographies.
Key Takeaways
- The Global Robo Taxi Market was valued at USD 0.8 Billion in 2025 and is forecast to reach USD 313.9 Billion by 2035, at a CAGR of 81.8%.
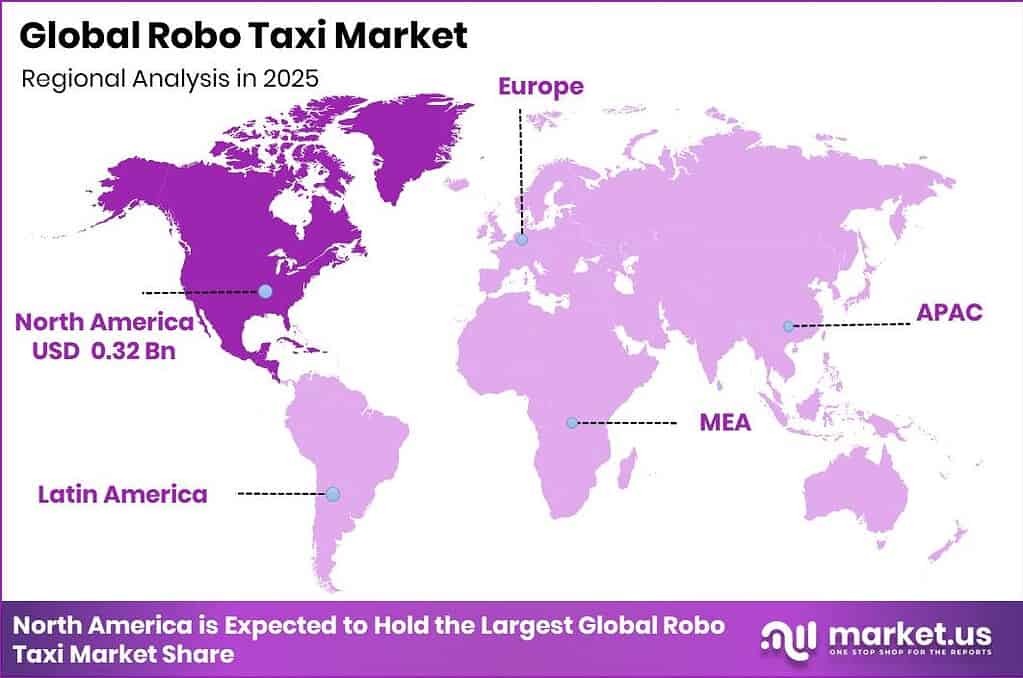
- North America dominates with a market share of 38.7%, valued at USD 0.32 Billion in 2025.
- By Application, Passenger Transportation leads with a share of 85.7%, while Goods/Logistics and Delivery is the fastest-growing sub-segment.
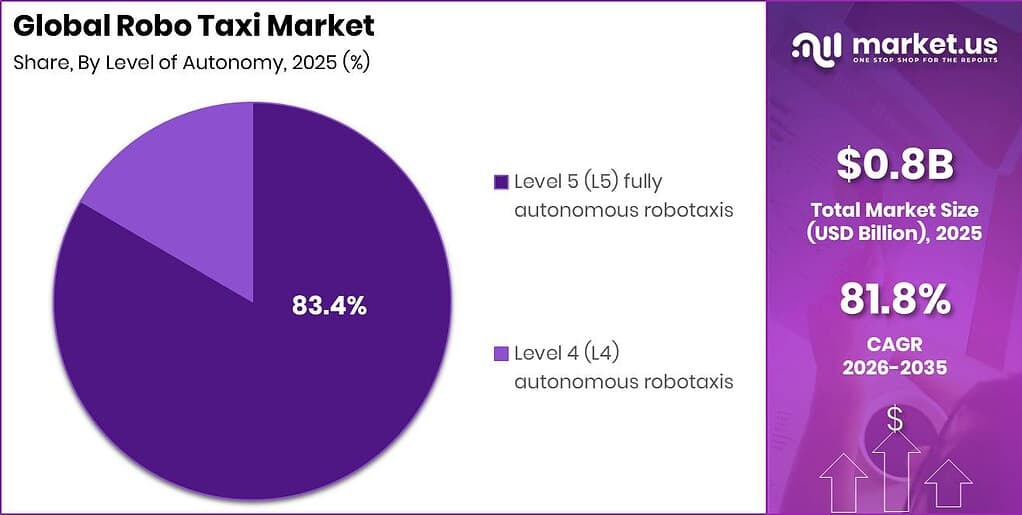
- By Level of Autonomy, Level 5 (L5) Fully Autonomous Robotaxis holds a 83.4% share, while Level 4 is the fastest growing.
- By Propulsion, Battery Electric Vehicles (BEV) lead with a 80.2% share and are also the fastest-growing sub-segment.
- By Vehicle Type, Passenger Cars/Sedans/SUVs hold the dominant share at 63.3%, while Shuttles are the fastest growing.
- By Service Type, Ride-Hailing leads the service category, with Station-Based and Rental-Based services rounding out the segment.
Governments across North America, Europe, and Asia Pacific have accelerated regulatory permitting frameworks for autonomous vehicle commercial deployment. The United States, China, and the United Arab Emirates lead in active commercial licensing, with multi-city permit expansions enabling fleet operators to scale without the per-jurisdiction delays that constrained earlier deployments. Regulatory momentum directly expands addressable geography for operators, converting previously inaccessible corridors into revenue-generating routes within compressed timelines.
As per our research, Waymo surpassed 20 million cumulative paid rides by December 2025, demonstrating that consumer adoption at commercial scale is no longer theoretical. This volume signals that unit economics for fully driverless operations are now stress-tested against real demand cycles. Operators that have crossed this threshold can present audited ride data to institutional investors and insurance underwriters, lowering their cost of capital and unlocking larger fleet financing rounds.
According to Waymo data, its autonomous vehicles recorded 81% fewer injury-causing crashes than the human-driver benchmark as of April 2025. This safety differential converts directly into regulatory goodwill and insurance premium reductions across active operating jurisdictions. Apollo Go accumulated more than 200 million kilometres of autonomous driving by August 2025, a milestone that strengthens the actuarial data base regulators require before granting driverless commercial permits in new cities.
Application Analysis
Passenger Transportation dominates with 85.7% due to urban ride-hailing consumer demand concentration.
In 2025, Passenger Transportation held a dominant market position in the By Application segment of the Robo Taxi Market, with a 85.7% share. Urban populations in major metros across the United States, China, and the UAE generate the highest per-capita demand for on-demand autonomous rides. According to ITU data, more than 4.4 billion people live in urban areas globally, creating a structural addressable pool for autonomous passenger transport. Operators that lock in ride-hailing platform integration in dense cities first will capture disproportionate repeat-use rates before competing services enter their geographies.
Shared Mobility functions as the network-efficiency layer within the passenger application segment. Shared-ride configurations allow operators to increase vehicle utilization per hour without adding fleet units. According to OECD transport data, shared-ride pooling can reduce per-passenger vehicle-kilometres by up to 40% in high-density corridors, lowering operating cost per trip. This efficiency gain makes shared mobility the structural bridge between mass-market adoption and fleet profitability for operators running on thin initial margins.
Goods, Logistics, and Delivery is the fastest-growing sub-segment within the application category. Autonomous vehicles optimized for passenger transport are progressively being re-permitted for last-mile parcel and food delivery in jurisdictions including California and select Chinese provinces. According to the U.S. Census Bureau, e-commerce shipments in the United States exceeded 1.1 trillion USD in 2024, creating a vast demand signal that autonomous delivery operators can intercept using existing AV mapping and sensor infrastructure. Operators that extend passenger-certified platforms into delivery without rebuilding their core stack will compress the unit economics gap between the two verticals fastest.
Public Mobility and Private Mobility collectively serve institutional and corporate transport needs outside the consumer ride-hailing channel. Public Mobility contracts with municipal transit agencies provide long-duration, route-predictable deployments that reduce operational complexity compared to dynamic dispatch. Private Mobility agreements with corporate campuses and airports represent guaranteed volume commitments that anchor fleet utilization floors across off-peak hours, with remaining share distributed between these two sub-segments.
Level of Autonomy Analysis
Level 5 (L5) Fully Autonomous Robotaxis dominates with 83.4% due to no human intervention requirement enabling full commercial driverless operation.
In 2025, Level 5 (L5) Fully Autonomous Robotaxis held a dominant market position in the By Level of Autonomy segment of the Robo Taxi Market, with a 83.4% share. L5 systems require zero human input under any road condition, eliminating the safety-driver cost that accounts for an estimated 60% to 70% of total per-mile operating expense in earlier conditional autonomy configurations, based on labor cost benchmarks from the U.S. Bureau of Labor Statistics. Operators deploying L5 fleets convert from a labor-intensive variable cost model to a predominantly fixed-asset cost model, a structural shift that supports gross margin expansion as fleet scale increases.
Level 4 (L4) Autonomous Robotaxis represent the fastest-growing sub-segment within the autonomy classification. L4 systems operate without human intervention within geographically defined operational design domains, allowing commercial deployment in city-specific corridors before full L5 certification is achieved. According to SAE International technical standards documentation, more than 30 jurisdictions globally have active L4 commercial operating permits as of 2025, with new permits issued at an accelerating rate as regulators refine domain-specific approval frameworks. Investors targeting near-term revenue should prioritize L4-first operators that demonstrate a credible technical roadmap to L5 expansion within a defined geographic boundary.
Propulsion Analysis
Battery Electric Vehicles (BEV) dominates with 80.2% due to zero-emission compliance and lower per-mile energy cost advantage.
In 2025, Battery Electric Vehicles (BEV) held a dominant market position in the By Propulsion segment of the Robo Taxi Market, with a 80.2% share. BEV platforms eliminate tailpipe emissions while reducing per-mile fuel cost by an estimated 50% to 60% compared with internal combustion equivalents, based on IEA energy price benchmarks. BEVs are also the fastest-growing propulsion sub-segment, driven by expanding charging infrastructure and declining battery pack costs. Operators building BEV-first fleets position themselves to meet zero-emission zone regulations across European and Asian cities that mandate non-ICE commercial vehicle deployment timelines.
Hybrid Electric Vehicles serve as a transitional propulsion option in markets where charging infrastructure density has not yet reached the threshold needed to support fully electric fleet rotations. Hybrid platforms extend operational range in suburban and exurban corridors that BEV fleets cannot yet serve without unacceptable charging downtime. According to IEA Global EV Outlook data, public charging points globally grew to more than 3 million installations by end-2024, but rural and secondary city coverage remains sparse, sustaining near-term demand for hybrid-capable autonomous platforms.
Fuel Cell Vehicles (FCEV) and Internal Combustion Engine (ICE) robotaxis together occupy the remaining propulsion share. FCEVs offer longer range and faster refueling than BEVs and are being evaluated in heavy-use corridors by operators in Japan and South Korea, where hydrogen infrastructure investment by government bodies such as the New Energy and Industrial Technology Development Organization has concentrated. ICE platforms remain in limited transitional deployment where neither BEV nor FCEV infrastructure exists, but operator and regulatory pressure continues to compress their addressable window.
Vehicle Type Analysis
Passenger Cars/Sedans/SUVs dominates with 63.3% due to standard road compatibility across permitted urban corridors.
In 2025, Passenger Cars/Sedans/SUVs held a dominant market position in the By Vehicle Type segment of the Robo Taxi Market, with a 63.3% share. Standard passenger car form factors fit existing urban infrastructure without requiring dedicated lanes, modified curb cuts, or special loading zones, which accelerates deployment timelines in newly permitted cities. According to World Bank infrastructure data, more than 85% of road networks in high-income countries are engineered to standard passenger car dimensions. This compatibility advantage means sedan and SUV-format robotaxis can enter a new market with minimal physical infrastructure investment, lowering capital requirements for city-entry relative to larger vehicle classes.
Shuttles represent the fastest-growing vehicle type in the robo taxi segment. Shuttle-format autonomous vehicles carry between six and fourteen passengers per trip, improving revenue per vehicle-hour in high-density corridors such as airport connectors, stadium routes, and urban transit feeder services. According to national transit association data from the American Public Transportation Association, fixed-route shuttle demand in US metro areas supported more than 2.8 billion unlinked passenger trips in 2024. Operators that configure shuttle-format robotaxis for airport and transit connector routes can undercut traditional shuttle operators on both cost and scheduling reliability.
Vans and Minibuses occupy the remaining vehicle type share, serving group transport applications that require higher passenger capacity than standard sedans but operate within the same urban geographies. These platforms are particularly relevant for corporate shuttle services, event transport, and accessible mobility programs where per-seat cost matters more than per-trip pricing. Their slower growth relative to shuttles reflects longer autonomous certification timelines for larger vehicle platforms under current NHTSA and equivalent international regulatory frameworks.
Service Type Analysis
Ride-Hailing dominates with the highest share due to app-integrated consumer demand and network platform scale advantages.
In 2025, Ride-Hailing held a dominant market position in the By Service Type segment of the Robo Taxi Market. Dynamic dispatch through consumer-facing mobile applications gives ride-hailing operators continuous access to real-time demand signals across city geographies. According to UNCTAD digital economy data, global mobile payment transaction volumes reached USD 8.5 trillion in 2024, reflecting the consumer behavioral infrastructure that ride-hailing platforms depend on. Operators that embed autonomous vehicles into established ride-hailing applications inherit existing consumer bases without building new acquisition channels, compressing their go-to-market costs relative to standalone deployment models.
Station-Based service models deploy robotaxis from fixed dispatch hubs at airports, transit terminals, and commercial zones, creating predictable demand pools with low dispatch complexity. Fixed-origin deployments reduce the navigational variability that dynamic dispatch systems must resolve, lowering per-trip compute and teleoperation cost. According to Airports Council International traffic data, the world’s top 100 airports collectively handled more than 7.8 billion passenger movements in 2024, representing a concentrated and recurring demand pool for station-based autonomous vehicle services that operators can enter through airport authority concession agreements.
Rental-Based service models offer time-block autonomous vehicle access to individual consumers or corporate clients, functioning closer to a car rental or subscription arrangement than a per-trip dispatch model. This model suits lower-density suburban markets where dynamic dispatch yields insufficient vehicle utilization to cover fleet costs. Rental-based frameworks also provide operators with predictable revenue per vehicle per day, which improves cash flow forecasting for fleet financing purposes. The remaining market share distributes across station-based and rental-based configurations as operators test which service format captures the highest repeat-use loyalty in each city geography.
Key Market Segments
By Application
- Passenger Transportation
- Shared Mobility
- Goods / Logistics and Delivery
- Public Mobility
- Private Mobility
By Level of Autonomy
- Level 4 (L4) Autonomous Robotaxis
- Level 5 (L5) Fully Autonomous Robotaxis
By Propulsion
- Battery Electric Vehicles (BEV)
- Hybrid Electric Vehicles
- Fuel Cell Vehicles (FCEV)
- Internal Combustion Engine (ICE) Robotaxis
By Vehicle Type
- Passenger Cars / Sedans / SUVs
- Shuttles
- Vans / Minibuses
By Service Type
- Ride-Hailing
- Station-Based
- Rental-Based
Regional Analysis
North America Dominates the Robo Taxi Market with a Market Share of 38.7%, Valued at USD 0.32 Billion
North America leads global robo taxi commercialization through a combination of multi-city permitting, platform integration, and deep capital availability. The United States hosts the most commercially active driverless fleets across San Francisco, Los Angeles, Phoenix, Austin, and Atlanta, each operating under state-level DMV permits that allow fully driverless passenger services. This regulatory plurality gives US-based operators the largest continuously expanding operational design domain in any single national market, translating permitting momentum directly into route density and revenue per fleet unit.
Asia Pacific represents the fastest-growing regional market, anchored by China’s aggressive driverless permitting and fleet scaling. Apollo Go exceeded 14 million cumulative passenger rides by August 2025 while operating in 16 cities, demonstrating that the Chinese regulatory environment now supports sustained commercial volume at scale. By February 2025, Apollo Go had transitioned to 100% fully driverless operation in more than 10 Chinese cities, eliminating safety-driver costs across its core Chinese network and advancing the unit-economics argument for autonomous mobility in one of the world’s highest-density urban markets.
Europe is an emerging commercial zone with active testing operations that are building the operational data base required for full commercial permits. Waymo’s London testing program runs 24 hours per day and 7 days per week, generating continuous safety validation data across varied UK road conditions. By October 2025, WeRide had deployed Level 4 autonomous fleets in 11 countries and more than 30 cities globally, with European corridors included as part of its international expansion footprint. As of February 2026, Apollo Go had expanded its city presence to 26 cities worldwide, reflecting the breadth of Asia Pacific-led global scaling that pulls regulatory benchmarks upward across all regions.
The Middle East and Africa region is emerging as a commercially active market through structured regulatory sandbox arrangements. WeRide deployed more than 300 robo-taxis in Guangzhou and more than 100 in Beijing by October 2025, while its Middle East fleet exceeded 100 robo-taxis across Abu Dhabi, Dubai, and Riyadh in 2025. In November 2025, WeRide and Uber launched the Middle East’s first fully driverless commercial robotaxi service in Abu Dhabi, enabling passengers to book autonomous rides directly through the Uber platform. A single WeRide vehicle in Abu Dhabi completed as many as 20 trips during a 12-hour shift in 2025, with typical journey distances exceeding 6 kilometres, confirming that MEA operating conditions support commercially viable per-vehicle economics.
Key Regions and Countries
North America
- US
- Canada
Europe
- Germany
- France
- The UK
- Spain
- Italy
- Rest of Europe
Asia Pacific
- China
- Japan
- South Korea
- India
- Australia
- Rest of APAC
Latin America
- Brazil
- Mexico
- Rest of Latin America
Middle East and Africa
- GCC
- South Africa
- Rest of MEA
Market Dynamics
Market Opportunity Analysis - Underexploited service types, emerging regions, and subscription models represent the next commercial frontier for robo taxi operators.
Rental-Based and Station-Based service models remain structurally underexploited despite controlling a meaningful share of the By Service Type segment. Operators have concentrated fleet deployment and product development resources on dynamic ride-hailing dispatch, leaving station-based and rental-based configurations without equivalent investment in demand generation or geographic expansion. New entrants that target fixed-route airport and transit connector deployments through station-based models can build predictable revenue without the algorithmic dispatch complexity that ride-hailing requires, lowering their operational overhead relative to incumbents.
The Middle East and Africa region presents a high-density commercial opportunity that current fleet scale does not yet match. WeRide’s robo-taxi business represented approximately 21% of its total company revenue in Q3 2025, despite operating across Abu Dhabi, Dubai, and Riyadh with a fleet that exceeded 100 vehicles in the region. This revenue contribution relative to a sub-100-vehicle fleet signals strong per-vehicle revenue productivity in MEA operating conditions, a metric that justifies rapid fleet expansion before competing operators deploy in the same geographies.
Latin America and Southeast Asia contain large urban populations with high ride-hailing adoption rates but no active commercial robo taxi deployments as of early 2026. Both regions have established ride-hailing consumer bases through Grab, Gojek, and local platforms, meaning consumer behavioral adoption is not a barrier. Operators that enter these regions through regulatory sandbox agreements, mirroring the Abu Dhabi model, can capture first-mover permit advantages in markets where permit frameworks are still being written, giving early entrants structural regulatory protection that late arrivals will not be able to replicate.
The Vans and Minibuses vehicle type sub-segment is underserved relative to its institutional demand potential. Corporate campuses, universities, and hospitals represent a concentrated demand pool for group transport that standard sedan-format robotaxis cannot serve efficiently. This segment does not require dynamic dispatch infrastructure and operates within defined geographies with predictable peak demand windows, making it a low-complexity entry point for operators looking to diversify vehicle type revenue without building new consumer-facing distribution channels.
Technology and Innovation Landscape - Autonomy stack maturity, fleet generation advances, and carbon accounting innovations are redefining competitive position in robo taxi operations.
By February 2026, Apollo Go’s vehicles accumulated more than 300 million autonomous kilometres, including over 190 million kilometres driven fully driverlessly. This mileage concentration represents the single largest input to machine learning model retraining at commercial scale, giving Apollo Go a compounding data advantage that widens with every additional kilometre logged. Operators with larger autonomous mileage bases can retrain perception models against rare edge cases faster than competitors with thinner data sets, directly accelerating the cadence at which they can expand into new and more complex geographies.
Pony.ai operated 961 robo-taxis in November 2025, including 667 seventh-generation vehicles, demonstrating the pace of hardware iteration now occurring within commercial AV fleets. Seventh-generation vehicles carry updated sensor arrays, reduced compute footprints, and lower manufacturing cost per unit relative to prior generations. Each hardware generation cycle compresses the capital required to deploy an equivalent-performance vehicle, lowering the fleet CapEx threshold for new operators entering the market and widening the gross margin available to incumbents already operating earlier-generation platforms at depreciated book values.
WeRide’s Abu Dhabi service covered approximately 50% of the city’s core area in 2025, including highways and the airport. Achieving this geographic coverage density requires high-definition mapping of complex multi-lane and interchange environments that standard urban grid deployments do not encounter. Operators that successfully map and certify highway and airport corridor operations build a technical capability set that transfers directly to other cities with similar infrastructure profiles, multiplying the value of each mapping investment beyond its original deployment geography.
Waymo estimated that its riders avoided more than 18 million kilograms of CO2 emissions during 2025, approximately three times its prior reported level. This carbon-accounting capability transforms Waymo’s operational data into a monetizable ESG asset that corporate fleet clients and municipal transport authorities can use to meet their own sustainability reporting obligations. Operators that build verifiable emissions-avoidance reporting infrastructure now will capture institutional fleet contracts where sustainability metrics are a procurement requirement, separating them from competitors that offer equivalent ride performance without carbon documentation.
Drivers
Removing driver wages from ride-hailing operations restructures cost-per-mile economics at the platform level. Operators running fully driverless fleets report fleet utilization rising by roughly 30% to 40% versus human-driven baselines because vehicles can sustain continuous duty cycles without fatigue-related rest requirements. This operating-cost compression reduces cost-per-mile by an estimated 20% to 25% once safety-driver headcount is fully removed, expanding gross margin by an estimated 8 to 12 percentage points per ride. Capital previously allocated to driver payroll redirects toward fleet expansion, accelerating the shift from asset-light licensing toward vertically integrated fleet ownership.
| Driver | (~) % Impact on CAGR Forecast | Geographic Relevance | Impact Timeline |
|---|---|---|---|
| Autonomous Fleet Labor-Cost Elimination | +4.5% | Global | Short term (2 years or less) |
| Multi-City Regulatory Permitting Expansion | +3.2% | North America | Short term (2 years or less) |
| LiDAR and Sensor Cost Deflation | +2.8% | Global | Short term (2 years or less) |
| OEM-Technology Capital Partnerships | +2.5% | North America & Europe | Medium term (2 to 4 years) |
| Ride-Hailing Platform Integration | +2.0% | Global | Short term (2 years or less) |
| Zero-Emission Fleet Electrification Synergy | +1.8% | Global | Medium term (2 to 4 years) |
Restraints
Acute safety failure events trigger statutory permit freezes that halt fleet additions across entire national jurisdictions. The March 2026 stalling of more than 100 Apollo Go vehicles on public roads in Wuhan triggered a nationwide Chinese suspension on new autonomous-vehicle operating permits lasting roughly three months. This froze fleet-vehicle additions and new-city launches across the world’s largest robotaxi testing jurisdiction. The California DMV’s revocation of Cruise’s operating permit in October 2023 halted driverless service across every US city Cruise operated in for over 12 months, establishing a precedent that any single incident can cascade into a multi-market operational shutdown.
Permit suspensions translate into measurable financial damage for listed operators. Idled fleets accumulate depreciation without generating offsetting fare revenue. Operators simultaneously divert engineering teams toward regulatory remediation rather than route-density expansion, compressing both near-term revenue and medium-term product development output. Insurance underwriting constraints compound this drag, as underwriters in North America and Europe tighten capacity when suspension events generate adverse actuarial data, raising per-vehicle premium costs at precisely the moment operators need capital freed for fleet recovery. This combined friction deducts an estimated -4.0% from the baseline 81.8% CAGR.
| Restraint | (~) % Impact on CAGR Forecast | Geographic Relevance | Impact Timeline |
|---|---|---|---|
| Regulatory License Suspensions and Fleet Moratoria | -4.0% | China & United States | Short term (2 years or less) |
| Elevated Interest Rate Financing Constraints | -2.5% | Global | Short term (2 years or less) |
| AV-Grade Semiconductor Export Controls | -2.2% | China & United States | Medium term (2 to 4 years) |
| State-Level Outright Testing Bans | -1.8% | United States (select states) | Short term (2 years or less) |
| Insurance Underwriting Capacity Constraints | -1.5% | North America & Europe | Short term (2 years or less) |
Challenges
Rare driving scenarios, including construction zones, sudden weather transitions, and erratic pedestrian movement, continue to generate misclassification events that California DMV disengagement reports recorded as thousands of manual interventions per million autonomous miles across permitted operators through 2025. A mid-sized fleet generates between 1.5 and 2 petabytes of LiDAR, radar, and camera data monthly, according to SAE International technical committee benchmarks. This sensor-data volume strains cloud compute budgets and extends the over-the-air validation cycle that NHTSA’s Standing General Order framework requires before software updates deploy fleet-wide.
Operators must sustain R&D spending at 15% to 20% of revenue to address long-tail perception failures, well above mature transport software benchmarks. This elevated spend rate forces AV companies to maintain costly redundant teleoperation staffing as a structural cost center rather than a temporary bridge measure. Cross-jurisdictional regulatory fragmentation compounds the challenge, as each new operating city requires separate permitting with locally specific safety demonstration requirements, multiplying compliance costs and slowing geographic expansion timelines. This friction collectively caps the market’s maximum growth ceiling by an estimated -2.5% against the baseline 81.8% trajectory.
| Challenge | (~) % CAGR Friction Drag | Geographic Relevance | Mitigation Horizon |
|---|---|---|---|
| Long-Tail Edge-Case Perception | -2.5% | Global | Medium term (2 to 4 years) |
| Public Trust and Safety Perception | -2.0% | Global | Medium term (2 to 4 years) |
| Cross-Jurisdictional Regulatory Fragmentation | -1.8% | Global | Long term (4 years or more) |
| AI and Robotics Talent Shortage | -1.5% | Global | Medium term (2 to 4 years) |
| Sensor Data Storage and Compute Scaling | -1.2% | Global | Medium term (2 to 4 years) |
| Charging and Depot Infrastructure Lag | -1.0% | Global | Medium term (2 to 4 years) |
Opportunities
Robo taxi operators have built and fully depreciated their core sensor, compute, and mapping infrastructure specifically for passenger transport. Extending this same stack into goods, logistics, and last-mile delivery creates a second revenue line without rebuilding the technical foundation. Fleet utilization hours could increase by an estimated 25% to 35% per vehicle by absorbing delivery demand during off-peak passenger hours, based on US Census Bureau e-commerce delivery-volume trends. Cost-per-parcel-mile would compress by roughly 15% to 20% relative to traditional last-mile courier networks, per national freight association benchmarking, opening a +3.5% upside above the baseline CAGR.
Realizing the freight adjacency opportunity requires deliberate regulatory action including new licensing applications, depot retrofits, and freight-specific liability insurance, none of which are extensions of existing passenger permits. Operators that file cross-vertical licensing applications within the next 24 to 36 months will reach commercial freight deployments ahead of competitors who wait for sector-specific standards to fully consolidate. Early movers in this vertical expansion can lift gross margin by an estimated 4 to 6 percentage points through shared fixed-asset depreciation across passenger and freight operations within the same fleet.
| Opportunity | (~) % Potential CAGR Upside | Geographic Relevance | Execution Window |
|---|---|---|---|
| Adjacent Autonomous Freight and Last-Mile Delivery | +3.5% | Global | Medium term (2 to 4 years) |
| Emerging Market Regulatory Sandbox Entry | +2.8% | Southeast Asia, Middle East & Latin America | Medium term (2 to 4 years) |
| Robotaxi-as-a-Service Subscription Monetization | +2.0% | Global | Medium term (2 to 4 years) |
| Fleet Licensing and Franchise Roll-Up Model | +1.8% | Global | Long term (4 years or more) |
| In-Cabin Advertising and Data Monetization | +1.6% | North America & Europe | Medium term (2 to 4 years) |
| Smart City V2X Infrastructure Integration | +1.5% | Global | Long term (4 years or more) |
Key Company Insights
Waymo LLC has built its competitive position on the industry’s most audited safety and scale data set. Waymo completed more than 14 million fully autonomous trips during 2025 and accumulated 220.6 million rider-only miles without a human driver through March 2026. Weekly trip volume climbed from more than 200,000 in February 2025 to more than 450,000 by December 2025. This volume depth gives Waymo an actuarial data advantage that competitors cannot replicate quickly, lowering its insurance underwriting costs and strengthening its regulatory standing in every new city it enters.
Baidu’s Apollo Go has demonstrated the fastest quarter-over-quarter volume scaling of any robo taxi operator globally. Apollo Go supplied more than 1.4 million rides in Q1 2025, then more than 2.2 million fully driverless rides in Q2 2025, a 148% increase over Q2 2024. By Q4 2025, quarterly volume reached 3.4 million rides, up more than 200% year over year, with cumulative public rides exceeding 20 million by February 2026. Its global fleet reached 1,000 vehicles in May 2025. In May 2025, Uber invested USD 100 million in WeRide to expand autonomous mobility partnerships across international markets, signaling that platform capital is actively consolidating around operators with proven multi-city scale.
Key Players
- Waymo LLC (Alphabet)
- Cruise LLC (General Motors)
- Tesla, Inc.
- Baidu – Apollo Go
- AutoX, Inc.
- Pony.ai
- WeRide
- Zoox, Inc. (Amazon)
- Didi Chuxing
- Navya
- Nuro
- Uber Technologies Inc
- Lyft, Inc.
- SAIC
- BMW Group
Recent Developments
- March 2025: Waymo launched its fully autonomous robotaxi service in Austin, Texas, exclusively through the Uber app, marking its first large-scale integration with a global ride-hailing platform.
- April 2025: Zoox announced expansion into Los Angeles, extending testing of its purpose-built robotaxi designed without a steering wheel or pedals ahead of commercial deployment.
- September 2025: Zoox commercially launched its purpose-built robotaxi service in Las Vegas, enabling public rides in vehicles designed specifically for autonomous operation.
- February 2026: Waymo raised USD 16 billion in new funding, valuing the company at approximately USD 126 billion to accelerate robotaxi fleet expansion and entry into additional markets.
Geopolitical Impact Analysis
US-China semiconductor export controls, which the US Commerce Department expanded in October 2023 and tightened further in 2024, restrict Chinese robo taxi operators from accessing advanced US-manufactured AI chips used in perception and compute stacks. According to WTO trade restriction data, affected chip categories include high-bandwidth memory and advanced logic processors that AV-grade sensor fusion platforms require. This forces Chinese operators to either substitute domestic chip alternatives at higher cost or accept capability gaps in processing throughput, directly raising per-vehicle build cost and slowing the vehicle generation refresh cycles that Pony.ai and WeRide have relied upon for competitive hardware iteration.
Global freight cost volatility compounds supply chain risk for operators sourcing LiDAR units, radar modules, and battery packs across multiple continents. According to World Bank commodity price data, logistics costs for precision electronics shipments rose by an estimated 35% to 45% between 2021 and 2024 before partially recovering. UNCTAD shipping data shows average container transit times on Asia-to-North America lanes remain 15% to 20% longer than 2019 baselines due to port congestion and route rerouting driven by Red Sea disruptions. These input-cost and lead-time pressures extend fleet build timelines and raise the per-unit cost of fleet expansion for operators dependent on cross-continental component sourcing.
Report Scope
| Report Features | Description |
|---|---|
| Market Value (2025) | USD 0.8 Billion |
| Forecast Revenue (2035) | USD 313.9 Billion |
| CAGR (2026-2035) | 81.8% |
| Base Year for Estimation | 2025 |
| Historic Period | 2020-2024 |
| Forecast Period | 2026-2035 |
| Report Coverage | Revenue Forecast, Market Dynamics, Market Opportunity Analysis, Technology and Innovation Landscape, Competitive Landscape, Recent Developments |
| Segments Covered | By Application (Passenger Transportation, Shared Mobility, Goods/Logistics and Delivery, Public Mobility, Private Mobility), By Level of Autonomy (Level 4 Autonomous Robotaxis, Level 5 Fully Autonomous Robotaxis), By Propulsion (Battery Electric Vehicles, Hybrid Electric Vehicles, Fuel Cell Vehicles, Internal Combustion Engine Robotaxis), By Vehicle Type (Passenger Cars/Sedans/SUVs, Shuttles, Vans/Minibuses), By Service Type (Ride-Hailing, Station-Based, Rental-Based) |
| Regional Analysis | North America (US and Canada), Europe (Germany, France, The UK, Spain, Italy, and Rest of Europe), Asia Pacific (China, Japan, South Korea, India, Australia, and Rest of APAC), Latin America (Brazil, Mexico, and Rest of Latin America), Middle East and Africa (GCC, South Africa, and Rest of MEA) |
| Competitive Landscape | Waymo LLC (Alphabet), Cruise LLC (General Motors), Tesla Inc., Baidu – Apollo Go, AutoX Inc., Pony.ai, WeRide, Zoox Inc. (Amazon), Didi Chuxing, Navya, Nuro, Uber Technologies Inc., Lyft Inc., SAIC, BMW Group |
| Customization Scope | Customization for segments, region / country-level will be provided. Additional customization can be done based on requirements. |
| Purchase Options | We have three licenses to opt for: Single User License | Multi-User License (Up to 5 Users) | Corporate Use License (Unlimited User and Printable PDF) |





































