


Report Overview
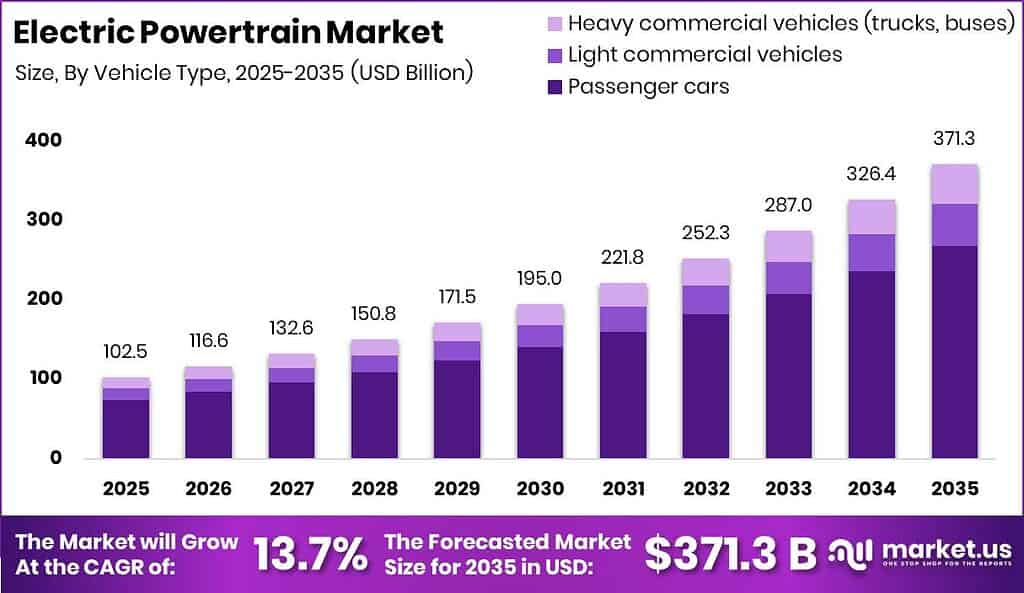
Global Electric Powertrain Market size is expected to be worth around USD 371.3 Billion by 2035 from USD 102.5 Billion in 2025, growing at a CAGR of 13.7% during the forecast period 2026 to 2035.
The electric powertrain market encompasses the full suite of mechanical, electrical, and electronic systems that convert stored energy into vehicle motion. This includes batteries, electric motors, power electronics controllers, DC-DC and AC-DC converters, transmissions, and on-board chargers. These components serve passenger cars, commercial vehicles, two-wheelers, and off-highway equipment across battery electric, hybrid, plug-in hybrid, fuel cell, and mild hybrid architectures.
Key Takeaways
- Market value in 2025: USD 102.5 Billion
- Market value in 2035: USD 371.3 Billion
- CAGR 2026–2035: 13.7%
- Dominant component segment: Battery with 62.2% share
- Dominant vehicle type segment: Battery Electric Vehicles (BEV) with 70.1% share
- Dominant vehicle category: Passenger cars with 72.3% share
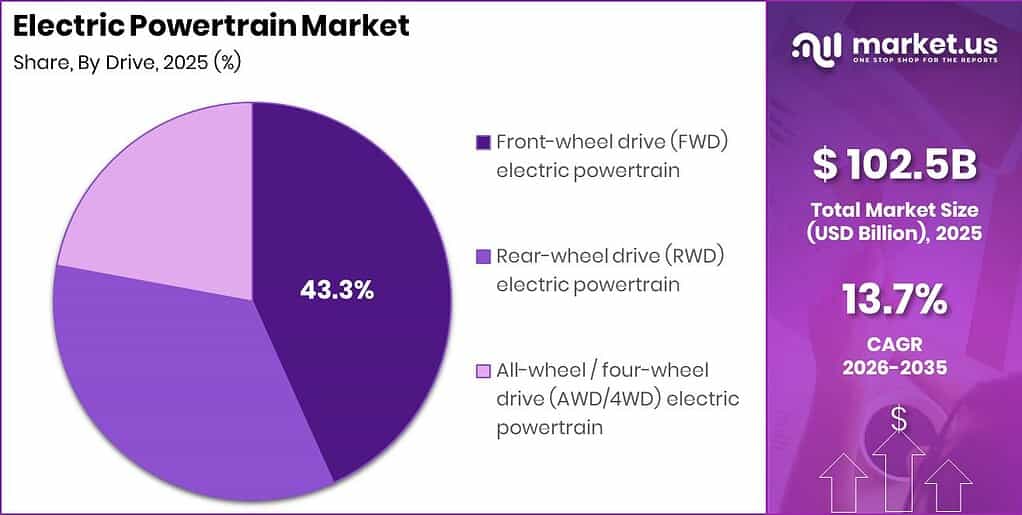
- Dominant drive segment: Front-wheel drive (FWD) electric powertrain with 43.3% share
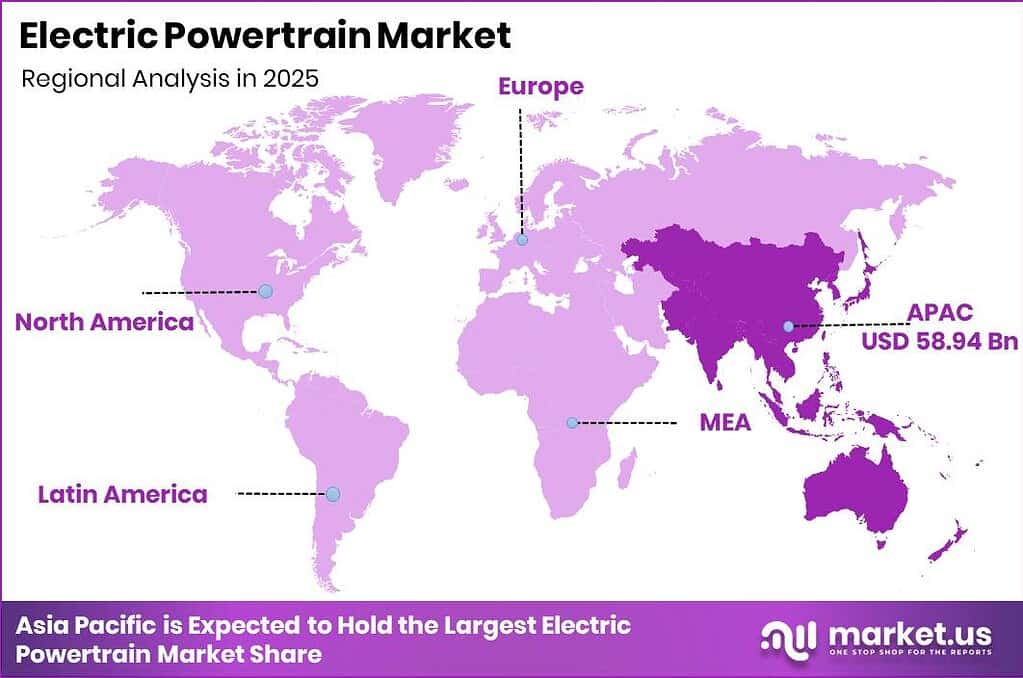
- Dominant region: Asia Pacific with 57.5% market share, valued at USD 58.94 Billion
According to the IEA, global EV-battery deployment reached 1.2 TWh in 2025, an increase of almost 30% from 2024 and more than 7 times the 2020 level. This scale signals that battery-electric powertrain manufacturing has crossed from early-adopter territory into mainstream industrial volume, giving established Tier-1 suppliers a durable cost-structure advantage over late entrants.
As per our research, a 2025 peer-reviewed technical review reported a $6/kW production-cost target for electric traction-drive systems covering power electronics and electric motors. Reaching this target unlocks cost parity with legacy drivetrain assemblies for several vehicle classes. Suppliers who achieve this threshold first will capture long-term platform contracts across multiple OEM programs.
Component Analysis
Battery dominates with 62.2% due to highest per-unit cost and energy density centrality.
In 2025, Battery held a dominant market position in the By Component segment of the Electric Powertrain Market, with a 62.2% share. Honda’s 2025 WN7 electric motorcycle integrates a 9.3 kWh fixed lithium-ion battery delivering a measured cruising range of 140 km under WMTC testing. This real-world performance benchmark demonstrates that even two-wheeler applications now require purpose-engineered, high-energy-density battery packs rather than repurposed cell modules. Suppliers who develop compact, thermally managed pack architectures for two- and three-wheeler platforms gain access to volume-intensive emerging-market segments.
The electric motor is the second major powertrain sub-system. Honda’s 2025 WN7 uses a water-cooled motor with an integrated inverter delivering 50 kW maximum output and 100 Nm maximum torque. Thermal integration at the motor-inverter junction reduces part count and assembly cost. Manufacturers that commercialize co-designed motor-inverter assemblies for two-wheeler OEMs will outperform competitors still supplying discrete components on separate contracts.
The power electronics controller governs energy flow across the entire drivetrain. The Leapmotor T03 pairs a 6.6 kW on-board AC charger with acceptance of up to 48 kW through DC charging. This dual-rate architecture requires a sophisticated power electronics stack to manage voltage and current conditioning across both input modes. Controller suppliers that support wide input-voltage windows without sacrificing conversion efficiency hold a structural product advantage in entry-level EV segments where cost sensitivity is highest.
The on-board charger, converter, and transmission sub-systems complete the drivetrain stack. Honda’s WN7 fast-charges from 20% to 80% in approximately 30 minutes, while normal charging completes in under 2.4 hours. This charging flexibility requires on-board chargers capable of switching between AC and DC power profiles without hardware changes. Suppliers offering universal charging protocol support reduce OEM integration risk across diverse charging infrastructure markets. Electric Cross Differential modules, DC-DC converters, and multi-speed transmission units hold the remaining component share collectively.
Vehicle Type (Powertrain Architecture) Analysis
Battery electric vehicles (BEV) dominates with 70.1% due to zero tailpipe emission regulatory alignment.
In 2025, Battery Electric Vehicles (BEV) held a dominant market position in the By Vehicle Type segment of the Electric Powertrain Market, with a 70.1% share. The Leapmotor T03 charges from 30% to 80% in approximately 3.5 hours through a domestic wallbox but only 36 minutes through a DC charger, roughly 83% less time. This charging speed gap directly shapes consumer range-anxiety behavior and fleet operator charging-schedule decisions. BEV powertrain suppliers that engineer platforms compatible with both AC and DC infrastructure maximize total addressable market across urban and highway duty cycles.
Hybrid electric vehicles (HEV) attract buyers who require combustion redundancy where charging infrastructure is sparse. Toyota’s 2026 C-HR+, bZ4X, and RZ electric platforms provide system-output configurations of 123 kW, 165 kW, and 252 kW, depending on model and drivetrain. This power-tier architecture lets a single OEM serve economy, mid-range, and performance buyer segments from one platform family. Powertrain suppliers who can scale motor and inverter output across this range within a shared mechanical envelope reduce tooling costs and shorten OEM qualification cycles.
Plug-in hybrid electric vehicles (PHEV) serve markets where long-range confidence is non-negotiable. Toyota’s 2026 electric platforms include battery preconditioning that targets a rapid-charging time of approximately 30 minutes under cold conditions. Cold-weather performance has historically been a conversion barrier for PHEV and BEV buyers in northern-climate markets. Powertrain suppliers that integrate thermal management into the battery and charging system rather than treating it as an add-on module will capture share in Scandinavia, Canada, and northern China where winter range loss is a documented purchase objection. Fuel cell electric vehicles (FCEV) and 48V mild hybrid vehicles (MHEV) hold the remaining architecture share collectively.
In April 2026, Valeo introduced its latest integrated electric propulsion and thermal management technologies at Auto China 2026, including next-generation electric powertrain solutions designed for accelerated vehicle development. This launch signals that top-tier Tier-1 suppliers are now competing on system integration speed, not just component performance. OEMs that partner with vertically integrated powertrain suppliers gain faster time-to-market for new vehicle programs relative to those assembling drivetrains from multi-vendor component sets.
Vehicle Category Analysis
Passenger cars dominates with 72.3% due to highest global production volume and consumer EV adoption.
In 2025, Passenger Cars held a dominant market position in the By Vehicle Category segment of the Electric Powertrain Market, with a 72.3% share. The 2025 Mazda6e was offered with 68.8 kWh and 80 kWh battery configurations, supporting stated driving ranges of 479 km and 552 km, respectively. Offering tiered battery options within a single nameplate allows OEMs to address both price-sensitive and range-priority buyer segments without developing separate platforms. Powertrain suppliers that support modular battery capacity configurations within a common mechanical footprint reduce OEM tooling investment and simplify supply chain management.
Light commercial vehicles represent the next major demand node for electric powertrain adoption. Toyota’s 2026 e-Palette autonomous mobility platform uses a 72.82 kWh lithium-ion battery that reaches approximately 80% charge in 40 minutes through a 90 kW, 200 A DC charger. This fast-charge capability is operationally essential for fleet operators running continuous urban delivery cycles with minimal vehicle downtime. Suppliers who engineer powertrain systems around high-C-rate charging requirements, rather than adapting passenger-car platforms, will establish a first-mover position in the urban logistics electrification segment.
Heavy commercial vehicles, including trucks and buses, represent the longest-range opportunity by per-unit powertrain content value. Toyota’s 2026 e-Palette AC synchronous traction motor produces 150 kW maximum output and 266 Nm maximum torque, while its AC charging system requires approximately 12 hours for a full charge via a 6 kW, 30 A connection. The contrast between AC and DC charging times underscores that heavy-duty electric fleets will require dedicated high-power depot charging infrastructure to achieve commercial viability. Suppliers who co-develop powertrain and charging hardware as an integrated system solution have a structural advantage over component-only vendors in this segment.
Drive Analysis
Front-wheel drive (FWD) electric powertrain dominates with 43.3% due to lower cost and packaging simplicity.
In 2025, Front-Wheel Drive (FWD) Electric Powertrain held a dominant market position in the By Drive segment of the Electric Powertrain Market, with a 43.3% share. FWD electric powertrains eliminate the rear motor, inverter, and differential assembly, reducing per-vehicle drivetrain cost and total system weight. This architecture matches the cost sensitivity of the passenger-car segment, which commands 72.3% of total vehicle-category demand. Tier-1 suppliers focused on single-motor front-axle solutions serve the broadest slice of the addressable vehicle population at scale.
Rear-wheel drive (RWD) electric powertrains serve performance and rear-biased weight-distribution applications, including sports sedans and rear-engine commercial vans. RWD configurations allow motor placement close to the driven wheels, reducing drivetrain losses in high-torque acceleration events. This architecture is gaining traction in the premium passenger-car segment, where buyers prioritize dynamic performance over component cost. Suppliers offering compact, high-power-density rear motors with integrated single-speed reducers hold a defensible position as performance EV volumes grow.
All-wheel drive and four-wheel drive (AWD/4WD) electric powertrains deploy dual or quad motors to deliver maximum traction and dynamic control. This configuration commands the highest per-vehicle powertrain content value of the three drive types. AWD electric architectures are standard in premium SUVs and performance sedans where total system output exceeds 250 kW. Suppliers who master torque-vectoring software integrated with the motor controller layer rather than managing it as a separate electronic control unit gain a product differentiator that is difficult to replicate through hardware specification alone.
Key Market Segments
By Component
- Battery
- Electric Motor
- Power Electronics Controller
- Converter (DC–DC, AC–DC)
- Transmission
- On-Board Charger
By Vehicle Type (Powertrain Architecture)
- Battery Electric Vehicles (BEV)
- Hybrid Electric Vehicles (HEV)
- Plug-in Hybrid Electric Vehicles (PHEV)
- Fuel Cell Electric Vehicles (FCEV)
- 48V Mild Hybrid Vehicles (MHEV)
By Vehicle Category
- Passenger Cars
- Light Commercial Vehicles
- Heavy Commercial Vehicles (Trucks, Buses)
By Drive
- Front-Wheel Drive (FWD) Electric Powertrain
- Rear-Wheel Drive (RWD) Electric Powertrain
- All-Wheel / Four-Wheel Drive (AWD/4WD) Electric Powertrain
Regional Analysis
Asia Pacific Dominates the Electric Powertrain Market with a Market Share of 57.5%, Valued at USD 58.94 Billion
Asia Pacific accounts for 57.5% of the global electric powertrain market and generates USD 58.94 Billion in annual revenue. China anchors this dominance through its dual-credit NEV mandate, state-backed battery gigafactory investments, and the highest annual EV production volume of any single country. This concentration of manufacturing scale and policy pressure creates a self-reinforcing cost advantage that keeps Asia Pacific component pricing below any other regional supply base.
In March 2026, Valeo inaugurated a new manufacturing line in Pune, India, dedicated to producing highly integrated 3-in-1 e-Axle electric powertrain systems for Mahindra’s Born Electric vehicle platform. This move signals that global Tier-1 suppliers now treat India as a primary production destination rather than a secondary assembly hub. OEMs and investors who establish local powertrain manufacturing partnerships in India before 2028 will benefit from lower labor costs and qualify for government production-linked incentives unavailable to imported systems.
North America and Europe represent the two next-largest regional demand pools. DOE data shows the 2025 high-voltage battery cost for a midsize electric SUV reached $11,032, down $4,134 from the prior methodology, while the electric pickup battery cost reached $15,368, a reduction of $2,996. These cost reductions lower the purchase-price gap between electric and combustion equivalents in the truck and SUV segments that dominate North American sales. This reduction directly strengthens the commercial case for accelerating electric powertrain platform investment targeting North American fleet and retail buyers.
Key Regions and Countries
North America
- US
- Canada
Europe
- Germany
- France
- The UK
- Spain
- Italy
- Rest of Europe
Asia Pacific
- China
- Japan
- South Korea
- India
- Australia
- Rest of APAC
Latin America
- Brazil
- Mexico
- Rest of Latin America
Middle East and Africa
- GCC
- South Africa
- Rest of MEA
Market Dynamics
Market Opportunity Analysis - Underserved vehicle categories and emerging regional markets create entry points for focused powertrain suppliers.
Light commercial vehicles represent the most underserved vehicle category in the current electric powertrain investment cycle. The segment commands growing fleet operator interest, as demonstrated by the Toyota e-Palette platform’s design around a 90 kW DC fast-charge architecture for continuous urban operations. Mainstream Tier-1 suppliers have concentrated capital on passenger-car platforms capturing 72.3% of vehicle-category demand. This leaves light commercial fleet operators dependent on passenger-car powertrain derivatives that are not optimized for continuous duty cycles, creating a product gap a focused entrant can exploit.
India represents the most strategically underpenetrated major market within Asia Pacific’s dominant 57.5% regional share. Valeo’s March 2026 Pune manufacturing line for Mahindra confirms that the localization opportunity is real and already being captured by early movers. This means the window for establishing first-mover local manufacturing partnerships in India is narrowing rapidly. Investors and component suppliers that commit to Indian local-content programs before 2028 will qualify for production-linked incentives unavailable to import-dependent competitors.
The AWD/4WD drive segment remains underexploited relative to its per-unit revenue potential despite premium SUV demand growing across Asia Pacific and North America. Current AWD electric powertrain content sits above 250 kW per vehicle, generating the highest component value of any drive configuration. By contrast, capital and engineering resources are concentrated in the higher-volume FWD segment commanding 43.3% share. Suppliers who develop production-ready AWD systems with torque-vectoring software integration will access a low-competition, high-margin segment before mainstream Tier-1 investment shifts their attention.
The heavy commercial vehicle sub-segment, including buses and long-haul trucks, offers the largest per-unit powertrain content opportunity of any vehicle category. Existing heavy-duty electric powertrain solutions remain largely bespoke, with suppliers delivering custom motor and inverter assemblies rather than scalable platform products. This bespoke model inflates per-unit cost and limits volume scale. A supplier who develops a modular, multi-voltage heavy-duty e-Axle platform that serves both bus and truck body types from a shared hardware base would break the current cost floor and unlock fleet-electrification procurement contracts unavailable to custom-only vendors.
Technology and Innovation Landscape - Wireless charging, 800V architecture, and cost-engineered traction drive systems redefine competitive benchmarks.
Wireless inductive charging technology has moved from concept to measurable product performance. Porsche’s contactless electric-powertrain charging system achieved grid-to-battery energy-transfer efficiency of up to 90% in 2025, while the system delivers up to 11 kW, matching the power level of conventional wired AC charging. A 90% efficiency rating at 11 kW eliminates the primary technical objection to wireless charging as an energy-loss-intensive technology. Suppliers who commercialize production-ready inductive charging pads at this efficiency level will displace wired home-charging incumbents across premium residential and fleet depot segments.
High-voltage battery architecture is setting new benchmarks for charge speed. The 2025 Porsche Cayenne Electric accepts up to 390 kW at a compatible CCS charger supplying more than 850 V and 520 A, and a 10-minute charge adds up to 325 km of range. These figures establish a new consumer reference point for what fast charging should deliver. Powertrain and battery management suppliers that engineer systems around 800V-and-above architectures will be positioned as the standard-setters for the next generation of premium and performance EV platforms as consumer expectations migrate upward from this benchmark.
Operational efficiency data from production vehicles is reshaping buyer expectations at the fleet and policy level. The 2025 Porsche Taycan recorded combined electrical consumption of 16.7–19.1 kWh per 100 km, with direct operational emissions rated at 0 g CO₂/km. This consumption benchmark gives fleet procurement managers a defensible real-world efficiency figure for TCO modeling. Powertrain engineers who optimize motor-inverter co-design to reduce per-km energy draw below 17 kWh will deliver measurable fleet cost advantages that translate directly into long-term supply contract wins.
Traction-drive cost engineering is converging on government-defined targets that will determine which suppliers remain cost-competitive at scale. The U.S. electric-drive technical roadmap specifies a 2025 traction-drive target of 150 kW peak power for 30 seconds at 600 V with 50 kW/L power density, and the DOE set the system cost target at $4/kW for a 150 kW system, equating to approximately $600 total. Suppliers who reach this cost floor gain a decisive pricing advantage in the North American market where federal procurement and OEM sourcing decisions are increasingly benchmarked against DOE roadmap targets.
Drivers
Tightening tailpipe and fleet-average CO2 mandates represent the single largest active growth lever in the baseline 13.7% CAGR forecast, contributing an estimated +3.0% incremental effect. EU Regulation 2019/631 tightened fleet-average CO2 targets by 15% starting in 2025, forcing non-compliant OEMs to absorb per-gram penalties of roughly €95 per g/km per vehicle. China’s revised dual-credit NEV mandate raised minimum credit thresholds in 2024, while India’s CAFE-2 norms pushed fleet emission ceilings toward 113 g CO2/km. These parallel mandates are compelling OEMs to accelerate capital reallocation from ICE refresh cycles toward dedicated electric powertrain lines.
Battery pack cost declines contribute an estimated +2.4% to the CAGR, while Silicon Carbide inverter and 800V architecture adoption adds +2.1%. Electric powertrain gross margins already reach 18–22%, compared with 8–12% for legacy transmission systems, making the financial case for OEM platform transitions compelling. Purchase incentive and local-content programs add +1.7%, primarily across China, India, and North America, and OEM in-house e-Axle platform investment contributes a further +1.6% over the medium term. This compression of platform amortization cycles from a historical 7-year horizon to under 5 years reinforces urgency for Tier-1 suppliers to lock in long-term platform agreements now.
| Driver | (~) % Impact on CAGR Forecast | Geographic Relevance | Impact Timeline |
|---|---|---|---|
| Tightening Global Emission Mandates | +3.0% | Europe, China, India | Short term (2 years or less) |
| Battery Pack Cost Decline Below ICE Parity | +2.4% | Global | Short term (2 years or less) |
| Silicon Carbide Inverter & 800V Architecture Adoption | +2.1% | Global | Short term (2 years or less) |
| Purchase Incentive & Local-Content Programs | +1.7% | China, India, North America | Short term (2 years or less) |
| OEM In-House e-Axle Platform Investment | +1.6% | Asia-Pacific, Europe | Medium term (2 to 4 years) |
Restraints
Cross-border tariff escalation represents the most severe active restraint on current electric powertrain sales, applying an estimated -2.2% drag against the 13.7% baseline CAGR. The European Commission’s countervailing duties, phased in from July 2024 and finalized in November 2024, imposed additional tariffs ranging from 17% to 35.3% on Chinese-built battery electric vehicles above the existing 10% standard EU import duty, pushing combined levies as high as 45.3% on some brands. Chinese-built BEV share of the EU market fell from a peak of roughly 22% in 2024 to approximately 17% by early 2026, triggering reciprocal duties on European automotive and brandy imports.
Elevated financing and capital costs apply an estimated -1.6% drag, most acute in North America and Europe where rate environments have compressed OEM capital budgets. Critical mineral export restrictions from China and DRC supply chains contribute a further -1.3% restraint, directly affecting battery cell and motor magnet procurement. Subsidy rollback in mature markets adds -1.1%, while price premiums over ICE equivalents in India, Latin America, and Southeast Asia apply a final -0.9% restraint. OEMs and suppliers sourcing from Chinese manufacturing bases face landed-cost increases of 20–35 percentage points, forcing near-term margin compression of an estimated 4–6 percentage points on affected product lines.
| Restraint | (~) % Impact on CAGR Forecast | Geographic Relevance | Impact Timeline |
|---|---|---|---|
| Cross-Border EV Tariff Escalation | -2.2% | Europe, North America | Short term (2 years or less) |
| Elevated Financing & Capital Costs | -1.6% | Global, acute in North America/Europe | Short term (2 years or less) |
| Critical Mineral Export Restrictions | -1.3% | Global (China, DRC origin) | Short term (2 years or less) |
| Subsidy Rollback in Mature Markets | -1.1% | North America, Europe | Short term (2 years or less) |
| Price Premium Over ICE Equivalents | -0.9% | India, Latin America, Southeast Asia | Short term (2 years or less) |
Challenges
The shortage of power-electronics engineering talent constitutes the most consequential operational friction in the market, applying an estimated -1.1% drag on growth. Fewer than 3% of the existing global automotive engineering workforce carries hands-on exposure to wide-bandgap semiconductor design, per national skills-council workforce assessments, even as demand for silicon-carbide inverter and traction-motor specialists is projected to expand at roughly 25% annual hiring growth between 2025 and 2030. The United States alone faces a projected shortfall of approximately 35,000 trained EV powertrain technicians by 2028, while power-electronics engineering job postings in Bengaluru exceeded 700 in a single month during 2025.
Fast-charging grid capacity strain applies a -0.9% drag, while battery end-of-life recovery complexity adds -0.8% friction, most acute in Europe where regulatory recovery mandates are already active. Rural and off-highway charging access gaps contribute -0.7%, directly limiting powertrain adoption in emerging markets where distribution infrastructure remains underdeveloped. Motor and e-Axle architecture fragmentation across incompatible platform standards applies the remaining -0.6% friction. Time-to-hire for critical inverter and e-axle design roles now exceeds 6 months, inflating engineering labor costs by an estimated 15–20% and forcing Tier-1 suppliers to build internal reskilling academies rather than relying on external recruitment pipelines.
| Challenge | (~) % CAGR Friction Drag | Geographic Relevance | Mitigation Horizon |
|---|---|---|---|
| Power Electronics Talent Deficit | -1.1% | Global, acute in India/USA | Medium term (2 to 4 years) |
| Fast-Charging Grid Capacity Strain | -0.9% | Global | Medium term (2 to 4 years) |
| Battery End-of-Life Recovery Complexity | -0.8% | Europe | Long term (4 years or more) |
| Rural/Off-Highway Charging Access Gap | -0.7% | Emerging markets, off-highway segments | Medium term (2 to 4 years) |
| Motor/e-Axle Architecture Fragmentation | -0.6% | Global | Medium term (2 to 4 years) |
Opportunities
Electrification of off-highway and industrial equipment, spanning construction, mining, and agricultural machinery, represents the most significant untapped strategic upside in the electric powertrain sector, offering an estimated +1.8% potential CAGR upside above the 13.7% baseline. Mainstream Tier-1 suppliers have left this segment nominally addressed because passenger-vehicle e-Axle architectures are not optimized for off-highway duty cycles and torque requirements. Ruggedized industrial powertrain variants could command gross margins of 25–30%, roughly 7–10 percentage points above standard passenger e-Axle margins, per equipment-manufacturer capital-markets disclosures.
Tariff-driven localized component manufacturing offers +1.4% potential CAGR upside as OEMs seek to reduce exposure to cross-border import levies through regional supply chains. Second-life battery storage monetization adds +1.1% upside as retired vehicle packs enter stationary energy storage markets at near-zero acquisition cost. Software-defined powertrain subscription models create +0.9% long-term upside by converting one-time hardware revenue into recurring software income. Vehicle-to-grid bidirectional energy monetization contributes a final +0.7% opportunity, with non-road mobile machinery emission standards in several jurisdictions compressing the diesel-fleet compliance runway to under 4 years, accelerating off-highway adoption timelines.
| Opportunity | (~) % Potential CAGR Upside | Geographic Relevance | Execution Window |
|---|---|---|---|
| Off-Highway & Industrial Equipment Electrification | +1.8% | North America, Europe, Asia-Pacific | Medium term (2 to 4 years) |
| Tariff-Driven Localized Component Manufacturing | +1.4% | North America, Europe | Medium term (2 to 4 years) |
| Second-Life Battery Storage Monetization | +1.1% | Global | Medium term (2 to 4 years) |
| Software-Defined Powertrain Subscription Models | +0.9% | Global | Long term (4 years or more) |
| Vehicle-to-Grid Bidirectional Energy Monetization | +0.7% | Europe, Asia-Pacific | Long term (4 years or more) |
Key Company Insights
BorgWarner Inc. has built a structural advantage through its diversified electric drive portfolio spanning motors, inverters, and thermal management systems across passenger car and commercial vehicle segments. In February 2026, BorgWarner secured its first global production award for a 48V Electric Cross Differential (eXD) in China, expanding its hybrid and electric vehicle propulsion lineup. This China award positions BorgWarner inside the world’s largest EV production base with a locally awarded platform contract, insulating it from tariff-driven cost pressures that affect importers.
Robert Bosch GmbH holds a competitive position through its integrated e-Axle systems and power electronics, supplied to a broad base of global OEM platforms. DOE data shows 2025 compact-car BEV battery costs reached $9,185, down $1,810 from prior estimates, while midsize electric car battery costs reached $9,929, a reduction of $1,414. These cost reductions strengthen the commercial viability of the passenger-car BEV segment that Bosch’s drivetrain and charging electronics serve. Bosch’s scale across multiple OEM relationships means it captures volume upside as falling battery costs drive faster consumer adoption across vehicle classes.
Key Players
- BorgWarner Inc.
- Robert Bosch GmbH
- Mitsubishi Electric Corporation
- Magna International Inc.
- ZF Friedrichshafen AG
- Valeo SA
- Continental AG
- Schaeffler AG
- Nidec Corporation
- Marelli Holdings Co., Ltd.
- DENSO Corporation
- Dana Incorporated / DANA TM4
- Hyundai Mobis
- Tesla, Inc.
- CATL / LG Energy Solution
Recent Developments
- April 2025: Leapmotor and FAW Group signed a strategic cooperation agreement to jointly develop Hongqi-branded battery electric and range-extended vehicles using Leapmotor’s electric powertrain platform, with production planned for 2026.
- September 2025: ZF showcased its next-generation electric powertrain technologies, including advanced e-drive and integrated propulsion solutions, at IAA Mobility 2025 for passenger and commercial vehicle applications.
Geopolitical Impact Analysis
Trade policy shifts are directly restructuring electric powertrain supply chains. As reported by WTO trade monitoring data, the European Commission’s countervailing duties on Chinese-built BEVs reached as high as 45.3% on some brands by late 2024, while China’s Ministry of Commerce imposed reciprocal duties on European automotive imports. These levies force OEMs to reroute motor, inverter, and battery cell sourcing away from Chinese facilities, with UNCTAD estimating that supply chain rerouting events of this scale add an average 8–12% to component landed cost for affected SKUs.
Critical mineral supply concentration amplifies geopolitical pricing risk for battery-dependent powertrain producers. Data from the IEA indicates that China controls refining capacity for more than 60% of global lithium and 70% of global cobalt processing, both essential to electric motor magnets and battery cathode production. World Bank commodity tracking shows lithium carbonate prices experienced a peak-to-trough decline exceeding 80% between 2022 and 2025, illustrating the price volatility that export control policy changes can reintroduce at short notice. Powertrain manufacturers who secure long-term offtake agreements outside Chinese refining networks will reduce per-unit raw material cost exposure when the next export restriction cycle activates.
Report Scope
| Report Features | Description |
|---|---|
| Market Value (2025) | USD 102.5 Billion |
| Forecast Revenue (2035) | USD 371.3 Billion |
| CAGR (2026-2035) | 13.7% |
| Base Year for Estimation | 2025 |
| Historic Period | 2020-2024 |
| Forecast Period | 2026-2035 |
| Report Coverage | Revenue Forecast, Market Dynamics, Market Opportunity Analysis, Technology and Innovation Landscape, Competitive Landscape, Recent Developments |
| Segments Covered | By Component (Battery, Electric Motor, Power Electronics Controller, Converter (DC–DC, AC–DC), Transmission, On-Board Charger), By Vehicle Type (BEV, HEV, PHEV, FCEV, 48V MHEV), By Vehicle Category (Passenger Cars, Light Commercial Vehicles, Heavy Commercial Vehicles), By Drive (FWD, RWD, AWD/4WD) |
| Regional Analysis | North America (US and Canada), Europe (Germany, France, The UK, Spain, Italy, and Rest of Europe), Asia Pacific (China, Japan, South Korea, India, Australia, and Rest of APAC), Latin America (Brazil, Mexico, and Rest of Latin America), Middle East and Africa (GCC, South Africa, and Rest of MEA) |
| Competitive Landscape | BorgWarner Inc., Robert Bosch GmbH, Mitsubishi Electric Corporation, Magna International Inc., ZF Friedrichshafen AG, Valeo SA, Continental AG, Schaeffler AG, Nidec Corporation, Marelli Holdings Co., Ltd., DENSO Corporation, Dana Incorporated / DANA TM4, Hyundai Mobis, Tesla Inc., CATL / LG Energy Solution |
| Customization Scope | Customization for segments, region / country-level will be provided. Additional customization can be done based on requirements. |
| Purchase Options | We have three licenses to opt for: Single User License | Multi-User License (Up to 5 Users) | Corporate Use License (Unlimited User and Printable PDF) |





































