


Report Overview
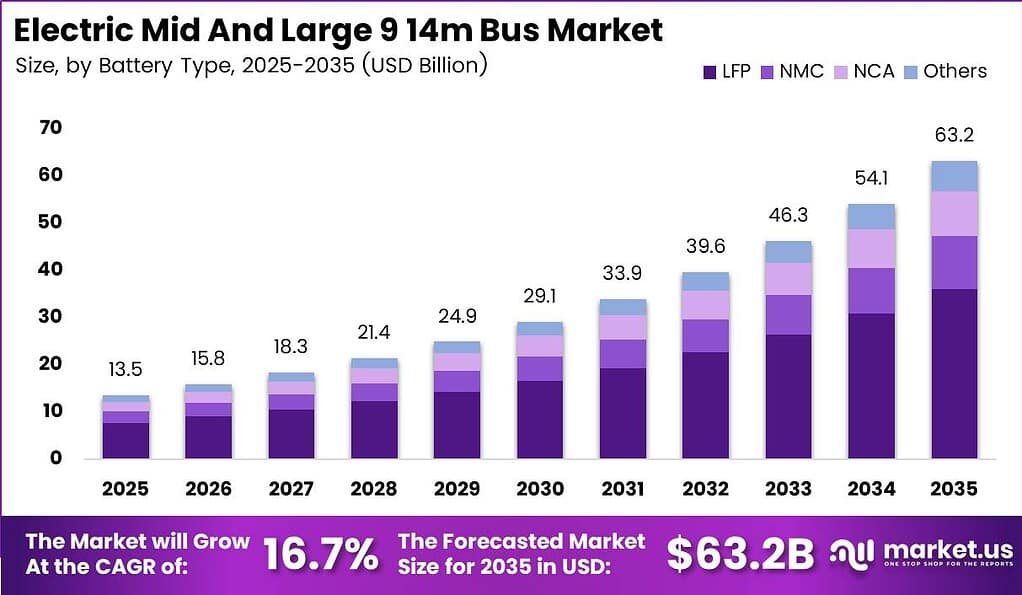
Global Electric Mid And Large 9-14m Bus Market size is expected to be worth around USD 63.2 Billion by 2035 from USD 13.5 Billion in 2025, growing at a CAGR of 16.7% during the forecast period 2026 to 2035. This trajectory places electric buses among the fastest expanding categories within commercial road transport. Transit agencies and coach operators are converting aging diesel fleets into zero emission platforms.
The Electric Mid And Large 9-14m Bus Market covers battery electric vehicles built for city transit, coach, school, and midi bus applications. These vehicles combine large format battery packs with structural platforms suited for high daily mileage. Therefore, the market spans battery type, capacity, configuration, application, range, seating, and power output as distinct commercial specification layers.
Key Takeaways
- Global market size is expected to reach USD 63.2 Billion by 2035, up from USD 13.5 Billion in 2025.
- The market is projected to expand at a CAGR of 16.7% between 2026 and 2035.
- LFP batteries dominate the By Battery Type segment with a 57.00% share.
- Buses with capacity up to 400 kWh lead the By Battery Capacity segment with a 58.00% share.
- Light Duty configurations hold a 64.00% share of the By Configuration segment.
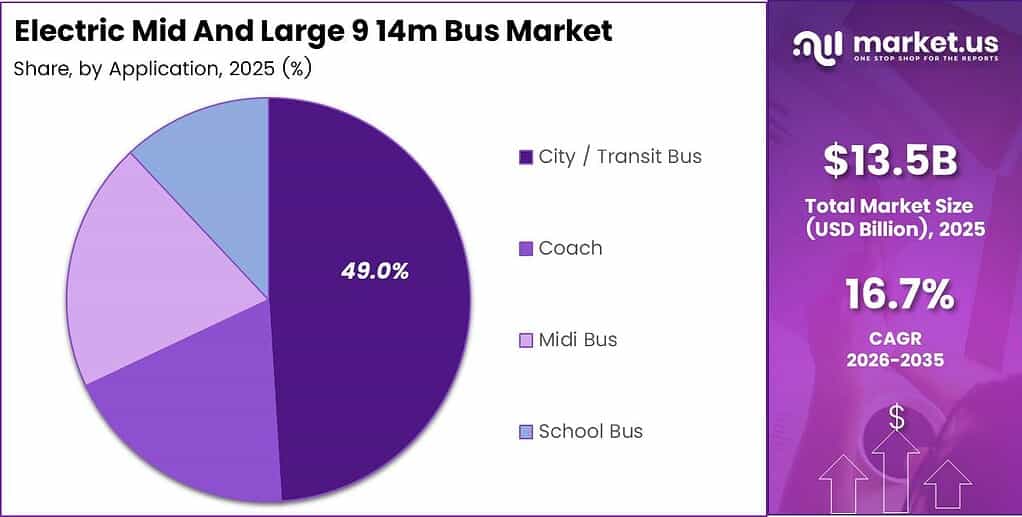
- City and Transit Bus applications account for 49.00% of the By Application segment.
- Buses seating up to 40 passengers dominate the By Seating Capacity segment with a 65.00% share.
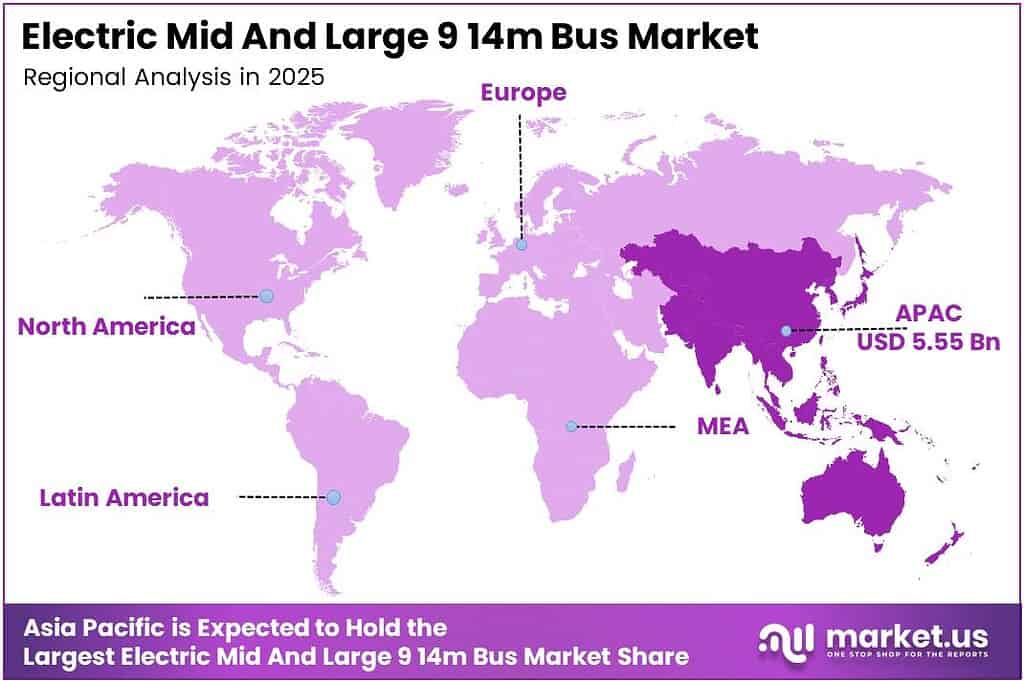
- Asia Pacific leads the global market with a 41.00% share, valued at USD 5.55 Billion.
Government fleet electrification programs are directly shaping deployment economics across emerging transit markets. Based on UITP data, a 12 metre AC electric bus carries an acquisition cost of approximately ₹1.9 crore, offset by subsidies of ₹55 lakh under FAME-II and ₹20 lakh from the Maharashtra state government. This layered funding structure lowers the effective entry cost for public transit operators. Consequently, state transport undertakings can commit to fleet conversion without absorbing the full capital burden upfront.
Operating subsidies are reshaping the total cost equation once buses enter service. Figures from a 2025 BEST financial analysis show that subsidies reduced electric bus operating cost from ₹83.92 per km to ₹66.20 per km. This reduction directly narrows the cost gap against diesel operations on a per kilometre basis. This signals that public funding is becoming a structural lever for electric bus adoption rather than a temporary incentive.
Large scale public procurement is reinforcing this government driven demand pattern. In December 2025, Singapore’s Land Transport Authority awarded contracts for 660 electric buses to BYD, Yutong, Zhongtong, and ST Engineering-CRRC. As a result, manufacturers gain multi year production visibility tied directly to public transit budgets. Rising end use demand from urban transit authorities is now feeding directly into higher production volumes across major OEM platforms.
Battery Type Analysis
LFP dominates with 57.0% due to lower cost and thermal stability.
In 2025, LFP held a dominant market position in the By Battery Type segment of Electric Mid And Large 9-14m Bus Market, with a 57.0% share. UNIDO manufacturing output data shows LFP cell production capacity expanding across Chinese battery plants supplying commercial vehicle OEMs. This capacity growth keeps unit cell pricing lower than nickel based chemistries. Consequently, bus manufacturers standardizing on LFP can offer transit agencies more predictable acquisition pricing.
NMC batteries serve operators prioritizing energy density over upfront cost. Corporate filings from battery pack suppliers indicate NMC packs deliver higher watt hours per kilogram than LFP equivalents. This density advantage suits routes with limited depot charging windows. However, NMC input costs remain tied to nickel and cobalt price volatility tracked through London Metal Exchange filings, which limits its share among budget constrained fleet buyers.
NCA and Others chemistries occupy the remaining share of the segment. NCA is used mainly in premium coach platforms requiring extended single charge range. Others includes emerging sodium ion and solid state chemistries under early stage regulatory filing review by national standards bodies. Together, these chemistries hold the remaining share and represent the segment’s longer term technology transition pathway.
Battery Capacity Analysis
Up to 400 kWh dominates with 58.0% due to lower vehicle weight and cost.
In 2025, Up to 400 kWh held a dominant market position in the By Battery Capacity segment of Electric Mid And Large 9-14m Bus Market, with a 58.0% share. National statistical office filings from China show sub 400 kWh packs remain standard on urban transit routes under 250 kilometres daily. This range profile matches most city transit duty cycles without oversizing the pack. Therefore, operators reduce upfront battery cost while still meeting daily route demand.
Above 400 kWh packs serve coach and intercity routes requiring extended range. ITC Trade Map export data shows rising shipment volumes of large format packs to European coach manufacturers in 2025. This shift reflects growing demand for single charge routes exceeding 400 kilometres. This creates a distinct high capacity product tier separate from standard urban transit specification.
Capacity selection increasingly tracks route profile rather than a single industry standard. Regulatory filings on vehicle weight limits in the European Union cap gross vehicle weight, which constrains how large a pack manufacturers can fit before losing payload capacity. This constraint keeps most city fleets anchored below the 400 kWh threshold. As a result, capacity segmentation will likely stay bifurcated between urban and coach use cases through the forecast period.
Configuration Analysis
Light Duty dominates with 64.0% due to lower weight and urban route fit.
In 2025, Light Duty held a dominant market position in the By Configuration segment of Electric Mid And Large 9-14m Bus Market, with a 64.0% share. World Bank urban transit indicators show most municipal bus fleets operate on routes under 12 metres with moderate passenger load. Light Duty platforms match this profile with lower curb weight and better energy efficiency. Consequently, transit agencies favor Light Duty units to maximize range per kWh of installed battery.
Heavy Duty configurations serve high frequency, high passenger density corridors. Customs database records show Heavy Duty chassis shipments concentrated in metro corridor deployments across Chinese and Indian cities. These platforms carry reinforced structures to handle continuous stop and go duty cycles. This means Heavy Duty demand tracks directly with bus rapid transit corridor expansion rather than general fleet renewal.
Coach configurations round out the segment with a distinct commercial use case. Industry trade association benchmarks classify Coach units separately due to their intercity and charter service application. Coach platforms typically carry larger battery packs and premium seating layouts. Coach configuration therefore holds the remaining share of the segment, driven by tourism and intercity travel demand rather than municipal transit budgets.
Application Analysis
City / Transit Bus dominates with 49.0% due to municipal fleet electrification mandates.
In 2025, City / Transit Bus held a dominant market position in the By Application segment of Electric Mid And Large 9-14m Bus Market, with a 49.0% share. UN Comtrade unit shipment data shows transit bus exports rising fastest among all applications tracked under commercial vehicle codes in 2025. Municipal procurement mandates directly drive this volume. This reflects the strongest and most immediate demand channel across the entire market.
Coach applications serve intercity and charter operators seeking range and comfort. ITC Trade Map figures show coach unit trade growing as European operators replace diesel intercity fleets. Coach buyers prioritize seating comfort and extended single charge range over route frequency. This creates a distinct purchasing cycle tied to tourism recovery and cross border travel demand.
Midi Bus units serve lower density routes and last mile connections. Regulatory filings from transit authorities in Southeast Asia show midi bus deployment expanding on feeder routes connecting to metro rail stations. This deployment pattern favors smaller vehicles requiring lower charging infrastructure investment. This signals midi bus demand will grow alongside metro rail network expansion in developing transit markets.
School Bus applications remain a smaller but steady portion of the segment. National statistical office data from the United States shows early stage electric school bus pilot programs expanding under state clean transportation grants. Adoption remains grant dependent rather than fleet wide. This structural pattern positions School Bus as the segment’s slowest but most regulation sensitive growth pocket.
Range Analysis
Up to 300 Miles dominates with 35.0% due to matching daily urban route length.
In 2025, Up to 300 Miles held a dominant market position in the By Range segment of Electric Mid And Large 9-14m Bus Market, with a 35.0% share. IEA transport electrification tracking shows most urban transit routes worldwide average well under 300 miles of daily coverage. This range window avoids oversized battery packs on short duty cycles. Consequently, transit operators favor this range tier to control both vehicle cost and charging infrastructure needs.
Above 300 Miles buses target coach, intercity, and long feeder routes. Corporate annual reports from major OEMs show growing order backlogs for extended range platforms serving cross border coach service. These buses require larger battery packs and higher power charging infrastructure. This means the Above 300 Miles tier commands a price premium tied directly to route length requirements.
Range selection continues to track duty cycle rather than a single technology standard. Patent filings tracked across major battery manufacturers show accelerating research into higher energy density cells aimed at closing the range gap between tiers. As a result, the boundary between standard and extended range buses may narrow as pack energy density improves through the forecast period.
Seating Capacity Analysis
Up to 40 Seats dominates with 65.0% due to standard urban transit vehicle sizing.
In 2025, Up to 40 Seats held a dominant market position in the By Seating Capacity segment of Electric Mid And Large 9-14m Bus Market, with a 65.0% share. National statistical office fleet registries show this seating class as the standard configuration across most municipal transit authorities. This sizing balances passenger throughput against vehicle weight and battery load. Therefore, most new transit tenders default to this configuration for cost efficiency.
40 to 70 Seats buses serve higher density corridors and articulated route segments. UNIDO manufacturing statistics show rising production of mid capacity chassis platforms among Chinese and European bus builders. These units carry higher passenger throughput without the full structural complexity of articulated buses. This signals growing demand from cities upgrading corridor capacity without shifting to articulated bus rapid transit systems.
Above 70 Seats buses, primarily articulated units, address the highest demand corridors. Regulatory filings from transit authorities show articulated electric bus pilots expanding across major metro corridors in Europe and Australia. These platforms require the highest power output and largest battery packs in the segment. Above 70 Seats units therefore hold the remaining share, reserved for the busiest transit corridors globally.
Power Output Analysis
Up to 250 kW dominates with 54.0% due to matching standard urban motor demand.
In 2025, Up to 250 kW held a dominant market position in the By Power Output segment of Electric Mid And Large 9-14m Bus Market, with a 54.0% share. UNIDO industrial output data shows most standard transit bus motors sized within this power band across major manufacturing hubs. This output level meets acceleration and gradeability needs for typical urban routes. Consequently, it remains the default drivetrain specification for municipal tenders.
Above 250 kW platforms serve heavier vehicles and steeper route gradients. Corporate filings from CRRC and BYD show newer coach and articulated bus platforms specifying drivetrains above this threshold to support higher gross vehicle weight. In September 2025, BYD introduced its third generation e-Bus Platform 3.0, featuring a 1,000 V high voltage architecture built for higher output drivetrains. This shift toward higher voltage architecture points to rising power demand across premium bus platforms.
Key Market Segments
By Battery Type
- LFP
- NMC
- NCA
- Others
By Battery Capacity
- Up to 400 kWh
- Above 400 kWh
By Configuration
- Light Duty
- Heavy Duty
- Coach
By Application
- City / Transit Bus
- Coach
- Midi Bus
- School Bus
By Range
- Up to 300 Miles
- Above 300 Miles
By Seating Capacity
- Up to 40 Seats
- 40 to 70 Seats
- Above 70 Seats
By Power Output
- Up to 250 kW
- Above 250 kW
Regional Analysis
Asia Pacific Dominates the Electric Mid And Large 9-14m Bus Market with a Market Share of 41.0%, Valued at USD 5.55 Billion
Asia Pacific leads global demand on the strength of large scale municipal fleet electrification programs. Pune’s e-bus depots run on 1,250 kVA electrical systems paired with chargers ranging from 80 kW AC to 180 kW DC, with individual depots supporting up to 115 buses. This depot infrastructure model demonstrates how Indian cities are scaling charging capacity ahead of fleet delivery. Consequently, Asia Pacific manufacturers benefit from concentrated, government backed deployment pipelines unmatched elsewhere.
China and India anchor this regional lead through both manufacturing scale and procurement volume. Domestic OEMs including Yutong, BYD, and Zhongtong supply the majority of vehicles entering regional transit fleets. This manufacturing proximity shortens delivery timelines against imported alternatives from European or North American builders. This reflects a structural advantage that keeps Asia Pacific ahead on both production and deployment metrics through the forecast period.
Key Regions and Countries
North America
- US
- Canada
Europe
- Germany
- France
- The UK
- Spain
- Italy
- Rest of Europe
Asia Pacific
- China
- Japan
- South Korea
- India
- Australia
- Rest of APAC
Latin America
- Brazil
- Mexico
- Rest of Latin America
Middle East and Africa
- GCC
- South Africa
- Rest of MEA
Market Dynamics
Market Opportunity Analysis - Coach electrification and underweighted capacity tiers offer clear entry points for new players
Coach applications remain the second largest but least saturated application tier behind City / Transit Bus. Operators here still rely heavily on diesel intercity fleets outside core European corridors. This means new entrants offering extended range coach platforms can compete before incumbent OEMs establish dominant service networks in this application.
Above 400 kWh battery capacity remains structurally underweighted despite serving the fastest growing coach and intercity use cases. This creates room for battery suppliers and chassis makers to capture share before large format packs become standardized across major OEM platforms. Early entrants can secure long term supply agreements ahead of broader adoption.
Heavy Duty configuration holds a smaller share than Light Duty despite serving high frequency bus rapid transit corridors. This gap signals an entry point for manufacturers focused on reinforced platforms built for continuous stop and go duty cycles. Instead of competing on general fleet volume, new players can target this narrower operational niche directly.
Regions outside Asia Pacific still trail its 41.0% share despite comparable municipal transit demand. By contrast, transit agencies in Latin America and the Middle East are only beginning large scale fleet conversion programs. This gap gives OEMs without existing Asia Pacific manufacturing scale a path to build regional supply relationships early.
Technology and Innovation Landscape - Battery recycling, high voltage architecture, and range engineering redefine competitive edges.
Battery end of life planning is becoming a core design input rather than an afterthought. MAN reported that up to 96% of its new electric bus battery can be recycled, with the battery designed to cover 1 million km over a service life of up to 14 years. This durability figure directly lowers total lifecycle cost for fleet buyers. This means recyclability is now a measurable procurement criterion, not just a sustainability claim.
Battery and charging specifications are advancing together as manufacturers chase longer single charge coverage. The 12.11 metre VinFast EB 12 pairs a 422 kWh LFP battery with maximum DC charging power of 140 kW. This combination targets operators who need both range and fast turnaround charging on tight route schedules. This creates pressure on rival OEMs to match charging speed alongside pack size.
High voltage architecture is emerging as the next competitive differentiator on large chassis platforms. CRRC’s 12 metre EU12C uses an 800 V architecture paired with a 441 kWh battery and 350 kW DC charging. This voltage jump reduces charging time relative to standard architectures used across most current fleets. This signals a coming platform shift among premium OEMs competing for high utilization transit contracts.
Operational data from live deployments is now shaping design priorities as much as lab specifications. Santiago’s e-buses averaged 1.3 kWh per kilometre and cut energy costs by 67% compared with diesel buses, per a March 2025 UITP case study. This real world efficiency data validates route level cost modeling for prospective buyers. As a result, operators increasingly demand deployment case data before committing to large fleet orders.
Drivers
Statutory clean fleet deadlines are turning bus procurement into a compliance obligation rather than a discretionary purchase. Delhi will permit only electric, CNG, or BS-VI diesel buses to enter the city from November 1, 2026, a pattern echoed in European Union quotas and China’s new energy bus subsidies. This mandate driven demand is the largest single contributor to the market’s 16.7% baseline growth rate.
These mandates are compressing municipal tender cycles from multi year pilots into single budget approvals. OEMs including BYD and Yutong are shifting toward gross cost contract manufacturing, lowering per unit fixed cost absorption by 8% to 12%. This shift means transit agencies now finance fleets against guaranteed availability payments instead of farebox revenue risk.
| Driver | (~) % Impact on CAGR Forecast | Geographic Relevance | Impact Timeline |
|---|---|---|---|
| Government Zero-Emission Procurement Mandates | +4.2% | Global, led by EU, China, India | Short term (2 years or less) |
| Declining Lithium-Ion Battery Pack Pricing | +3.6% | Global | Medium term (2 to 4 years) |
| Total-Cost-of-Ownership Parity on Urban Routes | +3.0% | Asia-Pacific, Europe, North America | Short term (2 years or less) |
| Public Transit Depot Electrification Rollouts | +2.5% | China, Europe, India, Latin America | Medium term (2 to 4 years) |
| OEM Platform Standardization and Scale Manufacturing | +2.1% | China, Europe | Long term (4 years or more) |
Restraints
A standard 9 to 14 metre battery electric bus still costs roughly double a comparable diesel unit even as operating economics converge. World Bank lending indices show elevated borrowing costs across India, Southeast Asia, and Latin America, pushing debt service ratios past internal thresholds at several state transport undertakings. This gap directly restrains fleet financing speed in cost sensitive markets.
Order books show unit deliveries lagging tender awards by 12 to 18 months as agencies await grant disbursement under schemes such as PM-eBus Sewa. This delay pushes capital spending into later budget cycles and widens working capital gaps for smaller OEMs. As a result, manufacturers face margin compression of 150 to 250 basis points while inventory awaits confirmed financing.
| Restraint | (~) % Impact on CAGR Forecast | Geographic Relevance | Impact Timeline |
|---|---|---|---|
| High Upfront Capital Cost Barrier for Transit Agencies | -2.4% | India, Southeast Asia, Latin America | Short term (2 years or less) |
| Elevated Interest Rate Environment Constraining Fleet Financing | -1.8% | Global, acute in emerging markets | Short term (2 years or less) |
| Restrictive Import Tariffs on Battery Cells and EV Components | -1.5% | United States, European Union, India | Medium term (2 to 4 years) |
| Grid Interconnection Moratoria in Saturated Urban Feeders | -1.3% | North America, select EU metros | Short term (2 years or less) |
| Litigation-Delayed Diesel-Bus Displacement Bans | -0.9% | United States, select EU states | Medium term (2 to 4 years) |
Challenges
Most legacy bus depots were built for diesel refueling, not the multi megawatt draw needed to charge 40 to 60 vehicle fleets overnight. IEA electrification tracking shows distribution feeder upgrade requests in secondary Indian and Southeast Asian cities queued behind residential and industrial demand. Utility filings show average interconnection waits of 18 to 30 months, directly delaying full depot electrification.
This bottleneck forces operators into partial electrification, typically 30% to 40% of a depot’s planned bus count, while awaiting substation capacity. This means agencies must adopt staged procurement tied to interconnection milestones and on-site battery buffering. UITP has flagged this friction as a recurring planning issue independent of procurement mandates or financing constraints already covered elsewhere.
| Challenge | (~) % CAGR Friction Drag | Geographic Relevance | Mitigation Horizon |
|---|---|---|---|
| Charging Depot Grid Upgrade Backlogs | -1.6% | India, Southeast Asia, Latin America | Medium term (2 to 4 years) |
| Battery Cell Supply Concentration Risk | -1.4% | Global, sourcing concentrated in China | Long term (4 years or more) |
| Skilled EV Technician Talent Shortage | -1.2% | Global, acute in North America, Europe | Medium term (2 to 4 years) |
| Cold-Climate Route Range Variability | -0.8% | North America, Northern Europe | Medium term (2 to 4 years) |
| Fragmented Charging Connector Standards | -0.7% | Global | Long term (4 years or more) |
Opportunities
Few transit markets have moved past pilot stage battery leasing into standardized financing products, leaving most budget constrained operators unaddressed. Battery packs can represent 35% to 40% of total vehicle cost, so separating the pack from the chassis sale could lower upfront outlays by 25% to 30%. This structural gap represents largely uncaptured commercial white space.
World Bank public-private partnership frameworks show this model could qualify smaller Latin American and Southeast Asian operators for financing previously blocked by debt service thresholds. OEMs and financiers capturing this structure could expand blended margins by 300 to 400 basis points through residual value retention. This means early movers in battery leasing gain a durable pricing advantage over competitors.
| Opportunity | (~) % Potential CAGR Upside | Geographic Relevance | Execution Window |
|---|---|---|---|
| Battery-as-a-Service and Route-as-a-Service Financing | +2.6% | Latin America, Southeast Asia, emerging EU | Medium term (2 to 4 years) |
| Untapped Intercity and Coach Segment Electrification | +2.4% | India, Southeast Asia, Latin America | Medium term (2 to 4 years) |
| Second-Life Battery Repurposing and Storage Monetization | +2.2% | North America, Europe, pilot China | Long term (4 years or more) |
| Cross-Border OEM and Component Roll-Up M&A | +1.8% | Global, concentrated China-Europe | Long term (4 years or more) |
| Vehicle-to-Grid Depot Revenue Stacking | +1.6% | Europe, North America, pilot Japan | Long term (4 years or more) |
Key Company Insights
Zhengzhou Yutong Bus Co., Ltd. holds a manufacturing edge through continuous platform innovation. The 2025 Yutong IC12E measures 12.66 metres and pairs a 466 kWh battery with a stated range of up to 675 km. However, this range leadership depends on sustained cell supply, leaving Yutong exposed if battery input costs rise faster than rivals absorb them.
BYD Company Ltd. reinforced its scale advantage by remaining the world’s largest electric bus exporter for a third consecutive year, exporting 4,234 electric buses during 2025. Its 2025 B12.b HF platform offers batteries up to 495 kWh and charging up to 500 kW by pantograph. This export scale and charging flexibility give BYD a durable lead in cross border fleet tenders.
Key Players
- Zhengzhou Yutong Bus Co., Ltd.
- BYD Company Ltd.
- CRRC Corporation Limited (CRRC Electric Vehicle)
- Xiamen King Long United Automotive Industry
- Zhongtong Bus Holding Co., Ltd.
- Solaris Bus & Coach sp. z o.o. (CAF)
- VDL Bus & Coach NV
- AB Volvo (Volvo Buses)
- Daimler Buses (Mercedes-Benz eCitaro)
- MAN Truck & Bus SE
- New Flyer (NFI Group)
- Anhui Ankai Automobile Co., Ltd.
- Higer Bus Company Limited
- Tata Motors Limited
- Zhejiang Geely Holding Group
Geopolitical Impact Analysis
Trade friction is directly reshaping battery cell sourcing for bus manufacturers. According to the WTO, tariffs on imported EV battery components in several major markets now range between 10% and 25%, raising landed pack costs for OEMs sourcing cells outside domestic supply chains. Data from the IEA shows lithium carbonate prices remain volatile, complicating fixed price contracts for large format bus battery packs. This means manufacturers face margin pressure tied directly to cell origin and trade policy.
Shipping and logistics disruption is adding further cost pressure to component delivery schedules. As reported by the World Shipping Council, average container transit delays on key Asia to Europe routes have run 5 to 10 days above pre disruption baselines during periods of Red Sea rerouting. UNCTAD data shows freight rates on affected lanes rising by double digit percentages during peak disruption windows. This creates scheduling risk for OEMs coordinating chassis and battery pack shipments across multiple countries.
Recent Developments
- February 2025: Volvo Buses received its first order from Go-Ahead London for 25 Volvo BZL Electric buses, marking the operator’s first purchase of Volvo battery electric city buses.
- September 2025: Volvo Buses launched the Volvo BZR Electric coach chassis with up to 720 kWh battery capacity and a driving range of up to 700 km for medium and large coach applications.
- September 2025: Volvo Buses and MCV opened a dedicated manufacturing facility in Egypt to produce complete electric buses for European markets, expanding production capacity for zero emission buses.
- June 2026: Volvo Buses unveiled Australia’s first locally built Volvo BZL Electric articulated bus, expanding its electric bus portfolio for high capacity urban transit.
Report Scope
| Report Features | Description |
|---|---|
| Market Value (2025) | USD 13.5 Billion |
| Forecast Revenue (2035) | USD 63.2 Billion |
| CAGR (2026-2035) | 16.7% |
| Base Year for Estimation | 2025 |
| Historic Period | 2020-2024 |
| Forecast Period | 2026-2035 |
| Report Coverage | Revenue Forecast, Market Dynamics, Market Opportunity Analysis, Technology and Innovation Landscape, Competitive Landscape, Recent Developments |
| Segments Covered | By Battery Type (LFP, NMC, NCA, Others), By Battery Capacity (Up to 400 kWh, Above 400 kWh), By Configuration (Light Duty, Heavy Duty, Coach), By Application (City / Transit Bus, Coach, Midi Bus, School Bus), By Range (Up to 300 Miles, Above 300 Miles), By Seating Capacity (Up to 40 Seats, 40-70 Seats, Above 70 Seats), By Power Output (Up to 250 kW, Above 250 kW) |
| Regional Analysis | North America (US and Canada), Europe (Germany, France, The UK, Spain, Italy, and Rest of Europe), Asia Pacific (China, Japan, South Korea, India, Australia, and Rest of APAC), Latin America (Brazil, Mexico, and Rest of Latin America), Middle East and Africa (GCC, South Africa, and Rest of MEA) |
| Competitive Landscape | Zhengzhou Yutong Bus Co., Ltd., BYD Company Ltd., CRRC Corporation Limited (CRRC Electric Vehicle), Xiamen King Long United Automotive Industry, Zhongtong Bus Holding Co., Ltd., Solaris Bus & Coach sp. z o.o. (CAF), VDL Bus & Coach NV, AB Volvo (Volvo Buses), Daimler Buses (Mercedes-Benz eCitaro), MAN Truck & Bus SE, New Flyer (NFI Group), Anhui Ankai Automobile Co., Ltd., Higer Bus Company Limited, Tata Motors Limited, Zhejiang Geely Holding Group |
| Customization Scope | Customization for segments, region / country-level will be provided. Additional customization can be done based on requirements. |
| Purchase Options | We have three licenses to opt for: Single User License | Multi-User License (Up to 5 Users) | Corporate Use License (Unlimited User and Printable PDF) |





































