


Report Overview
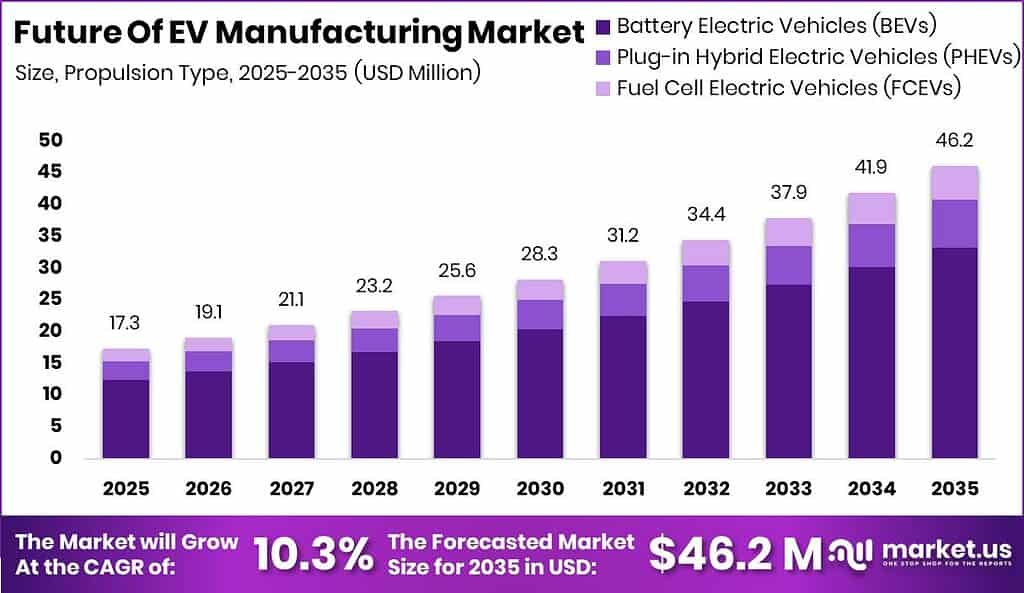
Global Future of EV Manufacturing Market size is expected to be worth around 46.2 Million units by 2035 from 17.3 Million units in 2025, growing at a CAGR of 10.3% during the forecast period 2026 to 2035. This trajectory signals that electric vehicle assembly is now the primary industrial battleground for automakers globally. Manufacturers that delay capacity commitment will cede structural ground to faster movers.
The Future of EV Manufacturing Market covers the full industrial system used to design, assemble, and deliver battery electric, plug-in hybrid, and fuel cell vehicles at scale. This system includes cell and pack manufacturing, powertrain integration, software architecture, and advanced driver-assistance hardware. The market spans passenger cars, commercial trucks, buses, and two- and three-wheelers produced across dedicated Gigafactory facilities and flexible shared production lines worldwide.
Key Takeaways
- The global Future of EV Manufacturing Market was valued at 17.3 Million units in 2025 and is forecast to reach 46.2 Million units by 2035, growing at a CAGR of 10.3%.
- Battery Electric Vehicles (BEVs) dominate the By Propulsion Type segment with a 72.10% share in 2025.
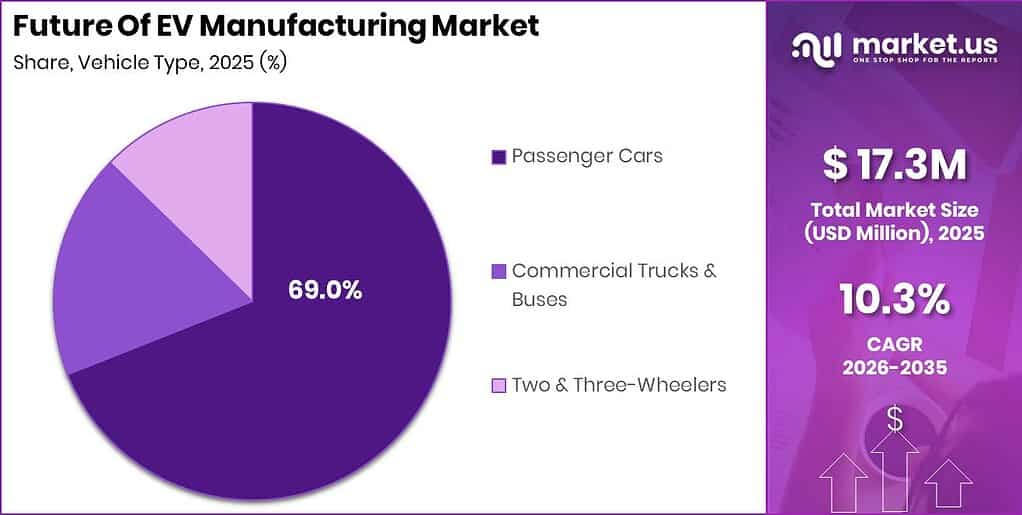
- Passenger Cars lead the By Vehicle Type segment with a 69.00% share.
- Battery Cell and Pack Assembly holds the top position in the By Component Technology segment with a 52.00% share.
- Flexible Shared Production Lines dominate the By Manufacturing Methodology segment with a 75.00% share.
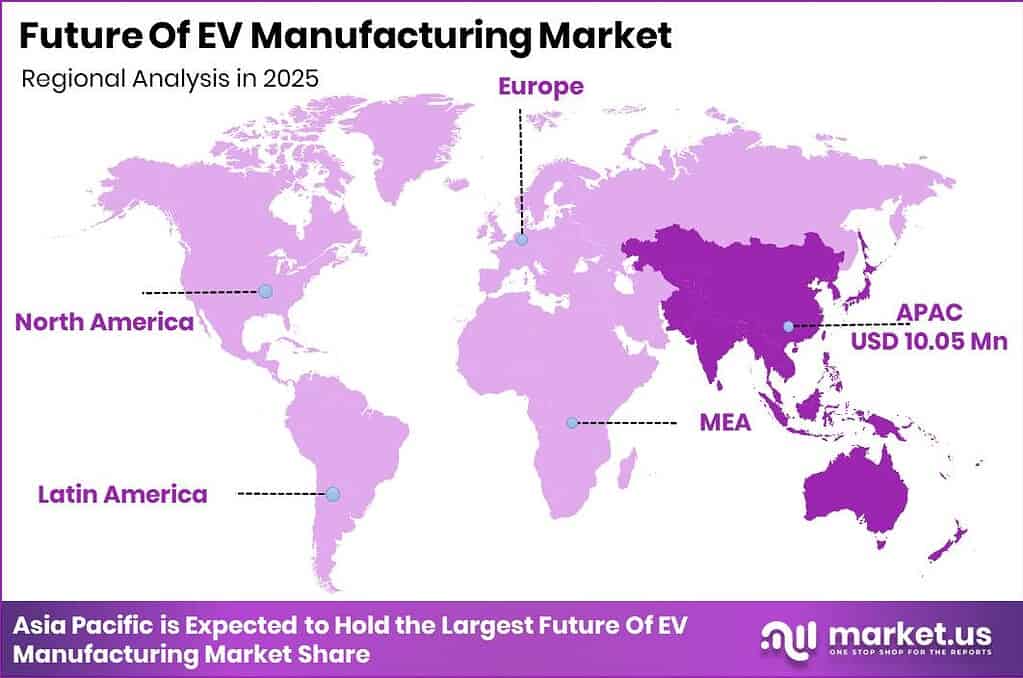
- Asia Pacific is the dominant region, holding a 58.00% market share equivalent to 10.05 Million units in 2025.
As reported by the IEA, nearly 22 million electric cars were manufactured globally in 2025, a rise of more than 25% from 2024. This output volume places direct pressure on component suppliers to scale in parallel. Tier-1 suppliers that fail to increase throughput risk losing preferred-vendor status to faster-moving competitors.
India’s automotive-component industry committed between ₹25,000 and ₹30,000 crore to EV-component production in FY2026, up from ₹15,000 to ₹20,000 crore in FY2025. This near-doubling confirms India as a structurally important manufacturing node outside China. Investors tracking low-cost assembly geographies should treat this investment cycle as a primary market signal.
Data from the IEA shows approximately 5.5 million vehicles crossed international borders in 2025, representing roughly 25% of total EV production. This trade volume confirms that Smart Manufacturing and export-grade standards are now prerequisites for competitive factories. Plants unable to meet multi-market certification requirements will be locked out of the fastest-growing trade lanes.
Propulsion Type Analysis
Battery Electric Vehicles (BEVs) dominate with 72.10% due to zero-emission compliance driving OEM platform investment.
In 2025, Battery Electric Vehicles held a dominant market position in the By Propulsion Type segment of the Future of EV Manufacturing Market, with a 72.10% share. According to the IEA, global electric-car sales exceeded 20 million units in 2025, an increase of 20% over 2024. This sales volume directly validates the manufacturing capacity investment OEMs have directed toward BEV-dedicated platforms, making BEV lines the highest-utilization assets in most global assembly networks.
Plug-in Hybrid Electric Vehicles occupy a structurally distinct position within the propulsion segment. PHEVs serve markets where charging infrastructure remains sparse, acting as a transitional powertrain that retains combustion components alongside battery packs. According to the International Organization of Motor Vehicle Manufacturers, PHEV production continued to grow in markets such as China and Europe, where regulatory frameworks incentivize low-emission alternatives ahead of full electrification. Manufacturers maintaining PHEV lines preserve flexibility for markets not yet ready for full BEV adoption.
Fuel Cell Electric Vehicles represent the smallest share within the propulsion segment today. FCEVs depend on hydrogen infrastructure that remains limited outside Japan, South Korea, and select European corridors. According to the IEA Hydrogen Tracking report, fewer than 1,000 hydrogen refueling stations were operational globally as of 2024, constraining commercial FCEV production volumes to specialized fleet and heavy-duty applications. Manufacturers investing in FCEV capacity today are positioning for long-horizon infrastructure buildout rather than near-term volume.
Vehicle Type Analysis
Passenger Cars dominate with 69.00% due to consumer BEV adoption outpacing all other classes.
In 2025, Passenger Cars held a dominant market position in the By Vehicle Type segment of the Future of EV Manufacturing Market, with a 69.00% share. According to Tesla’s official production report, Tesla alone produced 362,615 vehicles in Q1 2025, with 345,454 units being Model 3/Y passenger models. This single-OEM figure illustrates how concentrated high-volume EV passenger car assembly is within a small number of gigafactory-scale facilities globally.
Commercial Trucks and Buses represent a strategically important growth class within the vehicle type segment. Fleet operators in logistics, public transit, and urban freight face mandatory electrification timelines in the EU and several North American cities. According to the IEA Global EV Outlook 2026, electric bus and truck registrations grew across all major markets in 2025, with China accounting for the largest share of commercial EV deployments. Manufacturers that build commercial EV capacity now will benefit from locked-in government procurement contracts in the near term.
Two- and Three-Wheelers hold a distinct manufacturing position driven by volume in South and Southeast Asia. Announced Indian electric three-wheeler manufacturing investment through 2025 reached approximately ₹3,008 crore, equivalent to US$350 million, according to the Institute for Energy Economics and Financial Analysis. This committed capital confirms that two- and three-wheeler EV production is scaling beyond artisanal output into structured manufacturing. Investors entering this segment early will capture first-mover advantages in India’s high-density urban mobility market.
Component Technology Analysis
Battery Cell & Pack Assembly dominates with 52.00% due to cells representing 80% of total pack cost.
In 2025, Battery Cell and Pack Assembly held a dominant market position in the By Component Technology segment of the Future of EV Manufacturing Market, with a 52.00% share. According to the IEA, global lithium-ion battery nameplate manufacturing capacity exceeded 4 TWh at the end of 2025, increasing by approximately 30% in one year. This capacity expansion confirms that cell and pack manufacturing is the single largest capital investment category within EV production ecosystems globally.
Electric Powertrains and Motors represent the second major technology layer within EV component manufacturing. Powertrain integration determines vehicle performance, range efficiency, and thermal management quality. According to IEA data, China produced more than 80% of global battery cells in 2025, which directly constrains powertrain supply chains for non-Chinese OEMs dependent on imported cell inputs. Manufacturers without domestic cell supply agreements face structural powertrain cost exposure that undermines their ability to compete on vehicle price.
Autonomous and ADAS Hardware and Software and Zonal Architecture together form the fastest-evolving component layers in EV manufacturing. ADAS hardware integration is now embedded in new platform development from the design stage rather than added as an aftermarket feature. According to ITU and national regulatory filings, software-defined vehicle architectures are being mandated in multiple markets through type-approval regulation updates. These two sub-segments collectively hold the remaining share within component technology and will capture a growing proportion of bill-of-materials spend as vehicles become more software-centric.
Manufacturing Methodology Analysis
Flexible Shared Production Lines dominate with 75.00% due to multi-model flexibility cutting fixed assembly cost.
In 2025, Flexible Shared Production Lines held a dominant market position in the By Manufacturing Methodology segment of the Future of EV Manufacturing Market, with a 75.00% share. According to UNIDO industrial manufacturing statistics, flexible assembly systems allow plants to switch between vehicle models without full retooling shutdowns, reducing capital intensity per nameplate. This structural advantage makes flexible lines the default investment choice for OEMs managing multiple model launches within compressed development cycles.
Gigacasting and Megacasting represent a structural manufacturing shift that reduces body-in-white component counts from hundreds of parts to single die-cast sections. This methodology eliminates assembly stations, reduces weld points, and shortens production cycle time per vehicle. According to patent filings tracked through national patent databases, the number of gigacasting-related patents filed by Chinese and European OEMs increased materially between 2022 and 2025. Manufacturers adopting gigacasting at scale gain a durable cost-per-unit advantage that traditional stamping-and-welding competitors cannot quickly replicate.
Modular Unboxed Assembly is the newest manufacturing methodology entering production-scale deployment. This approach decouples subsystem assembly from the main production line, allowing battery, powertrain, and interior modules to be built simultaneously before final integration. According to industry association manufacturing benchmarks, modular assembly can reduce total factory footprint requirements by up to 40% compared with linear conveyor systems. Early adopters of unboxed architecture gain a facility efficiency advantage that directly reduces cost-per-unit at scale.
Key Market Segments
By Propulsion Type
- Battery Electric Vehicles (BEVs)
- Plug-in Hybrid Electric Vehicles (PHEVs)
- Fuel Cell Electric Vehicles (FCEVs)
By Vehicle Type
- Passenger Cars
- Commercial Trucks and Buses
- Two and Three-Wheelers
By Component Technology
- Battery Cell and Pack Assembly
- Electric Powertrains and Motors
- Autonomous and ADAS Hardware
- Software and Zonal Architecture
By Manufacturing Methodology
- Gigacasting and Megacasting
- Modular Unboxed Assembly
- Flexible Shared Production Lines
Regional Analysis
Asia Pacific Dominates the Future of EV Manufacturing Market with a Market Share of 58.00%, Valued at 10.05 Million Units
Asia Pacific holds the dominant position in the Future of EV Manufacturing Market, accounting for 58.00% of global production volume at 10.05 million units in 2025. China anchors this dominance through its integrated supply chain covering cell production, raw material refining, and final assembly. According to IEA data, China produced more than 80% of global battery cells in 2025, making the region structurally irreplaceable in EV manufacturing for the near term.
North America is the fastest-growing region in this market, supported by major capacity investments from both domestic and foreign OEMs. According to BloombergNEF, global passenger-EV sales reached 23.3 million units in 2026, an increase of 11% from 2025, with North American volumes supported by new dedicated facilities. In March 2025, Hyundai Motor Group inaugurated its Metaplant America facility in Georgia, increasing planned annual production capacity from 300,000 to 500,000 vehicles. This capacity addition signals long-term OEM commitment to US-based EV assembly independent of subsidy support.
India is an emerging high-priority manufacturing destination within the Asia Pacific region. Announced Indian electric four-wheeler manufacturing investments through 2025 totaled approximately US$15.16 billion, according to the Institute for Energy Economics and Financial Analysis. This capital commitment, combined with rising domestic EV demand, positions India as the next major EV manufacturing hub after China. Investors seeking lower-cost assembly alternatives to Chinese facilities should monitor India’s production ramp closely over the forecast period.
Key Regions and Countries
North America
- US
- Canada
Europe
- Germany
- France
- The UK
- Spain
- Italy
- Rest of Europe
Asia Pacific
- China
- Japan
- South Korea
- India
- Australia
- Rest of APAC
Latin America
- Brazil
- Mexico
- Rest of Latin America
Middle East and Africa
- GCC
- South Africa
- Rest of MEA
Market Dynamics
Market Opportunity Analysis - Underexploited geographies and emerging sub-segments offer high-return entry points for new EV manufacturing investors
The two- and three-wheeler EV segment in India and ASEAN remains structurally underpenetrated relative to its addressable volume. This segment benefits from lower capital intensity per production line compared with passenger car assembly. Investors seeking earlier returns with lower up-front CapEx should prioritize this vehicle class, where announced Indian investment of US$350 million through 2025 signals a nascent but accelerating manufacturing base with room for additional entrants at the component and assembly level.
Fuel Cell Electric Vehicle manufacturing represents an untapped layer within the propulsion segment that current production economics still suppress. FCEV production volumes remain confined to Japan, South Korea, and a narrow set of European fleet operators, leaving a structural gap between technology readiness and scaled industrial output. However, as hydrogen refueling infrastructure builds and government procurement mandates target heavy-duty fleets, FCEV manufacturing capacity will face a step-change demand signal that early-positioned assemblers will capture disproportionately.
The Software and Zonal Architecture sub-segment within Component Technology carries the highest potential margin per unit but currently represents the smallest share of manufacturing investment. Most OEMs still source zonal control units from Tier-1 electronics suppliers rather than developing them in-house. Manufacturers that vertically integrate zonal architecture and Digital Twin development can shift recurring software revenue from supplier to OEM, fundamentally changing their margin structure. This creates a clear acquisition target profile: automotive software firms with type-approved zonal control platforms.
Contract and white-label EV assembly capacity in Central Europe, Mexico, Türkiye, and Vietnam is a structurally underexploited opportunity. These regions offer competitive labor costs, existing automotive infrastructure, and proximity to major consuming markets. New entrants without OEM brand equity can enter as contract assemblers for brands lacking their own production footprint, capturing volume-based margin without bearing full platform development cost. This assembly-as-a-service model has no established dominant player today, representing genuine white space for a first mover.
Technology and Innovation Landscape - Robotics, gigacasting, and battery integration reshape the economics of EV factory design
Gigacasting technology is redefining the structural economics of vehicle body manufacturing. By die-casting entire rear or front underbody sections in a single aluminum pour, manufacturers eliminate hundreds of individual stamped components and the welding stations required to join them. According to patent databases, Chinese and European OEM gigacasting patent filings increased materially between 2022 and 2025. Manufacturers adopting Automotive Automation at this scale achieve lower component counts per vehicle, directly compressing assembly labor cost and factory footprint requirements.
Robotic assembly line integration is producing measurable productivity gains across EV factories in Asia. A peer-reviewed 2025 study published in Nature found that an Indian EV manufacturer reduced production time by 30% after integrating robotic assembly lines, alongside a 25% improvement in product quality. These outcomes confirm that Automotive Robotics investment generates returns that are quantifiable at the factory level within the first year of deployment. Manufacturers delaying robotics integration face a compounding productivity gap against early adopters.
Cell-to-pack integration technology is eliminating the intermediate module layer between individual cells and the vehicle floor structure. This architectural shift removes 15% to 25% of module hardware from the assembly process and cuts station count. According to IEA battery deployment data, the global lithium-ion nameplate capacity base exceeded 4 TWh at end of 2025, providing sufficient scale for cell-to-pack to be cost-effective across multiple chemistry types. Manufacturers that qualify cell-to-pack architectures gain structural bill-of-materials advantages that compound over successive model generations.
Software-defined vehicle architecture is shifting the center of value creation from hardware to firmware. Industrial Internet of Things (IIoT) connectivity standards now underpin factory-floor integration between vehicle software stacks and assembly control systems. According to the IEA, the ratio of EV battery deployment to nameplate manufacturing capacity remained below 30% at end of 2025, indicating that factories must recover fixed costs through higher software content per unit rather than volume alone. This dynamic accelerates the shift toward software-derived margin in EV manufacturing.
Drivers
Battery cell cost deflation is the most structurally significant driver of EV manufacturing expansion today. According to the IEA, global EV battery deployment reached 1.2 TWh in 2025, nearly 30% higher than 2024 and more than 7 times the 2020 level. This volume-driven learning curve pushed pack pricing to approximately $108/kWh across segments and near $99/kWh for pure BEV packs, with LFP chemistries reaching approximately $81/kWh. Manufacturers controlling cell supply capture this cost reduction directly as margin.
Dedicated BEV platforms combined with gigacasting industrialization are compressing production costs at the factory level. China’s NEV purchase-tax policy and NEV credit quota system support near-term volume throughput while LFP cell localization joint ventures secure long-term supply in North America, India, and Central Europe. EU CO2 fleet compliance requirements under three-year averaging create binding near-term demand for BEV output. Commercial fleet electrification across North America, Europe, and Gulf markets adds a stable procurement base that reduces OEM volume risk on new model launches.
| Driver | (~) % Impact on CAGR Forecast | Geographic Relevance | Impact Timeline |
|---|---|---|---|
| Sub-$100/kWh cell and pack cost deflation | +2.4% | Global; led by China, Southeast Asia | Short term (2 years or less) |
| Dedicated BEV platforms and gigacasting industrialisation | +1.6% | China, North America, Western Europe | Medium term (2 to 4 years) |
| China NEV purchase-tax bridge and NEV credit quota | +1.4% | China; export-linked ASEAN, Latin America | Short term (2 years or less) |
| LFP cell localisation and OEM cell maker joint ventures | +1.2% | North America, India, Central Europe | Medium term (2 to 4 years) |
| EU CO2 fleet compliance under three-year averaging | +1.0% | EU-27, EFTA, United Kingdom | Short term (2 years or less) |
| Commercial fleet and last-mile procurement electrification | +0.8% | North America, Europe, Gulf states | Medium term (2 to 4 years) |
Restraints
The termination of US clean vehicle tax credits created the most immediate structural discontinuity in North American EV demand. Under budget reconciliation legislation enacted in 2025, the Section 30D new clean vehicle credit worth up to $7,500 and the Section 45W commercial credit worth up to $40,000 per unit ceased to apply to vehicles acquired after 30 September 2025. Manufacturers absorbing part of that price gap through incentives surrendered 400 to 900 basis points of contribution margin per unit.
Elevated capital costs on gigafactory project finance are slowing capacity additions across Europe and emerging markets. Rare-earth magnet export licensing restrictions are disrupting powertrain supply chains in Europe, India, Japan, and North America. Countervailing and import duties on BEV trade affect market access in the EU, United States, Türkiye, and Brazil. Domestic price pressure and negative unit economics in China compound the challenge. Grid interconnection delays for plant energization extend timelines in the United States, Germany, and the United Kingdom.
| Restraint | (~) % Impact on CAGR Forecast | Geographic Relevance | Impact Timeline |
|---|---|---|---|
| Termination of US clean vehicle tax credits | -2.2% | United States; Canada spillover | Short term (2 years or less) |
| Elevated cost of capital on gigafactory project finance | -1.5% | Global; acute in Europe, emerging markets | Medium term (2 to 4 years) |
| Rare-earth magnet export licensing halts | -1.3% | Europe, India, Japan, North America | Short term (2 years or less) |
| Countervailing and import duty walls on BEV trade | -1.1% | EU-27, United States, Türkiye, Brazil | Medium term (2 to 4 years) |
| Domestic price war and negative unit economics | -0.9% | China; export inventory markets | Short term (2 years or less) |
| Grid interconnection delays for plant energisation | -0.7% | United States, Germany, United Kingdom | Medium term (2 to 4 years) |
Challenges
The electrochemistry and automation talent deficit poses a long-horizon structural challenge that no single OEM can resolve independently. Industry association workforce surveys in North America report that more than 80% of battery manufacturers cannot source sufficient locally skilled applicants. Bureau of Labor Statistics projections indicate that as many as 310,000 workers will be required across the lithium-ion supply chain by 2030. New cell plants consistently require 12 to 24 months longer than scheduled to reach target yield.
Legacy ICE plant retooling drag slows conversion timelines across Western Europe, Japan, and North America, where existing infrastructure represents sunk capital that cannot be written off quickly. Battery passport traceability requirements under EU regulation add compliance cost for all exporters into European markets. Public charging density gaps in India, ASEAN, Southern Europe, and US non-metro areas continue to constrain consumer adoption. Power semiconductor sourcing dependency and residual value exposure in leasing markets add further friction to the EV manufacturing ramp in multiple geographies.
| Challenge | (~) % CAGR Friction Drag | Geographic Relevance | Mitigation Horizon |
|---|---|---|---|
| Electrochemistry and automation talent deficit | -1.4% | Global; acute in US Southeast, India, Central Europe | Long term (4 years or more) |
| Legacy ICE plant retooling drag | -1.2% | Western Europe, Japan, North America | Long term (4 years or more) |
| Battery passport traceability burden | -1.0% | EU-27 and all exporters into EU | Medium term (2 to 4 years) |
| Public charging density gaps | -0.9% | India, ASEAN, Southern Europe, US non-metro | Medium term (2 to 4 years) |
| Power semiconductor sourcing dependency | -0.8% | Global; import-dependent India, Brazil | Medium term (2 to 4 years) |
| Residual value and warranty exposure | -0.6% | Europe, North America leasing markets | Long term (4 years or more) |
Opportunities
Closed-loop black mass refining and second-life battery storage represent the most undermonetized opportunity in the EV manufacturing value chain. According to IEA battery deployment tracking, cumulative installed EV battery capacity crossed the terawatt-hour-per-year threshold in 2025, establishing the return volumes that make dedicated refining lines viable from approximately 2029 onward. Hydrometallurgical recovery of black mass can return cathode metals at 20% to 40% below imported refined feedstock cost. Capturing this margin converts a disposal cost center into a high-margin upstream business.
Software-defined vehicle feature monetization and OTA revenue streams give OEMs a recurring income layer beyond the initial vehicle sale. Battery-as-a-service and swap-enabled architectures open high-volume two- and three-wheeler markets in China, India, and ASEAN. Sodium-ion entry-segment platforms create an addressable market in cost-sensitive geographies including Africa and Latin America. Contract and white-label EV assembly capacity in Central Europe, Mexico, Türkiye, and Vietnam enables non-OEM brands to access manufacturing scale. Distressed Tier-2 supplier consolidation offers short-term acquisition targets with immediate capacity and IP value.
| Opportunity | (~) % Potential CAGR Upside | Geographic Relevance | Execution Window |
|---|---|---|---|
| Closed-loop black mass refining and second-life storage | +1.9% | EU-27, North America, South Korea, China | Medium term (2 to 4 years) |
| Software-defined vehicle feature and OTA monetisation | +1.6% | North America, China, Western Europe | Medium term (2 to 4 years) |
| Battery-as-a-service and swap-enabled architectures | +1.2% | China, India, ASEAN two- and three-wheelers | Medium term (2 to 4 years) |
| Sodium-ion entry-segment platforms | +1.0% | China, India, Africa, Latin America | Long term (4 years or more) |
| Contract and white-label EV assembly capacity | +0.9% | Central Europe, Mexico, Türkiye, Vietnam | Medium term (2 to 4 years) |
| Distressed Tier-2 supplier roll-ups | +0.7% | Germany, Italy, Japan, India | Short term (2 years or less) |
Key Company Insights
BYD Company Limited operates the most vertically integrated EV manufacturing system of any automaker globally. BYD controls cell chemistry, battery pack design, powertrain engineering, and final vehicle assembly within a single corporate structure. This integration removes third-party cell cost from the bill of materials entirely. As a result, BYD competes at price points that non-integrated rivals structurally cannot match without significant margin sacrifice, giving it a durable cost floor advantage across every vehicle class it enters.
Tesla, Inc. produced more than 434,000 vehicles and delivered more than 418,000 vehicles in Q4 2025, confirming its position as the highest-throughput dedicated EV manufacturer globally. Tesla’s gigacasting-led assembly model and software-defined vehicle architecture give it structural cost and feature monetization advantages. However, the expiration of US Section 30D tax credits after September 2025 raises near-term demand risk on North American volume, particularly in the mid-price-range Model 3 and Model Y segments.
Key Players
- BYD Company Limited
- Tesla, Inc.
- Volkswagen Group
- Zhejiang Geely Holding Group
- SAIC Motor Corporation Limited
- Hyundai Motor Group
- General Motors Company
- BMW Group
- Stellantis N.V.
- Mercedes-Benz Group AG
- Toyota Motor Corporation
- Renault Group
- Nissan Motor Co., Ltd.
- Chery Automobile Co., Ltd.
- XPeng Inc.
Recent Developments
- October 2025: BMW Group began series production of the all-electric BMW iX3 at its Debrecen, Hungary plant, the company’s first factory designed exclusively for Neue Klasse electric vehicles with in-house high-voltage.
- December 2025: BMW Group completed commissioning and validation of new production systems at its Munich plant, preparing the facility for full-scale Neue Klasse Electric Vehicle Manufacturing beginning in 2026.
- September 2025: Rivian officially started construction of its US$5 billion Georgia manufacturing plant, which will produce the next-generation R2 and R3 electric vehicles at scale.
Geopolitical Impact Analysis
Trade policy escalation between the United States, China, and the EU is directly reshaping EV manufacturing cost structures and export strategies. According to the WTO, countervailing duties imposed by the EU on Chinese-origin BEVs reach up to 45.3% on certain manufacturers, while US tariff rates on Chinese vehicles exceed 100%, effectively closing two of the world’s three largest consumer markets to direct Chinese export. This forces Chinese OEMs to redirect export volume toward ASEAN, Latin America, and the Middle East while accelerating overseas factory investments to circumvent tariff walls.
Rare-earth magnet export licensing restrictions imposed by China since 2025 are disrupting powertrain supply chains across Europe, North America, Japan, and India. According to UNCTAD commodity tracking, China controls approximately 85% of global rare-earth processing capacity, creating a single-source dependency for neodymium-iron-boron magnets used in EV traction motors. Logistics disruptions in the Red Sea corridor, which the World Shipping Council reported added 10 to 14 days to Europe-Asia freight transit in 2024 and 2025, compounded input delays for non-Chinese OEMs already managing constrained rare-earth inventories.
Report Scope
| Report Features | Description |
|---|---|
| Market Value (2025) | 17.3 Million Units |
| Forecast Revenue (2035) | 46.2 Million Units |
| CAGR (2026-2035) | 10.3% |
| Base Year for Estimation | 2025 |
| Historic Period | 2020-2024 |
| Forecast Period | 2026-2035 |
| Report Coverage | Revenue Forecast, Market Dynamics, Market Opportunity Analysis, Technology and Innovation Landscape, Competitive Landscape, Recent Developments |
| Segments Covered | By Propulsion Type (Battery Electric Vehicles, Plug-in Hybrid Electric Vehicles, Fuel Cell Electric Vehicles), By Vehicle Type (Passenger Cars, Commercial Trucks and Buses, Two and Three-Wheelers), By Component Technology (Battery Cell and Pack Assembly, Electric Powertrains and Motors, Autonomous and ADAS Hardware, Software and Zonal Architecture), By Manufacturing Methodology (Gigacasting and Megacasting, Modular Unboxed Assembly, Flexible Shared Production Lines) |
| Regional Analysis | North America (US and Canada), Europe (Germany, France, The UK, Spain, Italy, and Rest of Europe), Asia Pacific (China, Japan, South Korea, India, Australia, and Rest of APAC), Latin America (Brazil, Mexico, and Rest of Latin America), Middle East and Africa (GCC, South Africa, and Rest of MEA) |
| Competitive Landscape | BYD Company Limited, Tesla Inc., Volkswagen Group, Zhejiang Geely Holding Group, SAIC Motor Corporation Limited, Hyundai Motor Group, General Motors Company, BMW Group, Stellantis N.V., Mercedes-Benz Group AG, Toyota Motor Corporation, Renault Group, Nissan Motor Co. Ltd., Chery Automobile Co. Ltd., XPeng Inc. |
| Customization Scope | Customization for segments, region / country-level will be provided. Additional customization can be done based on requirements. |
| Purchase Options | We have three licenses to opt for: Single User License | Multi-User License (Up to 5 Users) | Corporate Use License (Unlimited User and Printable PDF) |





































