


Report Overview
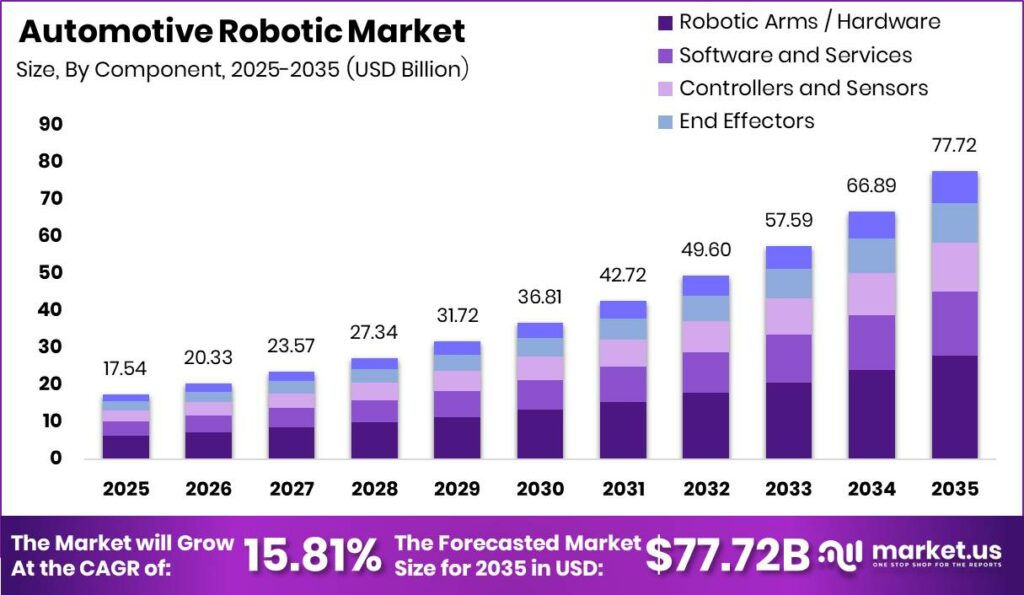
Global Automotive Robotic Market size is expected to be worth around USD 77.72 Billion by 2035 from USD 17.54 Billion in 2025, growing at a CAGR of 17.60% during the forecast period 2026 to 2035. This expansion reflects deep factory retooling for electric powertrains and high-mix body lines. Investors who fund multi-year integration pipelines capture recurring software and service revenue as hardware alone loses share.
Therefore, the market covers industrial and collaborative robots that weld, paint, assemble, inspect, cut, and move vehicle parts inside OEM plants and supplier sites. Structure splits by robot type, component stack, application cell, and end-user tier. Buyers treat cells as production assets whose uptime and changeover speed set line margin.
Key Takeaways
- The Automotive Robotic Market is valued at USD 17.54 Billion in 2025 and is projected to reach USD 77.72 Billion by 2035 at a CAGR of 17.60%.
- Articulated Robots lead By Robot Type with a 56.00% share.
- Robotic Arms / Hardware lead By Component with a 36.00% share.
- Welding Robots lead By Application with a 41.00% share.
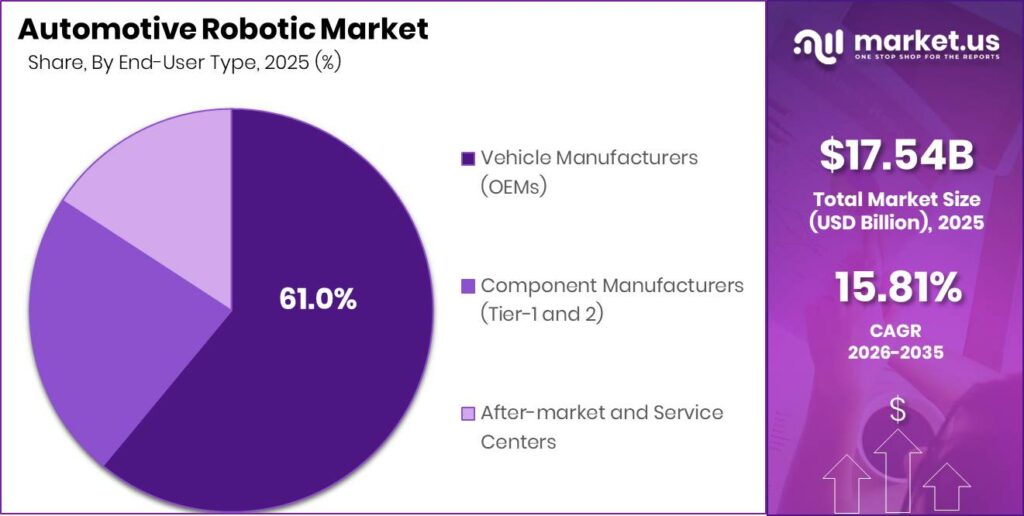
- Vehicle Manufacturers (OEMs) lead By End-User Type with a 61% share.
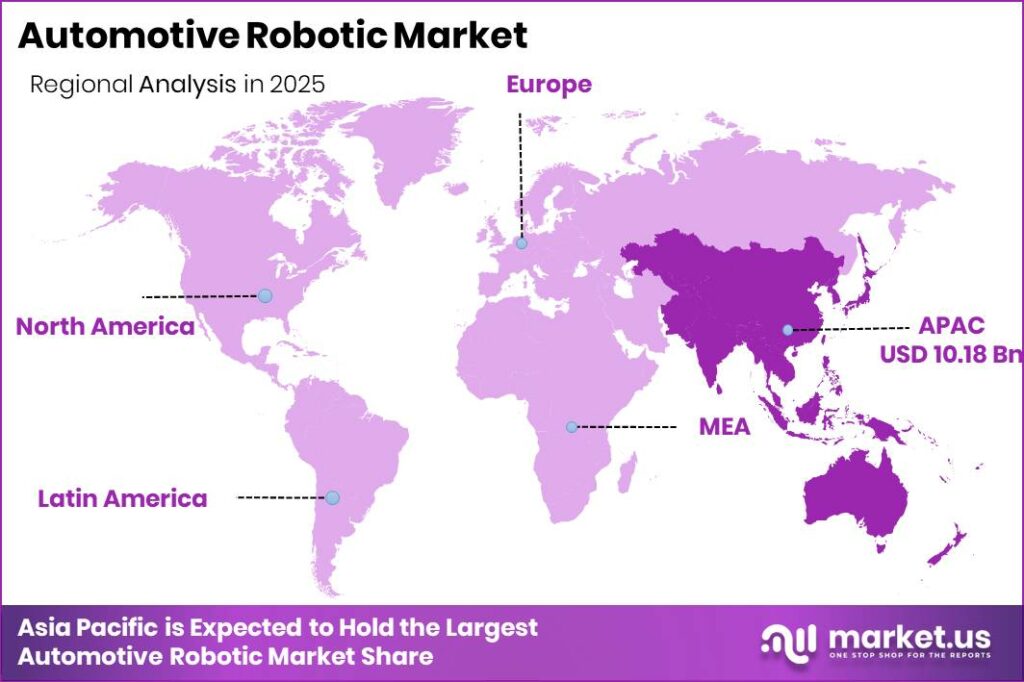
- Asia Pacific leads regionally with a 58.10% share valued at USD 10.18 Billion.
- Collaborative Robots, Software and Services, Inspection and Quality-Testing Robots, and After-market and Service Centers are the fastest-growing tracks in their groups.
Figures from IFR show U.S. automotive plants installed 13,700 industrial robots in 2024, a 10.7% rise year on year. This lift ties to body and powertrain automation under labor pressure. OEMs that lock multi-year robot supply contracts protect launch schedules when integrator capacity tightens.
As reported by IFR, Europe’s auto sector installed 23,000 industrial robots in 2024 and reached a density of 3,876 robots per 10,000 employees. High density cuts scrap on safety-critical welds. Suppliers who certify cells to local safety codes win repeat Tier-1 awards faster than pure hardware vendors.
Consequently, Wandercraft secured USD 75 million in Series D funding in June 2025 with Renault Group participation to industrialize the Calvin-40 humanoid. Early factory pilots open a path beyond fixed cages. Investors backing humanoid payloads for kitting gain optionality as EV mix rises across plants.
Robot Type Analysis
Articulated Robots dominates with 56.00% due to six-axis reach on body lines.
In 2025, Articulated Robots held a dominant market position in the By Robot Type segment of Automotive Robotic Market, with a 56.00% share. IFR data show 542,000 industrial robots installed worldwide in 2024, with automotive still a core buyer of multi-axis arms. Six-axis kinematics cover spot weld and seal paths that fixed machines cannot match. Vendors who bundle offline programming shorten launch risk for new body styles.
Collaborative Robots grow fastest as fence-free cells enter final assembly. A 2025 Tier-1 seat cell used a FANUC CR-35 cobot and vision to inspect 27 part variants inside a 50-second cycle and ran more than 190 unique checks. This first production cobot removed hard guarding for changeovers. Integrators who standardize safe speed and force limits win SME supplier rollouts first.
SCARA units serve high-speed pick-and-place on electronics and small powertrain parts. Automotive automation guides note SCARA cycles below 0.3 seconds and repeatability of plus or minus 0.01 mm. That precision protects connector and sensor placement yield. Buyers who dual-source SCARA and cartesian frames reduce single-vendor lock-in on subassembly lines.
Cartesian, cylindrical, and parallel robots fill gantry transfer, simple rotary, and high-speed pick niches and hold the remaining share collectively. Cartesian frames suit long linear strokes above body shops. Parallel arms fit light, fast packaging of small components. Plant engineers who map payload and workspace before RFPs cut change-order cost after award.
Component Analysis
Robotic Arms / Hardware dominates with 36.00% due to payload structure cost weight.
In 2025, Robotic Arms / Hardware held a dominant market position in the By Component segment of Automotive Robotic Market, with a 36.00% share. KUKA’s KR TITAN ultra platform supports payloads up to 1,500 kg for large body tooling and heavy stampings. High payload arms set the CapEx floor of each cell. Suppliers who localize castings and reducers protect margin when import duties rise.
Software and Services is the fastest-growing component track as plants buy vision AI, digital twins, and multi-year support. ABB’s 2025 LandingAI work targets up to 80% faster robot-vision training and deployment on high-variation tasks. Faster model rollout cuts engineering hours per SKU. Vendors who price software as subscription lift lifetime value above one-time arm sales.
Controllers and sensors close the motion and feedback loop on every axis. Global operational robot stock reached 4.664 million units in 2024, up 9%, raising demand for replacements and upgrades. Dense installed bases favor controller vendors with backward-compatible I/O. Buyers who standardize controller families cut spare-part inventory across plants.
End effectors plus drive units and sensors complete the stack for grip, weld, and dispense. Tool changers and force-torque sensors enable mixed-model runs without long stops. Drive packages set energy use per cycle on continuous lines. Cell designers who co-specify gripper and drive early avoid late mechanical redesigns.
Application Analysis
Welding Robots dominates with 41.00% due to body shop cycle criticality.
In 2025, Welding Robots held a dominant market position in the By Application segment of Automotive Robotic Market, with a 41.00% share. One Tier-1 multi-robot welding cell raised throughput by 300% on complex suspension parts at a 45-second cycle. Throughput gains repay cell cost inside tight model cycles. Weld OEMs who certify adaptive parameters win multi-plant frame contracts.
Inspection and Quality-Testing Robots grow fastest as zero-defect rules tighten. Mitsubishi Electric reports advanced visual inspection can process up to 200 parts per minute at 99.8% accuracy, while peer-reviewed ML inspection often exceeds 95% defect classification accuracy. Inline robots cut escape rates before paint. Quality leaders who embed robots at end-of-line reduce warranty reserves.
Painting robots deliver consistent film build and lower booth labor exposure. Closed spray paths stabilize VOC control and color match across shifts. Plants that pair paint robots with energy recovery lower utility cost per body. Coatings suppliers who co-develop path libraries lock long service agreements.
Assembly, cutting and milling, and material-handling robots share remaining demand for trim, powertrain, and logistics cells. A 2025 piston assembly system hit a 25-second cycle across two engine families and multiple variants. High-mix assembly rewards flexible fixtures. Logistics robots that feed sequenced parts cut line-side inventory for lean OEMs. In November 2025 Wandercraft partnered with Tier-1 SAPA to place Calvin-40 humanoids in component production for heavy-payload tasks.
End-User Type Analysis
Vehicle Manufacturers (OEMs) dominates with 61% due to full body shop CapEx control.
In 2025, Vehicle Manufacturers (OEMs) held a dominant market position in the By End-User Type segment of Automotive Robotic Market, with a 61% share. Japan’s automotive industry alone installed about 13,000 industrial robots in 2024, up 11%, largely on OEM electrification lines. OEM master schedules set robot order waves for entire regions. Robot makers who embed application centers near OEM hubs win specification freezes early.
Component Manufacturers (Tier-1 and 2) buy cells for seats, suspensions, electronics, and modules under OEM quality gates. Seat inspection cobots already run fence-free on 27 variants for Tier-1 final assembly. Tier plants need faster changeover than captive OEM shops. Integrators who offer standard cell kits for common modules scale across supplier parks.
After-market and Service Centers are the fastest-growing end-user track as repair automation and reman lines expand. Service depots adopt lighter robots for battery pack handling and calibration support. Lower duty cycles favor cobots over heavy articulated arms. Vendors who train dealer networks create a service pull-through channel beyond factory gates.
Key Market Segments
By Robot Type
- Articulated Robots
- Cartesian Robots
- SCARA Robots
- Cylindrical Robots
- Collaborative Robots (Cobots)
- Other Types (Parallel)
By Component
- Robotic Arms / Hardware
- Software and Services
- Controllers and Sensors
- End Effectors
- Drive Units and Sensors
By Application
- Welding Robots
- Inspection and Quality-Testing Robots
- Painting Robots
- Assembly, Painting and Disassembly Robots
- Cutting and Milling Robots
- Material-Handling Robots
By End-User Type
- Vehicle Manufacturers (OEMs)
- Component Manufacturers (Tier-1 and 2)
- After-market and Service Centers
Regional Analysis
Asia Pacific Dominates the Automotive Robotic Market with a Market Share of 58.10%, Valued at USD 10.18 Billion
Asia Pacific leads through dense vehicle output in China, Japan, South Korea, and India and continuous EV line builds. Japan’s auto robot installs near 13,000 units in 2024 show sustained OEM appetite. Regional suppliers scale arms and controllers close to plants. Investors who fund local integration talent capture the largest absolute unit growth.
North America posts strong replacement and EV retool demand. U.S. auto robot installations rose 10.7% to 13,700 units in 2024 per IFR. Reshoring incentives pull new cells into powertrain and battery halls. In 2026 Mind Robotics, linked to Rivian leadership, raised USD 400 million more to place intelligent industrial robots inside vehicle plants, reinforcing U.S. factory automation spend.
Europe holds high robot density at 3,876 units per 10,000 auto employees and installed 23,000 auto robots in 2024. Quality and safety rules keep inspection and weld cells refreshed. Latin America and Middle East and Africa add selective OEM and CKD line automation as local assembly expands.
Key Regions and Countries
North America
- US
- Canada
Europe
- Germany
- France
- The UK
- Spain
- Italy
- Rest of Europe
Asia Pacific
- China
- Japan
- South Korea
- India
- Australia
- Rest of APAC
Latin America
- Brazil
- Mexico
- Rest of Latin America
Middle East and Africa
- GCC
- South Africa
- Rest of MEA
Market Dynamics
Market Opportunity Analysis - Cobots, aftermarket service, SME suppliers, and humanoid pilots open white space beyond OEM body shops
After-market and Service Centers remain underexploited relative to OEM share above 60%. Repair and reman lines need lighter duty cycles than body shops. Entrants who sell cobot battery-handling kits to dealer networks build a distributed installed base. This channel monetizes software updates without waiting for full plant RFPs.
Collaborative Robots still trail articulated share near 56% yet grow fastest inside fence-free final assembly. Seat cells already prove 27-variant changeovers without hard guarding. New players who certify ISO/TS safety packages for Tier-2 plants win volume before large OEMs standardize. Early reference plants become exportable cell templates.
Software and Services lag hardware’s 36% component lead even as vision AI and twins decide cell ROI. Plants still buy arms first and underfund analytics. Vendors who attach predictive maintenance to every controller shipment raise attach rates. Investors funding application marketplaces capture recurring revenue as stock exceeds 4.6 million global units.
Emerging Asia SME suppliers lag dense Japan and Korea robot use despite regional market leadership above 58%. Lower integration capital products and RaaS leases unlock this tier. Local joint ventures that train technicians reduce the talent drag that slows go-live. First movers who own the SME channel lock multi-year module contracts tied to global EV platforms.
Technology and Innovation Landscape - Vision AI, heavy payload arms, predictive weld analytics, and energy optimization reset cell economics
Generative robot vision is compressing deployment time. ABB and LandingAI target up to 80% faster training on high-variation tasks common in trim and inspection. Shorter teach cycles free scarce engineers for more lines. Suppliers who ship pre-trained defect libraries win multi-plant rollouts over generic camera vendors.
At Ford’s Livonia Transmission Plant, Symbio AI on a torque-converter insertion cell cut by 50% both time and parts needed to reach optimal process parameters after weekend validation. Adaptive process control turns robots into self-tuning assets. Integrators who productize similar AI layers raise switching costs versus pure kinematics sellers.
Heavy payload platforms such as KUKA’s KR TITAN ultra at up to 1,500 kg move large body tooling that once needed custom gantries. KUKA Group invested a record EUR 213 million in R&D in 2025 across robotics and physical AI. Scale R&D funds simulation that shortens virtual commissioning. Buyers who adopt high-payload standard arms cut special machine cost on truck and EV skateboard lines.
Mitsubishi Electric reports predictive welding analytics can reach 100% process control with 97% accuracy and AI energy optimization can cut energy costs by up to 30% in robot-heavy halls. Inspection systems can hit 200 parts per minute at 99.8% accuracy. Plants that close the loop from weld to energy dashboards protect both quality and utility budgets as electricity prices stay volatile.
Drivers
EV and battery line retooling is the strongest near-term force, adding an estimated +3.4% above the 17.60% baseline CAGR. New cell-handling, adhesive, and weld cells cannot reuse legacy combustion fixtures. IFR tracked 542,000 global industrial robot installs in 2024, with Japan auto up about 11% on electrification. This shift moves buyers toward multi-year integration and service contracts that smooth CapEx while protecting launch dates.
Manufacturing labor scarcity and wage pressure add roughly +2.6% impact in North America, Western Europe, and Japan. AI vision, adaptive control, Industry 4.0 twins, reshoring incentives, and safety mandates layer further upside from +2.1% to +0.9%. Deloitte’s 2025 survey of 600 manufacturing executives found 80% plan to put at least 20% of improvement budgets into automation. Sellers who package RaaS with trained support win when plants cannot hire controls staff fast enough.
| Driver | (~) % Impact on CAGR Forecast | Geographic Relevance | Impact Timeline |
|---|---|---|---|
| EV & battery line retooling | +3.4% | Asia-Pacific, Europe, North America | Short term (2 years or less) |
| Manufacturing labor scarcity & wage inflation | +2.6% | North America, Western Europe, Japan | Short term (2 years or less) |
| AI-enabled vision & adaptive control | +2.1% | Global | Medium term (2 to 4 years) |
| Industry 4.0 & digital-twin integration | +1.8% | Europe, East Asia | Medium term (2 to 4 years) |
| Government reshoring incentives | +1.3% | United States, EU, India | Short term (2 years or less) |
| Rising vehicle quality & safety mandates | +0.9% | Global | Long term (4 years or more) |
Restraints
High interest rates are the sharpest brake, subtracting about -2.9% from baseline growth in North America and Europe. Robotics cells are debt-heavy assets with multi-quarter paybacks. IMF and OECD tracking kept policy rates far above the prior sub-1% cycle through 2025. Finance teams defer approved lines when IRR flips negative, which compresses integrator backlogs and hardware margins.
Import tariffs on robotic hardware cut roughly -2.2% in the United States, while steep integration capital removes about -1.7% in emerging Asia. EV demand pauses in Europe and North America trim another -1.4%, and legacy line incompatibility adds -0.8% globally. Vendors who offer staged payment and brownfield retrofit kits keep deals alive when pure greenfield CapEx freezes.
| Restraint | (~) % Impact on CAGR Forecast | Geographic Relevance | Impact Timeline |
|---|---|---|---|
| High interest rates freezing CapEx | -2.9% | North America, Europe | Short term (2 years or less) |
| Import tariffs on robotic hardware | -2.2% | United States | Short term (2 years or less) |
| Steep upfront integration capital | -1.7% | Emerging markets, India, SE Asia | Medium term (2 to 4 years) |
| EV demand deceleration in key markets | -1.4% | Europe, North America | Short term (2 years or less) |
| Legacy line incompatibility | -0.8% | Global | Medium term (2 to 4 years) |
Challenges
Robotics integration talent shortage creates the largest long-horizon drag at about -2.4% globally. Commissioning speed depends on scarce mechatronics and controls engineers even when hardware is on site. With 4,664,000 robots in operation worldwide in 2024, service and reprogram load outruns training pipelines. Day-rates rise, go-live slips, and both suppliers and plants delay revenue recognition.
Semiconductor lead times subtract roughly -1.9%, interoperability and legacy IT about -1.5% in Europe and North America, cybersecurity about -1.1%, and single-sourcing risk about -0.9%. Low-code interfaces, apprenticeship programs, and RaaS models that externalize skills open a multi-year services revenue stream. Firms that productize commissioning playbooks turn a capacity bottleneck into sticky contracts.
| Challenge | (~) % CAGR Friction Drag | Geographic Relevance | Mitigation Horizon |
|---|---|---|---|
| Robotics integration talent deficit | -2.4% | Global | Long term (4 years or more) |
| Semiconductor & component lead times | -1.9% | Global | Medium term (2 to 4 years) |
| Interoperability & legacy IT drag | -1.5% | Europe, North America | Medium term (2 to 4 years) |
| Cybersecurity of connected cells | -1.1% | Global | Long term (4 years or more) |
| Supply-chain single-sourcing risk | -0.9% | North America, Europe | Medium term (2 to 4 years) |
Opportunities
Humanoid robots on assembly lines offer the largest upside at about +3.1% in the United States, China, and Japan over a long window. Pilots target kitting, transfer, and final trim that caged robots do not cover economically. As unit costs fall toward multi-year labor parity, one reprogrammable platform can replace several fixed cells. Early movers who secure domestic supply against hardware duties lock factory design wins before scale pricing appears.
Robotics-as-a-Service can add roughly +2.4% globally by converting CapEx to OpEx for cash-tight plants. Cobot penetration in SME suppliers adds about +2.0% in emerging Asia, aftermarket predictive software about +1.6%, and integrator M&A roll-ups about +1.2% in North America and Europe. Platforms that combine financing, remote monitoring, and spare logistics capture wallet share beyond the first arm shipment.
| Opportunity | (~) % Potential CAGR Upside | Geographic Relevance | Execution Window |
|---|---|---|---|
| Humanoid robots on assembly lines | +3.1% | United States, China, Japan | Long term (4 years or more) |
| Robotics-as-a-Service monetization | +2.4% | Global | Medium term (2 to 4 years) |
| Cobot penetration in SME suppliers | +2.0% | Emerging markets, India, SE Asia | Medium term (2 to 4 years) |
| Aftermarket & predictive-maintenance software | +1.6% | Global | Medium term (2 to 4 years) |
| M&A roll-up of integrators | +1.2% | North America, Europe | Short term (2 years or less) |
Key Company Insights
ABB Ltd. reports more than 500,000 robots in its installed base and pairs that scale with generative vision AI that can cut training time by up to 80%. In ABB’s automotive survey, 75% of leaders expected EV output to rise in 2025, aligning the portfolio to battery and e-motor cells. This breadth lowers buyer risk on global multi-plant standards. In January 2026 Arm formed a Physical AI unit linking automotive and robotics silicon, a complementary ecosystem trend around the same factory AI stack.
FANUC Corporation anchors high-volume auto cells and collaborative inspection, including CR-35 deployments that inspect dozens of seat variants without fences. Deep controller and servo integration keeps cycle times stable on weld and handling lines. This vertical stack defends share when pure software entrants lack motion reliability. Plants that standardize on FANUC spares cut unplanned downtime across body and assembly halls.
Key Players
- ABB Ltd.
- FANUC Corporation
- Yaskawa Electric Corporation
- Kawasaki Heavy Industries, Ltd.
- Nachi-Fujikoshi Corp.
- Acieta, LLC
- Comau S.p.A.
- Denso Corporation
- Epson America, Inc.
- KUKA AG
- Mitsubishi Electric Corporation
- Neura Robotics GmbH
- Omron Adept Technologies, Inc.
- Stäubli International AG
- Universal Robots A/S
Recent Developments
- January 2026: Mobileye announced an agreement to acquire Mentee Robotics, an AI-based humanoid robotics company, to combine autonomous driving AI with humanoid platforms for physical AI in industrial settings.
- September 2025: Agile Robots completed the acquisition of Idealworks, a BMW Group spin-off focused on autonomous mobile robots and factory logistics, including the AnyFleet platform and iw.hub robots already used in BMW plants.
- April 2025: Boston Dynamics and Hyundai Motor Group expanded their robotics manufacturing collaboration, with Hyundai planning deployment of tens of thousands of robots and future Atlas humanoid integration in factory operations.
- January 2025: Ati Motors raised USD 20 million in Series B funding from Walden Catalyst Ventures and NGP Capital to scale Sherpa autonomous mobile robots for industrial and automotive plants.
- March 2025: Apptronik secured more than USD 400 million in Series A funding with participation from Google and Mercedes-Benz to accelerate Apollo humanoid production for automotive manufacturing tasks.
Geopolitical Impact Analysis
Data from the WTO and national tariff schedules show industrial robot and component duties remaining a live cost lever, with some markets applying baseline hardware tariffs near 10% and higher country-specific rates on selected parts. UNCTAD trade monitors flag longer lead times when electronics and servo supply chains reroute around restricted corridors. Automotive robot cells that depend on imported controllers face multi-week delays and higher landed cost. OEMs that dual-source drives and localize final assembly of arms protect launch calendars when trade friction spikes.
However, IFR figures already show U.S. auto robot installs at 13,700 units in 2024 and Europe at 23,000, proving demand continues under policy noise. World Bank logistics indicators still record elevated shipping cost volatility on Asia–Europe and Trans-Pacific lanes versus pre-shock baselines. Energy price swings tracked by the IEA raise operating cost for paint and weld halls that run high robot density. Manufacturers who lock multi-year power and freight contracts keep cell ROI models stable when geopolitics moves spot rates.
Report Scope
| Report Features | Description |
|---|---|
| Market Value (2025) | USD 17.54 Billion |
| Forecast Revenue (2035) | USD 77.72 Billion |
| CAGR (2026-2035) | 17.60% |
| Base Year for Estimation | 2025 |
| Historic Period | 2020-2024 |
| Forecast Period | 2026-2035 |
| Report Coverage | Revenue Forecast, Market Dynamics, Market Opportunity Analysis, Technology and Innovation Landscape, Competitive Landscape, Recent Developments |
| Segments Covered | By Robot Type (Articulated Robots, Cartesian Robots, SCARA Robots, Cylindrical Robots, Collaborative Robots (Cobots), Other Types (Parallel)), By Component (Robotic Arms / Hardware, Software and Services, Controllers and Sensors, End Effectors, Drive Units and Sensors), By Application (Welding Robots, Inspection and Quality-Testing Robots, Painting Robots, Assembly, Painting and Disassembly Robots, Cutting and Milling Robots, Material-Handling Robots), By End-User Type (Vehicle Manufacturers (OEMs), Component Manufacturers (Tier-1 and 2), After-market and Service Centers) |
| Regional Analysis | North America (US and Canada), Europe (Germany, France, The UK, Spain, Italy, and Rest of Europe), Asia Pacific (China, Japan, South Korea, India, Australia, and Rest of APAC), Latin America (Brazil, Mexico, and Rest of Latin America), Middle East and Africa (GCC, South Africa, and Rest of MEA) |
| Competitive Landscape | ABB Ltd., FANUC Corporation, Yaskawa Electric Corporation, Kawasaki Heavy Industries, Ltd., Nachi-Fujikoshi Corp., Acieta, LLC, Comau S.p.A., Denso Corporation, Epson America, Inc., KUKA AG, Mitsubishi Electric Corporation, Neura Robotics GmbH, Omron Adept Technologies, Inc., Stäubli International AG, Universal Robots A/S |
| Customization Scope | Customization for segments, region / country-level will be provided. Additional customization can be done based on requirements. |
| Purchase Options | We have three licenses to opt for: Single User License | Multi-User License (Up to 5 Users) | Corporate Use License (Unlimited User and Printable PDF) |





































