


Report Overview
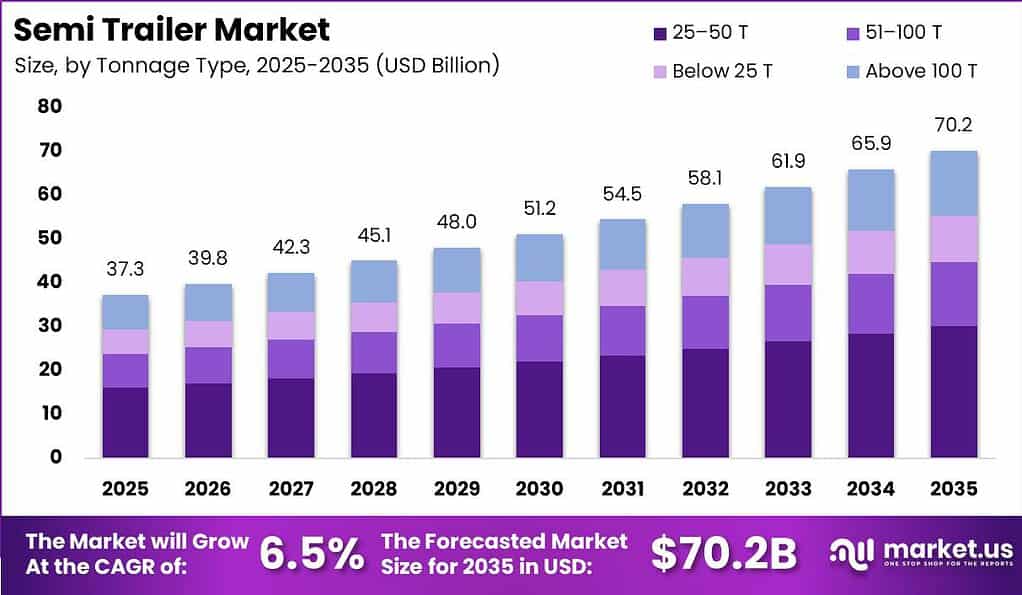
Global Semi Trailer Market size is expected to be worth around USD 70.2 Billion by 2035 from USD 37.3 Billion in 2025, growing at a CAGR of 6.5% during the forecast period 2026 to 2035.
A semi trailer functions as the load-bearing unit that attaches to a tractor unit, carrying freight across dry van, flatbed, refrigerated, lowboy, and tanker configurations. This structure allows fleet operators to match trailer type directly to cargo requirements. Therefore, buyers evaluate purchases around payload efficiency, regulatory compliance, and total cost of ownership rather than price alone.
Key Takeaways
- Global Semi Trailer Market size is valued at USD 37.3 Billion in 2025 and is projected to reach USD 70.2 Billion by 2035.
- The market is expected to grow at a CAGR of 6.5% from 2026 to 2035.
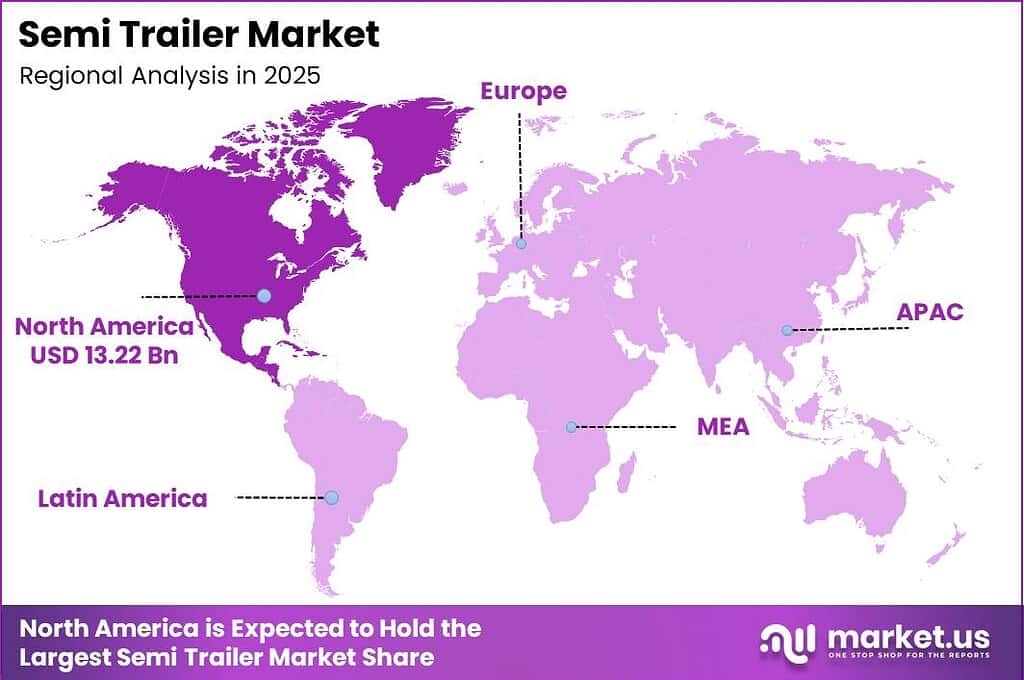
- North America dominates the market with a 35.4% share, valued at USD 13.22 Billion.
- Dry Van leads the By Type segment with a 41.1% share.
- Refrigerated (Reefer) trailers represent the fastest growing type segment.
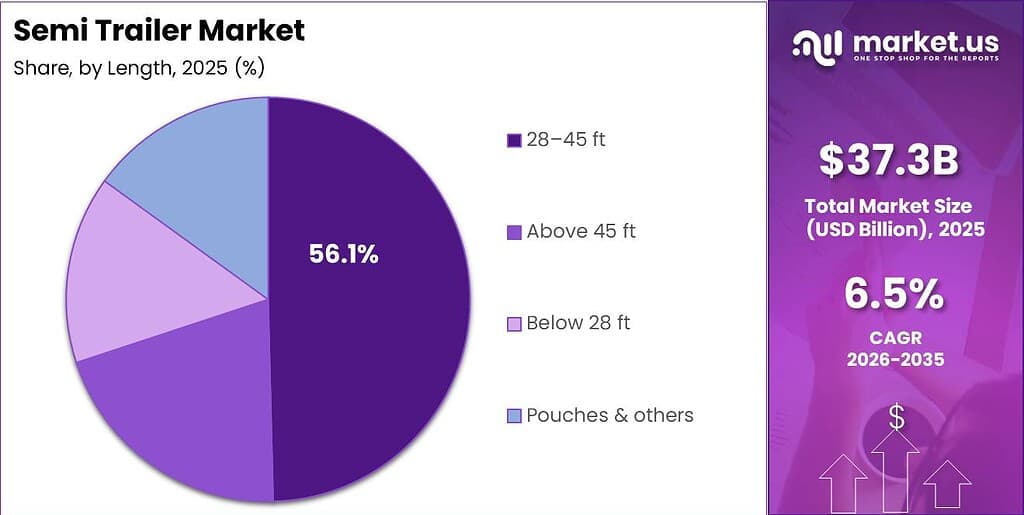
- The 28 to 45 Ft length segment holds the largest share at 56.1%.
- The 25 to 50 T tonnage segment is the fastest growing at 43.1%.
- Transportation and Logistics (General Freight) leads the By End-Use segment with a 40.3% share.
Regulatory bodies shape trailer specification standards through axle-weight limits and dimension rules that vary by corridor. This creates pressure on manufacturers to design trailers that meet multiple jurisdictional requirements simultaneously. As a result, companies offering configurable platforms gain an edge over single-spec producers competing only in domestic markets.
As per our research, the trucking sector moved 11.27 Billion tons of freight in the United States during 2024. This volume reflects trailers operating as continuous-cycle assets rather than idle equipment. Consequently, replacement demand stays tied to actual freight throughput instead of speculative fleet expansion.
Data from the American Trucking Associations shows the U.S. trucking industry generated USD 906 Billion in revenue during 2024, with trucks carrying 72% of domestic freight tonnage. This concentration means trailer demand tracks closely with broader freight economics. Wabash partnered with UP.Labs in April 2025 to build AI powered tools for trailer configuration and aftermarket optimization, signaling that manufacturers are tying digital tooling directly to production efficiency. However, driver vacancy pressure reported in the United Kingdom, where 26% of HGV businesses cited open positions in the fourth quarter of 2025, shows labor constraints now shape fleet utilization on both sides of the Atlantic.
Type Analysis
Dry Van dominates with 41.1% due to broad freight compatibility and utilization.
In 2025, Dry Van held a dominant market position in the By Type segment of Semi Trailer Market, with a 41.1% share. Per Great Britain’s Department for Transport, GB-registered HGVs transported 1.53 Billion tonnes of goods in 2025, much of it carried in enclosed van configurations. This volume shows dry van units remain the default choice for general cargo movement. Manufacturers focusing on standardized enclosed designs capture the broadest replacement order base across freight corridors.
Refrigerated trailers serve temperature sensitive cargo including pharmaceuticals and perishable food, a functional role distinct from general freight units. UNIDO manufacturing output data indicates cold-chain equipment production has expanded alongside stricter food safety compliance rules in multiple regions. This structural requirement means reefer units command premium pricing over standard van trailers. Builders investing in insulation and refrigeration integration secure higher margin contracts as compliance tightens.
Flatbed and lowboy trailers carry oversized, heavy, or irregularly shaped freight such as construction machinery and industrial equipment. A regulatory filing framework under the Federal Motor Carrier Safety Administration requires specialized permitting for oversize loads carried on these platforms. This permitting burden raises operating complexity for carriers. Consequently, fleets favor established flatbed manufacturers with proven compliance documentation over new entrants. Tanker trailers and other specialized units, including curtain-siders and chassis platforms, collectively hold the remaining share and serve niche bulk and intermodal transport applications.
Tonnage Analysis
25 to 50 T dominates with 43.1% due to fastest adoption across regional freight fleets.
In 2025, 25 to 50 T held a dominant market position in the By Tonnage segment of Semi Trailer Market, with a 43.1% share. Figures from the UK Department for Transport show GB-registered HGVs moved 162 Billion tonne-kilometres of freight in 2025. This tonnage range aligns with standard regional distribution loads. Fleet buyers in this bracket prioritize fast turnaround over maximum capacity, favoring manufacturers with shorter production lead times.
The 51 to 100 T bracket serves heavier industrial and construction cargo requiring reinforced axle configurations. Corporate regulatory filings on axle load compliance show this bracket faces stricter inspection requirements than lighter classes. This means builders must certify structural durability before entering certain regional markets. Manufacturers with existing certification pass this cost barrier onto competitors lacking documented compliance history.
Below 25 T trailers serve light regional and last-mile distribution roles, while Above 100 T units serve heavy bulk and specialized industrial transport. Both brackets hold smaller shares collectively within the tonnage hierarchy. World Bank industrial indicators tie heavier bracket demand to infrastructure investment cycles in developing economies. This connects tonnage segment growth directly to construction and industrial output trends rather than general freight volume.
Length Analysis
28 to 45 Ft dominates with 56.1% due to universal corridor and dock compatibility.
In 2025, 28 to 45 Ft held a dominant market position in the By Length segment of Semi Trailer Market, with a 56.1% share. National statistical office data on freight corridor infrastructure confirms this length range matches standard loading dock and highway corridor specifications across most regions. This compatibility reduces retrofitting costs for fleet operators. Manufacturers building to this exact specification win the largest share of standardized replacement contracts.
Above 45 Ft trailers extend cargo capacity for high-cube freight moving long-haul routes with fewer stops. Customs databases tracking cross-border shipment dimensions show extended length units require specific corridor permitting in certain jurisdictions. This creates a narrower addressable market than standard length trailers. However, carriers running dense long-haul networks accept this complexity for the added payload efficiency per trip.
Below 28 Ft trailers and pouch or specialized attachment units serve short-haul and niche delivery roles including last-mile and municipal freight tasks. These categories hold the remaining length segment share collectively. Industry trade association benchmarks classify these units as a distinct operating category from long-haul equipment. This distinction means manufacturers serving urban fleets compete on maneuverability rather than capacity.
End-Use Analysis
Transportation and Logistics dominates with 40.3% due to general freight volume across all corridors.
In 2025, Transportation and Logistics (General Freight) held a dominant market position in the By End-Use segment of Semi Trailer Market, with a 40.3% share. Per ITC Trade Map cross-border freight data, trucks carried 67% of surface trade between the United States and Canada. This cross-border reliance shows general freight trailers underpin continental supply chains. Fleet operators serving these corridors drive the largest replacement order volume in the entire market.
Construction and Heavy Industry end-use relies on flatbed and lowboy configurations to move machinery and building materials to project sites. UN Comtrade data on construction equipment shipments links project cycle timing directly to trailer order volume in this segment. This cyclicality means demand rises and falls with infrastructure spending cycles. Manufacturers serving this end-use manage production scheduling around construction project pipelines rather than steady annual demand.
Food and Beverage, including cold-chain logistics, ranks as the fastest growing end-use category, while Oil and Gas, Chemicals, and Bulk Materials plus Automotive and Healthcare services hold the remaining share collectively. Per ITC Trade Map data, trucks moved 85% of all surface freight crossing the U.S. Mexico border in 2024, much of it tied to cross-border manufacturing supply chains. This border dependency ties bulk and chemical trailer demand to trade policy stability. Operators in these end-uses prioritize compliance certified tanker and bulk trailer builders over general-purpose manufacturers.
Key Market Segments
By Type
- Dry Van
- Flatbed
- Refrigerated (Reefer)
- Lowboy
- Tanker
- Others (Curtain-Sider, Chassis, Specialized)
By Tonnage
- 25 to 50 T
- 51 to 100 T
- Below 25 T
- Above 100 T
By Length
- 28 to 45 Ft
- Above 45 Ft
- Below 28 Ft
- Pouches and Others
By End-Use
- Transportation and Logistics (General Freight)
- Construction and Heavy Industry
- Food and Beverage / Cold-Chain
- Oil and Gas / Chemicals / Bulk Materials
- Automotive, Healthcare and Other Services
Regional Analysis
North America Dominates the Semi Trailer Market with a Market Share of 35.4%, Valued at USD 13.22 Billion
North America leads the global semi trailer market through dense long-haul freight networks connecting the United States, Canada, and Mexico. This freight density supports continuous trailer replacement cycles among major fleet operators. Consequently, manufacturers headquartered in this region hold the strongest order backlog visibility across all trailer types. Cross-border trade volume between these three countries reinforces the region’s structural demand advantage over other geographies.
Asia Pacific represents the fastest growing region as industrial output and infrastructure construction expand across China, India, and Southeast Asia. This growth pushes demand for flatbed and heavy tonnage trailers tied to construction material transport. Therefore, manufacturers entering this region prioritize heavy-duty configurations over standard dry van units. Rising formalization of logistics networks in these markets creates a widening base for future fleet expansion.
Europe maintains steady demand tied to cross-border freight regulation and emission compliance requirements across member states. This regulatory environment favors manufacturers offering standardized platforms adaptable to multiple national requirements. Latin America and the Middle East and Africa contribute smaller but growing shares, driven by expanding regional freight corridors and industrial project activity. This distributed growth pattern signals opportunity for manufacturers building flexible regional distribution strategies.
Key Regions and Countries
North America
- US
- Canada
Europe
- Germany
- France
- The UK
- Spain
- Italy
- Rest of Europe
Asia Pacific
- China
- Japan
- South Korea
- India
- Australia
- Rest of APAC
Latin America
- Brazil
- Mexico
- Rest of Latin America
Middle East and Africa
- GCC
- South Africa
- Rest of MEA
Market Dynamics
Market Opportunity Analysis - Underserved tonnage brackets and cold-chain corridors offer entry points for new entrants
The Below 25 T and Above 100 T tonnage brackets remain underexploited relative to the dominant 25 to 50 T category. This gap leaves niche urban delivery and heavy specialized freight segments open for builders willing to design outside the standard bracket. However, entrants must certify structural durability separately for each bracket. This creates a defensible position once achieved, since fewer competitors pursue these narrower specifications.
The Middle East and Africa region, alongside Latin America, holds a smaller share of the regional market than North America or Asia Pacific. This creates room for manufacturers establishing early distribution partnerships before regional freight corridors mature further. Instead of competing directly against established North American players, entrants can build first-mover relationships in these developing logistics networks.
Food and Beverage and Cold-Chain end-use ranks as the fastest growing category within the By End-Use segment. This growth outpaces general freight demand yet remains served by fewer specialized manufacturers than the dry van category. Therefore, builders investing in refrigerated trailer capacity now position themselves ahead of demand that is still accelerating rather than entering a saturated segment.
The Below 28 Ft and specialized pouch trailer category serves last-mile and municipal delivery roles distinct from long-haul freight. This category remains smaller than standard length segments but growing alongside e-commerce distribution networks. This signals investors that compact trailer platforms may capture disproportionate share as urban delivery volume continues expanding.
Technology and Innovation Landscape - Automation, telematics, and lightweight materials reshape trailer competitiveness
AI powered trailer telematics now integrates cargo monitoring with real-time fleet analytics across new trailer platforms. This technology shifts the value proposition from a one-time equipment sale toward ongoing data services. Manufacturers embedding these systems at the factory level capture recurring revenue streams. This means telematics adoption directly changes how builders structure long-term customer contracts.</p
Let me continue with the remaining paragraphs to complete this section properly.
Aerodynamic trailer components are being adopted to improve fuel efficiency and lower emissions across long-haul fleets. This technology reduces operating costs for carriers without requiring engine or powertrain changes. Consequently, manufacturers offering aerodynamic add-ons appeal directly to cost-conscious fleet buyers. This creates a differentiated product tier above standard trailer configurations.
OEMs are integrating tire pressure monitoring and remote diagnostics directly into new trailer platforms. This integration reduces roadside breakdown incidents and unplanned maintenance costs for fleet operators. Therefore, this feature set becomes a baseline expectation among large fleet buyers negotiating volume contracts. Builders lacking this integration risk losing bids to competitors offering it standard.
Rising production of customizable multi-purpose trailers serves e-commerce and last-mile distribution networks specifically. This customization allows fleet operators to configure a single trailer platform for varied parcel and freight tasks. This flexibility reduces the number of trailer types a fleet must purchase and maintain. Manufacturers offering modular customization capture broader order volume from omnichannel logistics operators.
Drivers
The structural migration of retail consumption toward parcel and omnichannel fulfilment stands as the highest-magnitude force acting on baseline demand. This shift converts trailers from bulk line-haul assets into distributed inventory nodes positioned near demand clusters. Shippers moving toward power-only and drop-and-hook models require a materially larger trailer-to-tractor ratio, historically near 3 to 1 for large private fleets, which raises sustained replacement volume across the industry.
This reconfiguration shifts the underlying business model from asset-heavy ownership toward trailer-pooling and leasing arrangements. Deadhead miles compress by up to 15% under these models while replacement demand broadens across secondary distribution corridors. This means the demand base has moved from cyclical purchasing toward a durable, recurring order stream. Consequently, this reinforces the market’s stated 6.5% baseline CAGR rather than producing a temporary spike for manufacturers positioned in parcel-adjacent freight segments.
| Driver | (~) % Impact on CAGR Forecast | Geographic Relevance | Impact Timeline |
|---|---|---|---|
| E-commerce and last-mile freight density | +2.4% | North America, Asia Pacific | Medium term (2 to 4 years) |
| Capacity fleet replacement and aging trailer parc | +1.9% | North America, Europe | Medium term (2 to 4 years) |
| Reefer demand from cold chain and pharma logistics | +1.5% | Global | Long term (4 years or more) |
| Infrastructure and industrial output expansion | +1.2% | India, Southeast Asia, Middle East | Long term (4 years or more) |
| Lightweighting for payload and fuel efficiency | +0.8% | North America, Europe | Short term (2 years or less) |
Restraints
The extension of Section 232 derivative tariffs onto finished trailers creates the most acute near-term barrier by striking input cost and finished-goods pricing simultaneously. Dry van and refrigerated trailers under HTS 8716390040 became subject to derivative steel and aluminum duties effective August 18, 2025, layered atop the Section 232 metals rate that rose from 25% to 50% ad valorem on June 4, 2025. Finished-trailer classifications now carry the full 50% levy at entry.
Steel and aluminum can represent well over half of a trailer’s bill of materials, so this shock cascades into gross-margin compression estimated at 8% to 12% for builders unable to pass through cost. This pressure has forced OEMs to raise quoted unit prices at the exact moment carrier balance sheets are weakest. Therefore, confirmed backlog stalls and CapEx defers into future model years rather than sustaining the baseline replacement cycle that manufacturers depend on.
| Restraint | (~) % Impact on CAGR Forecast | Geographic Relevance | Impact Timeline |
|---|---|---|---|
| Section 232 steel and aluminum tariffs on trailers | -2.2% | North America | Short term (2 years or less) |
| Prolonged freight recession and weak carrier profitability | -1.8% | North America, Europe | Short term (2 years or less) |
| Elevated interest rates and equipment financing cost | -1.4% | Global | Medium term (2 to 4 years) |
| Fleet overcapacity and order cancellations | -1.1% | North America | Short term (2 years or less) |
| Freight rate compression suppressing CapEx | -0.9% | Global | Medium term (2 to 4 years) |
Challenges
The structural shortfall of certified welders creates the deepest ongoing friction on production throughput because trailer fabrication remains labor-intensive at the frame and subassembly stages. The sector needs more than 330,000 new welding professionals by 2028, with roughly 82,500 openings to fill annually, against an existing base near 771,000 practitioners as of 2024. Retirements of over 159,000 experienced workers have widened this gap further.
This deficit extends build lead times and drives wage inflation, with trailer welding pay sitting in the roughly 24 to 35 dollar per hour band and climbing. This compresses OEM operating margins and caps output even when order books recover. As a result, builders must fund robotic welding cells, apprenticeship pipelines, and automation retrofits, meaning this drag persists as a long-horizon scaling constraint rather than a cyclical hiring problem for manufacturers.
| Challenge | (~) % CAGR Friction Drag | Geographic Relevance | Mitigation Horizon |
|---|---|---|---|
| Skilled welder and technician deficit | -1.3% | North America, Europe | Long term (4 years or more) |
| Component and axle supply chain drag | -1.0% | Global | Medium term (2 to 4 years) |
| GHG Phase 3 compliance uncertainty | -0.9% | North America | Medium term (2 to 4 years) |
| Fragmented telematics interoperability | -0.6% | Global | Medium term (2 to 4 years) |
| Regional emission mandate divergence | -0.5% | Europe, North America | Long term (4 years or more) |
Opportunities
Smart trailer telematics represents untapped potential rather than an active driver because most of the installed trailer parc remains unconnected. This creates a retrofit and factory-embedding opportunity that converts a one-time hardware sale into recurring, high-margin data and service revenue. Connected penetration across the active trailer base still sits well below half, leaving a significant share of demand unmet across nearly every region.
The unit-economic shift is the core prize for early movers entering this space. Hardware attach carries thin single-digit margins, but the subscription layer for predictive maintenance and utilization analytics can sustain gross margins above 60%, potentially lifting per-unit lifetime contribution by 20% to 30%. This signals that manufacturers building recurring service revenue now will capture a sizable share of the addressable base before connectivity becomes a commoditized baseline feature.
| Opportunity | (~) % Potential CAGR Upside | Geographic Relevance | Execution Window |
|---|---|---|---|
| Smart trailer telematics and data monetization | +2.1% | Global | Medium term (2 to 4 years) |
| Trailer-as-a-service and pooling subscription models | +1.6% | North America, Europe | Medium term (2 to 4 years) |
| Emerging market fleet formalization | +1.3% | India, Southeast Asia, Africa | Long term (4 years or more) |
| Aftermarket retrofit and refurbishment roll-ups | +1.0% | North America, Europe | Medium term (2 to 4 years) |
| Autonomous-ready and electrified trailer platforms | +0.7% | North America, Europe | Long term (4 years or more) |
Key Company Insights
Wabash National Corporation holds a structural advantage through vertical expansion into trailer-adjacent technology and services. Its acquisition of TrailerHawk.ai in February 2025 strengthened its Trailers as a Service offering with cargo security and smart trailer capabilities. This positions Wabash to capture recurring service revenue rather than relying solely on unit sales, a structural edge in a market where the trucking sector supported 8.4 Million jobs, including 3.58 Million professional drivers, in 2024.
Hyundai Translead is scaling physical capacity to meet replacement demand directly. Its March 2026 announcement of a major Illinois manufacturing expansion, adding two new facilities and approximately 2,500 jobs, signals confidence in sustained order volume. This expansion arrives as 91.5% of U.S. trucking carriers operate fleets of ten or fewer trucks, meaning Hyundai Translead’s scale advantage lets it serve both large accounts and fragmented small carriers efficiently. The U.S. Bureau of Transportation Statistics publishes the official truck tonnage index that tracks this demand base.
Key Players
- Wabash National Corporation
- Great Dane Trailers / Great Dane LLC
- Utility Trailer Manufacturing Company
- Schmitz Cargobull AG
- Krone Commercial Vehicle Group
- Kögel Trailer GmbH & Co. KG
- China International Marine Containers
- Hyundai Translead
- Polar Tank Trailer, LLC
- Fontaine Commercial Trailer, Inc.
- Lamberet SAS
- Stoughton Trailers, LLC
- MAN Truck & Bus SE
- Mac Trailer Manufacturing, Inc.
- Manac Inc.
Recent Developments
- March 2025: Wabash unveiled its 2026 DuraPlate Dry Van trailer with standard REAR-VU backup camera integration and expanded digital trailer solutions at TMC 2025.
- September 2025: Wabash partnered with Global Tank to expand its tank trailer sales and service network across North America.
- March 2026: Hyundai Translead launched a new 10-Year Warranty Trailer program, introducing an extended warranty offering for commercial trailer customers.
Geopolitical Impact Analysis
Global tariff escalation is reshaping trailer manufacturing costs directly through metals policy. According to the World Trade Organization, tariff disputes over steel and aluminum have pushed input costs higher across North American supply chains, with the governing Section 232 metals rate rising from 25% to 50% ad valorem in 2025. As reported by the World Shipping Council, container and component shipping delays have added several days to cross-border parts delivery. This connects directly to trailer axle and steel frame sourcing, raising build costs and delaying delivery schedules for manufacturers.
Energy volatility compounds this pressure on trailer logistics and pricing. Data from the IEA shows fuel price swings have added cost variability to long-haul freight operations reliant on diesel powered tractors pulling these trailers. As per the World Bank, commodity price shifts in steel and aluminum markets have moved input costs by double-digit percentages within a single year. This means manufacturers face compounding pressure from both trade policy and raw material volatility simultaneously, pushing builders toward long-term supply contracts to stabilize pricing.
Report Scope
| Report Features | Description |
|---|---|
| Market Value (2025) | USD 37.3 Billion |
| Forecast Revenue (2035) | USD 70.2 Billion |
| CAGR (2026-2035) | 6.5% |
| Base Year for Estimation | 2025 |
| Historic Period | 2020-2024 |
| Forecast Period | 2026-2035 |
| Report Coverage | Revenue Forecast, Market Dynamics, Market Opportunity Analysis, Technology and Innovation Landscape, Competitive Landscape, Recent Developments |
| Segments Covered | By Type (Dry Van, Flatbed, Refrigerated, Lowboy, Tanker, Others), By Tonnage (25-50 T, 51-100 T, Below 25 T, Above 100 T), By Length (28-45 Ft, Above 45 Ft, Below 28 Ft, Pouches and Others), By End-Use (Transportation and Logistics, Construction and Heavy Industry, Food and Beverage/Cold-Chain, Oil and Gas/Chemicals/Bulk Materials, Automotive, Healthcare and Other Services) |
| Regional Analysis | North America (US and Canada), Europe (Germany, France, The UK, Spain, Italy, and Rest of Europe), Asia Pacific (China, Japan, South Korea, India, Australia, and Rest of APAC), Latin America (Brazil, Mexico, and Rest of Latin America), Middle East and Africa (GCC, South Africa, and Rest of MEA) |
| Competitive Landscape | Wabash National Corporation, Great Dane Trailers, Utility Trailer Manufacturing Company, Schmitz Cargobull AG, Krone Commercial Vehicle Group, Kögel Trailer GmbH & Co. KG, China International Marine Containers, Hyundai Translead, Polar Tank Trailer LLC, Fontaine Commercial Trailer Inc., Lamberet SAS, Stoughton Trailers LLC, MAN Truck & Bus SE, Mac Trailer Manufacturing Inc., Manac Inc. |
| Customization Scope | Customization for segments, region / country-level will be provided. Additional customization can be done based on requirements. |
| Purchase Options | We have three licenses to opt for: Single User License | Multi-User License (Up to 5 Users) | Corporate Use License (Unlimited User and Printable PDF) |





































