
Quick Navigation
- Introduction
- Editor’s Choice
- General E-commerce Websites Statistics and Facts
- Shopify Statistics
- Google Shopping Statistics
- Email E-commerce Statistics
- E-commerce Consumer Behaviour Statistics
- E-commerce Conversion Rate Statistics
- Platform and Technology Statistics
- E-commerce Payment Statistics
- Social Media E-commerce Statistics
- Future E-commerce Technology Trends
- E-commerce Websites Fun Facts
- Recent Developments
- E-commerce Future Predictions
- Conclusion
Introduction
E-commerce Websites Statistics: E-commerce has evolved into a crucial component of global retail. Similar to various other sectors, the process of buying and selling products has experienced a significant change with the rise of the internet. Furthermore, due to the continuous digitalization of contemporary life, consumers around the globe are now able to enjoy the benefits of online transactions.
As worldwide internet access and usage grow rapidly, with more than five billion internet users globally, the number of individuals making online purchases continues to rise. By 2025, retail e-commerce sales are projected to surpass 4.3 trillion U.S. dollars globally, and this amount is anticipated to reach unprecedented levels in the forthcoming years.
Global e-commerce sales are expected to hit $8 trillion by 2027, with over 28 million e-commerce websites functioning worldwide as of 2025. Mobile devices constitute 59% of e-commerce traffic, while digital wallets are the favored payment option, accounting for 53% of online transactions. Major consumer preferences include prompt and complimentary shipping, secure payment options, and user-friendly website experiences, with 40% of consumers abandoning sites that take longer than 3 seconds to load.
Editor’s Choice
- China’s e-commerce sector, valued at $3.19 trillion, ranks as the largest globally.
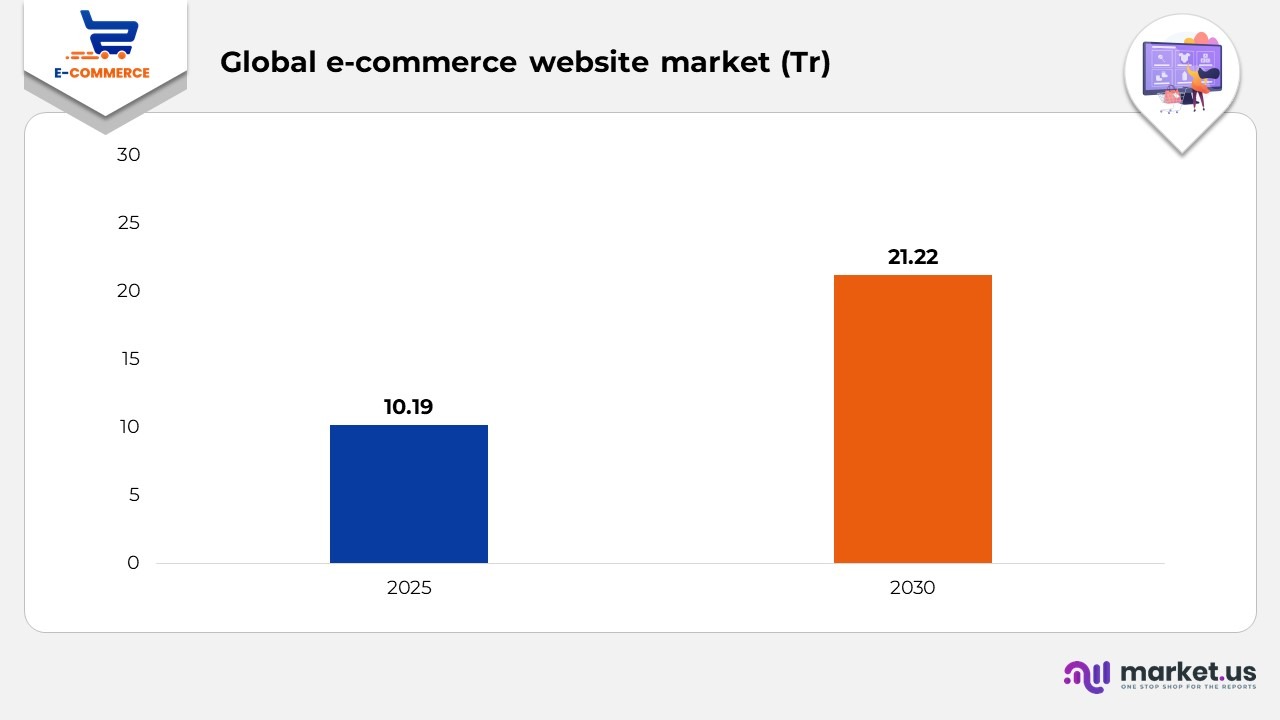
- The global e-commerce website market is projected to attain USD 10.19 trillion by 2025, exhibiting a compound annual growth rate (CAGR) of 15.80%, and is anticipated to escalate to USD 21.22 trillion by 2030.
- 4% represents the typical conversion rate for Shopify stores.
- Google Shopping produces approximately 1.2 billion searches each month.
- Email marketing yields $40 for every $1 invested, resulting in a 4400% return on investment.
- 75% of shoppers initiate their journey with a Google search.
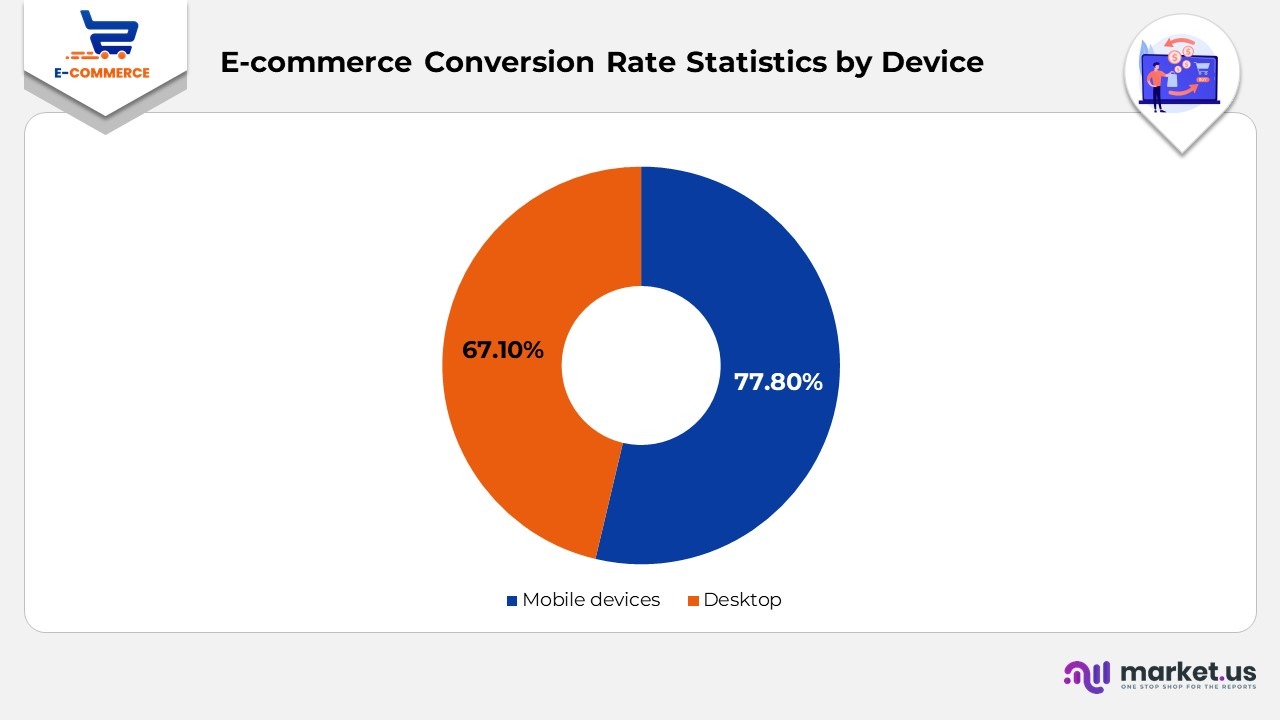
- The abandonment rate of shopping carts on mobile devices stands at 77.8%, while on desktop it is 67.1%.
General E-commerce Websites Statistics and Facts
- The global e-commerce website market is projected to attain USD 10.19 trillion by 2025, exhibiting a compound annual growth rate (CAGR) of 15.80%, and is anticipated to escalate to USD 21.22 trillion by 2030.
- More than one-third (33%) of the global populace engages in online shopping, underscoring the growing adaptability and accessibility of e-commerce.
- Almost two-thirds of eCommerce revenue is derived from the electronics, fashion, and DIY sectors, with electronics at the forefront due to high-value products such as smartphones, laptops, and household appliances.
- China’s eCommerce sector, valued at $3.19 trillion, ranks as the largest globally.
- Key players in the e-commerce landscape include Alibaba, Amazon, Walmart, JD.com, and Costco.
- Amazon leads the U.S. eCommerce market, holding a 37.6% market share.
- With an average of 2.48 billion visits per month, Amazon continues to be the most visited e-commerce platform.
- Between 75% and 90% of consumers prefer utilizing chatbots for prompt responses and support.
- Over 90% of Americans are either currently using or are receptive to using augmented reality (AR) for shopping, emphasizing the essential role of incorporating advanced technology in eCommerce.
- Despite its expansion, eCommerce encounters notable challenges, including elevated cart abandonment rates, with 45% of Gen Z consumers indicating high prices as the main factor.
- Consumer behavior indicates that 99.9% of shoppers review feedback prior to making online purchases, highlighting the crucial influence of social proof on purchasing choices.
- The future outlook for e-commerce is optimistic, with online retail sales projected to exceed $6.86 trillion by 2025 and grow at a CAGR of 7.8% through 2027.
Shopify Statistics
- 4% represents the typical conversion rate for Shopify stores.
- On average, a Shopify store generates $67,000 in revenue.
- Shopify has created an economic impact exceeding $307 billion globally.
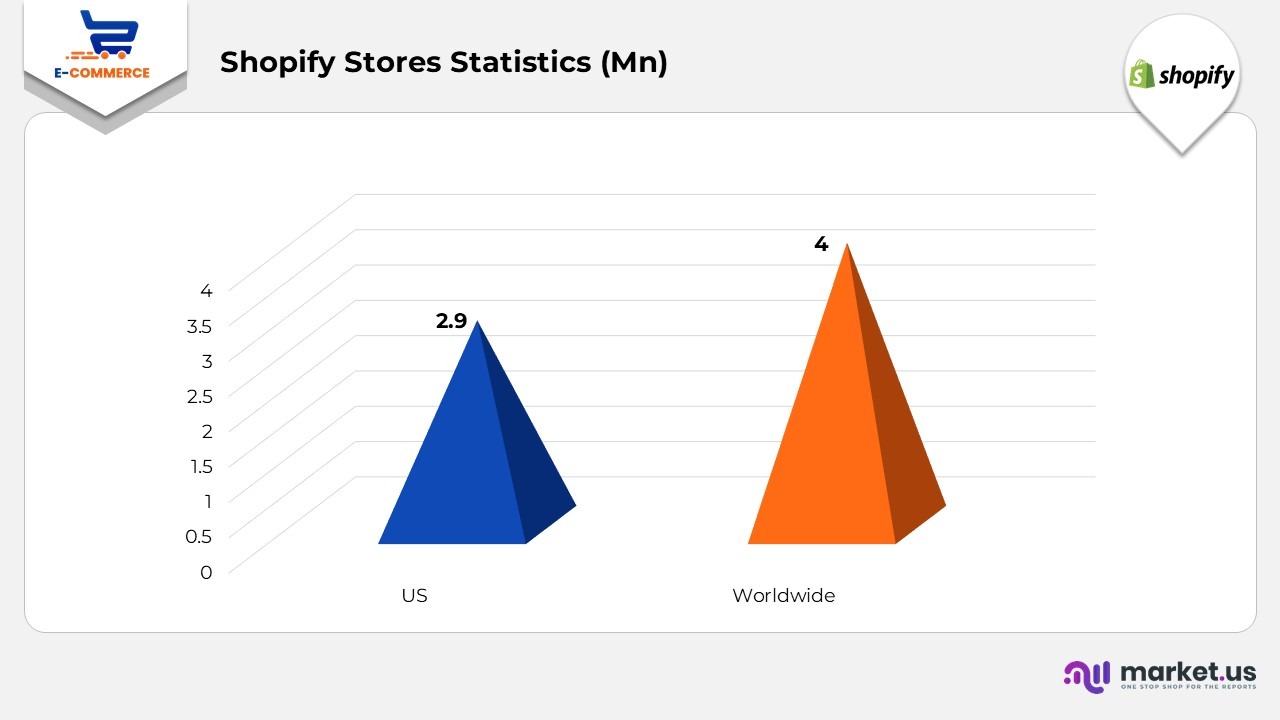
- Shopify supports over 4 million stores worldwide.
- In 2022, Shopify stores averaged $72 in revenue per customer.
- Shopify boasts more than 2.1 million daily users.
- The workforce at Shopify consists of over 7, 000 individuals.
- As of January 2024, more than 4.8 million websites operate on Shopify across 175 countries.
- The United States accounts for the majority of Shopify stores, totaling 2,907,545.
Google Shopping Statistics
- Google Shopping produces approximately 1.2 billion searches each month.
- A recent study revealed that Amazon holds the top position on Google Shopping 52% of the time.
- Google Shopping has been demonstrated to achieve conversion rates that are 30% higher than those of text advertisements.
- Among all potential ranking factors, it was determined that a higher domain rating in Ahrefs correlates with an increased likelihood of ranking on Google Shopping.
- The typical ad conversion rate on Google Shopping is below 2%.
- Data indicates that clicks on Google Shopping have risen by more than 17% annually.
Email E-commerce Statistics
- Email marketing yields $40 for every $1 invested, resulting in a 4400% return on investment.
- A significant 81% of small enterprises continue to depend on emails as their main method for acquiring customers.
- In the realm of e-commerce, email pop-ups achieve an average conversion rate of approximately 4.76%.
- Among the leading online retailers in the United States, 58% send out welcome emails.
- The open rate for these welcome emails stands at 68.6%.
- Emails that are personalized see open rates that are 50% higher.
- A notable 49% of online consumers express a desire to receive promotional emails on a weekly basis from their preferred brands.
- Email marketing accounts for 20% of the traffic that drives e-commerce sales.
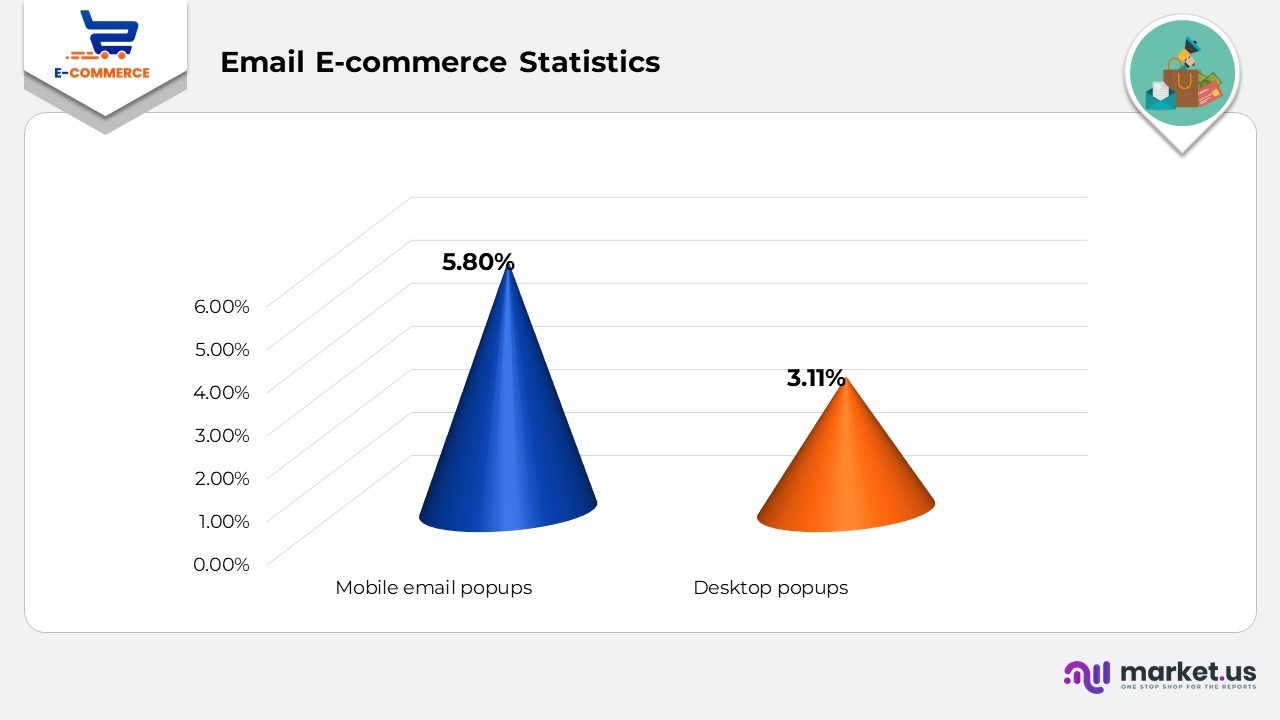
- Mobile email popups generally convert at a rate of 5.8%, whereas desktop popups convert 3.11% of users.
- 60% of consumers acknowledged that they had purchased as a result of an email received from a brand.
- The average open rate for abandoned cart emails is 45%.
E-commerce Consumer Behaviour Statistics
- 75% of shoppers initiate their journey with a Google search.
- 39% of consumers who make purchases online prefer to use PayPal.
- 43% of online buyers reported that they frequently make purchases while in bed.
- As of 2022, 56.6% of survey participants in the United States expressed a preference for online shopping.
- 51% favor ecommerce businesses that offer live chat support.
- In 2023, two point 64 billion consumers engaged in online shopping.
- Half of the individuals who utilized search engines prior to shopping sought information regarding the store itself, including its location.
- Moreover, over 60% of shoppers indicated a preference for stores that have physical locations.
- 43% of e-commerce traffic is derived from organic Google searches.
- Personalized content has the potential to boost revenue by more than 25% and enhance a customer’s likelihood of spending over 40% more than they initially intended.
- Approximately 80% of online shoppers purchase at least once a month.
- 53% of online shoppers assert that they will always conduct research online prior to making a purchase.
- Individuals aged 25 to 34 years represent the largest demographic of online shoppers.
- In 2023, the shopping cart abandonment rate reached 79.53%.
- 48% of users abandoned their carts during the checkout process due to high additional costs.
- 49% of customers purchased a product they had not intended to buy as a result of receiving a personalized product recommendation.
- Over 75% of consumers reported making unintentional online purchases due to the convenience associated with online shopping.
- On average, ecommerce users purchase 4.10 products per order.
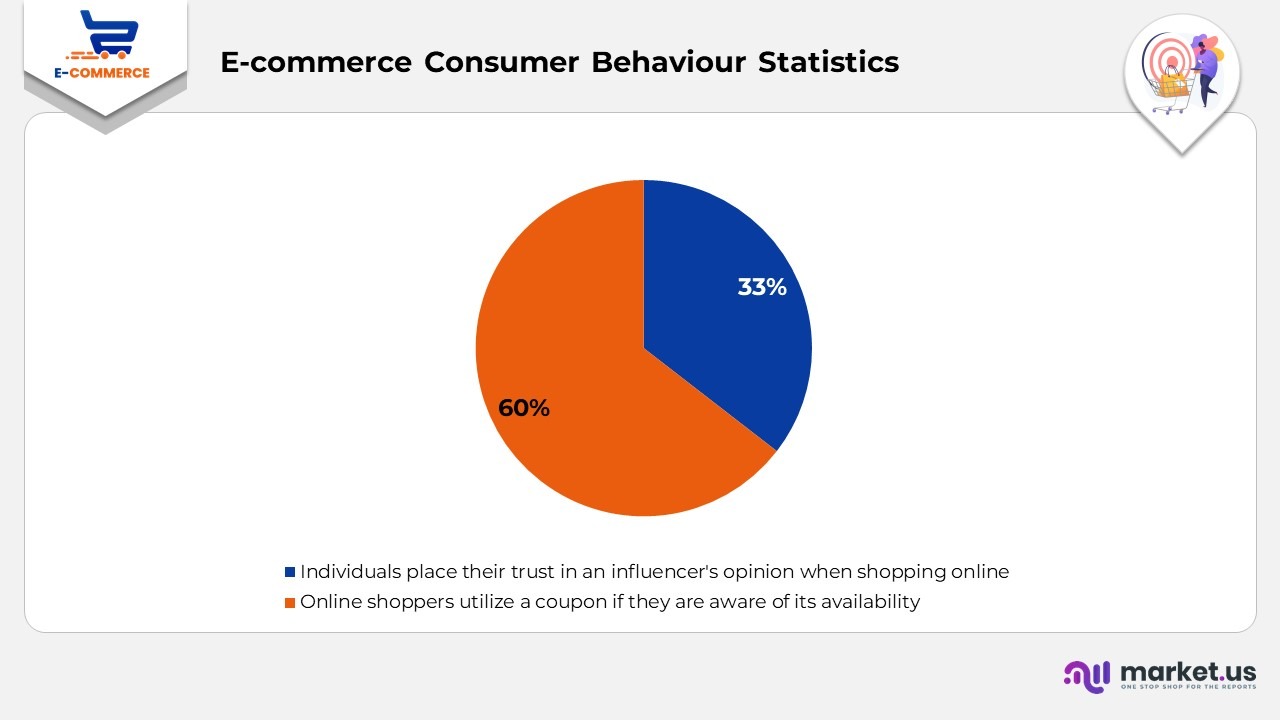
- 33% of individuals place their trust in an influencer’s opinion when shopping online.
- 60% of online shoppers utilize a coupon if they are aware of its availability.
E-commerce Conversion Rate Statistics
- The abandonment rate of shopping carts on mobile devices stands at 77.8%, while on desktop it is 67.1%.
- On average, 69.82% of shopping carts are left unpurchased.
- The average conversion rate for organic ecommerce leads is 14.6%.
- A study conducted in 2022 revealed that product listings featuring reviews saw a 38% increase in conversion rates for electronics and home appliances, and a 23% increase for online clothing retailers.
- Online gift shops boast the highest conversion rate, approximately 5%.
- The food and beverage sector also enjoys a significant e-commerce conversion rate of 4.95%.
- Google Ads campaigns yield $8 in revenue for every $1 invested by ecommerce businesses.
- Ecommerce firms realize the highest return on investment from email marketing, averaging $36 for every $1 spent.
- Google My Business listings are recognized as the premier online review platform for consumers shopping online.
- Ecommerce businesses experienced a 144% increase in conversion rates attributed to user engagement with product reviews.
- Research shows that consumers are likely to spend about 31% more on products and services from ecommerce businesses that have positive reviews.
- 57% of consumers refrain from making purchases from an online business if it has a rating lower than 4 stars.
Platform and Technology Statistics
- More than 80% of ecommerce websites are constructed using open-source or SaaS platforms.
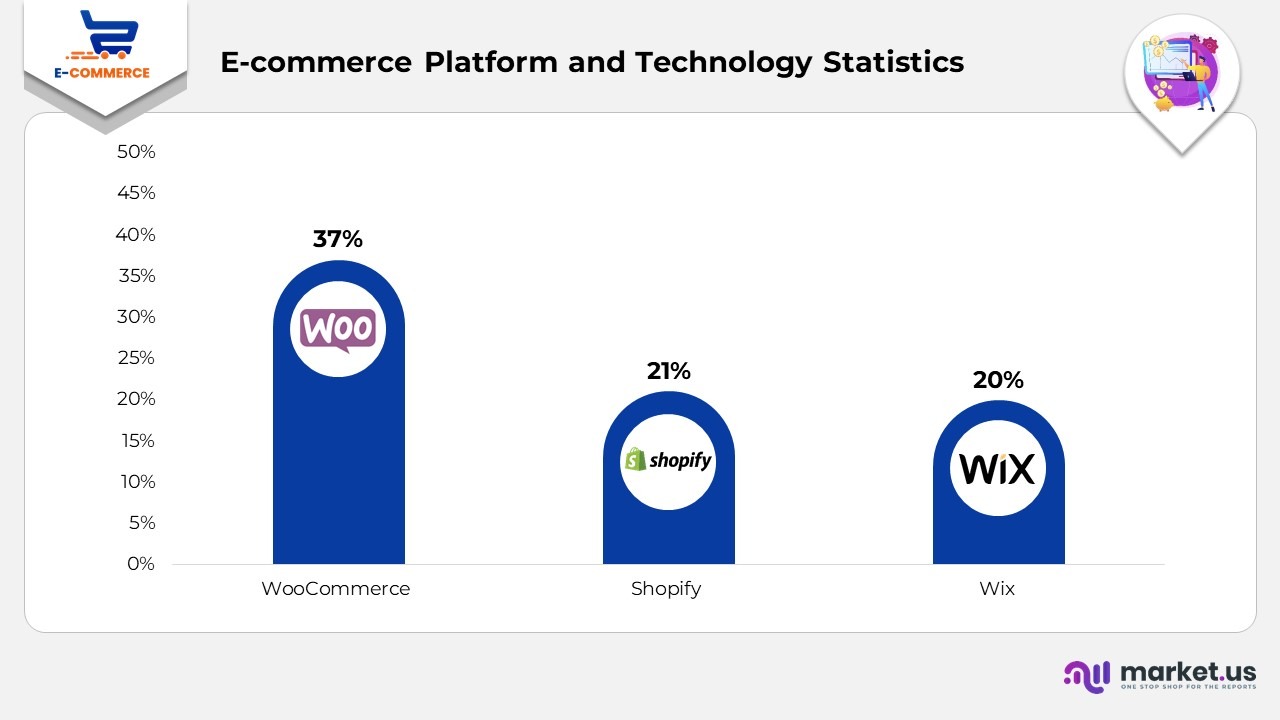
- WooCommerce is the global leader with a 37% market share and 6.5 million active stores.
- Shopify commands 21% of the worldwide platform market, serving over 4 million merchants.
- Wix and Squarespace together represent more than 20% of ecommerce sites for small businesses.
- Magento (Adobe Commerce) supports over 200,000 active stores worldwide, primarily in the enterprise sector.
- The adoption of SaaS-based ecommerce has increased by 40% in the past three years.
- Headless commerce solutions currently drive 15% of high-traffic ecommerce websites.
- 68% of ecommerce companies utilize AI-driven personalization and predictive analytics.
- By 2026, 42% of retailers intend to invest in augmented reality and virtual reality shopping features.
E-commerce Payment Statistics
- Digital payments currently represent more than 80% of online transactions worldwide.
- Mobile wallets like Apple Pay, Google Pay, and PayPal lead the preferences for global payments.
- Transactions involving BNPL (Buy Now, Pay Later) are anticipated to hit USD 500 billion globally by 2025.
- The acceptance of cryptocurrency payments by online stores has risen to 12%, an increase from just 4% in 2022.
- More than 65% of Gen Z consumers favor mobile wallets over conventional credit cards.
- The average rate of cart abandonment for checkout processes that exceed 90 seconds is over 70%.
- Ecommerce fraud losses amounted to USD 48 billion in 2024, leading to a broader implementation of 3D Secure and tokenized payment systems.
Social Media E-commerce Statistics
- There are roughly 4.9 billion users of social media across the globe.
- Nearly 30% of internet users in the United States have made purchases directly through a social media platform.
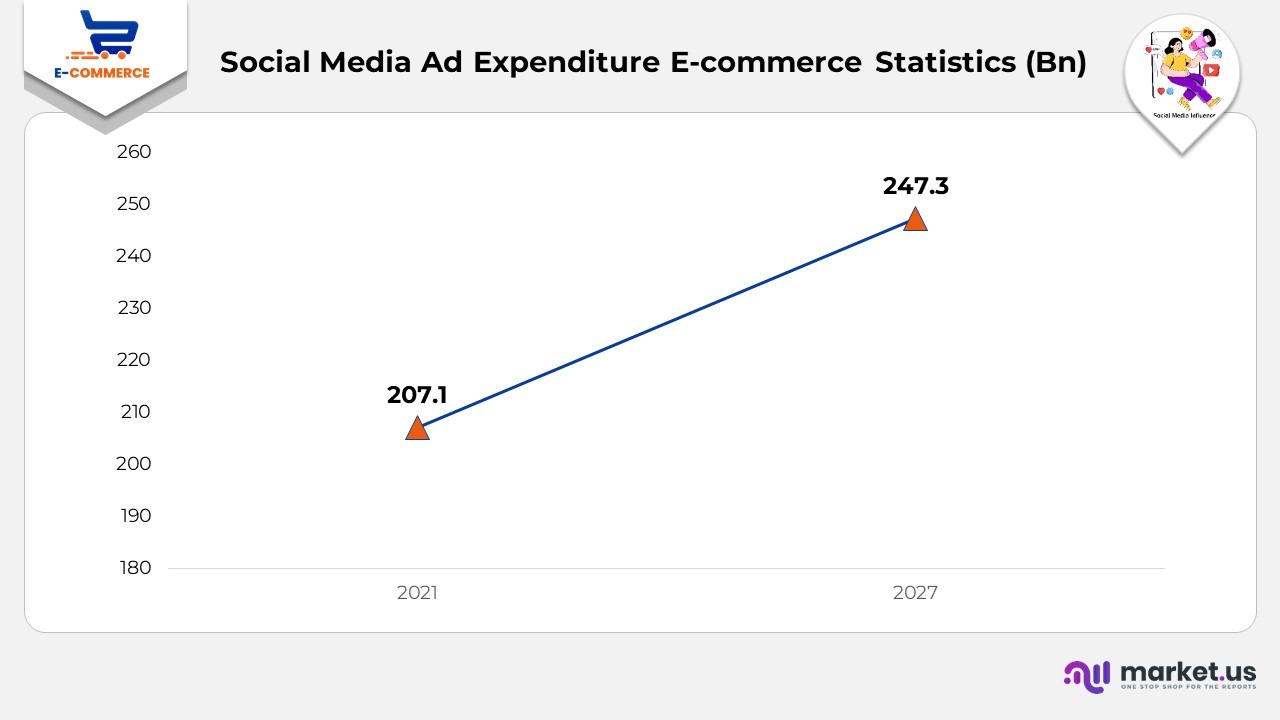
- In 2021, the total expenditure on social media advertising worldwide reached $207.10 billion.
- From 2023 to 2027, the growth rate of ad spending on social media is projected to be 4.53% CAGR.
- By the end of 2027, the expenditure on social media advertising is expected to rise to $247.30 billion.
- The United States leads in social media ad spending, amounting to $72.33 billion as of 2023.
Future E-commerce Technology Trends
- Artificial Intelligence and automation are anticipated to drive almost 50% of all ecommerce operations by the year 2027.
- Voice commerce is forecasted to surpass USD 50 billion in yearly transactions by 2025.
- The utilization of 3D product visualization and augmented reality-enabled try-ons has led to a 40% increase in conversion rates.
- More than 60% of online retailers are currently experimenting with AI chatbots to automate customer service.
- The adoption of blockchain technology for enhancing supply chain transparency is projected to rise by 25% each year.
- Currently, 35% of ecommerce enterprises are employing predictive analytics to anticipate demand and minimize returns.
E-commerce Websites Fun Facts
- In just one minute, 1.1 million dollars were expended on online shopping in the year 2020.
- Search engines emerged as the most favored source of inspiration for online shopping globally in 2020.
- com ranked as the foremost online retail platform, followed by ebay.com and Rakuten.co.jp worldwide until July 2020, primarily due to the pandemic.
- More than 80% of the global online population has engaged in online purchasing.
- Mobile devices represent approximately 70% of visits to e-commerce websites.
- In 2020, around 88% of online shopping carts were left abandoned.
Recent Developments
- Recent advancements in e-commerce for 2024 encompass the extensive integration of AI for personalized experiences, the ongoing expansion of social commerce and livestream shopping, as well as an emphasis on sustainability and privacy.
E-commerce Future Predictions
- Artificial Intelligence and automation are projected to drive almost 50% of all e-commerce activities by the year 2027.
- It is anticipated that social commerce will attain a value of $2.9 trillion by 2026.
Conclusion
E-commerce platforms have become a leading influence in the retail sector, with worldwide sales anticipated to surpass $7.9 trillion by the end of 2025, accounting for more than 25% of overall retail sales. This industry’s expansion is driven by a substantial and increasing base of online shoppers, the growth of mobile commerce, social shopping trends, and direct-to-consumer (D2C) strategies.
Significant trends encompass the necessity for mobile optimization, the emergence of artificial intelligence for personalized experiences, the vital impact of customer reviews, and the persistent issue of cart abandonment, which is influenced by factors such as elevated costs and complex checkout processes.