


Report Overview
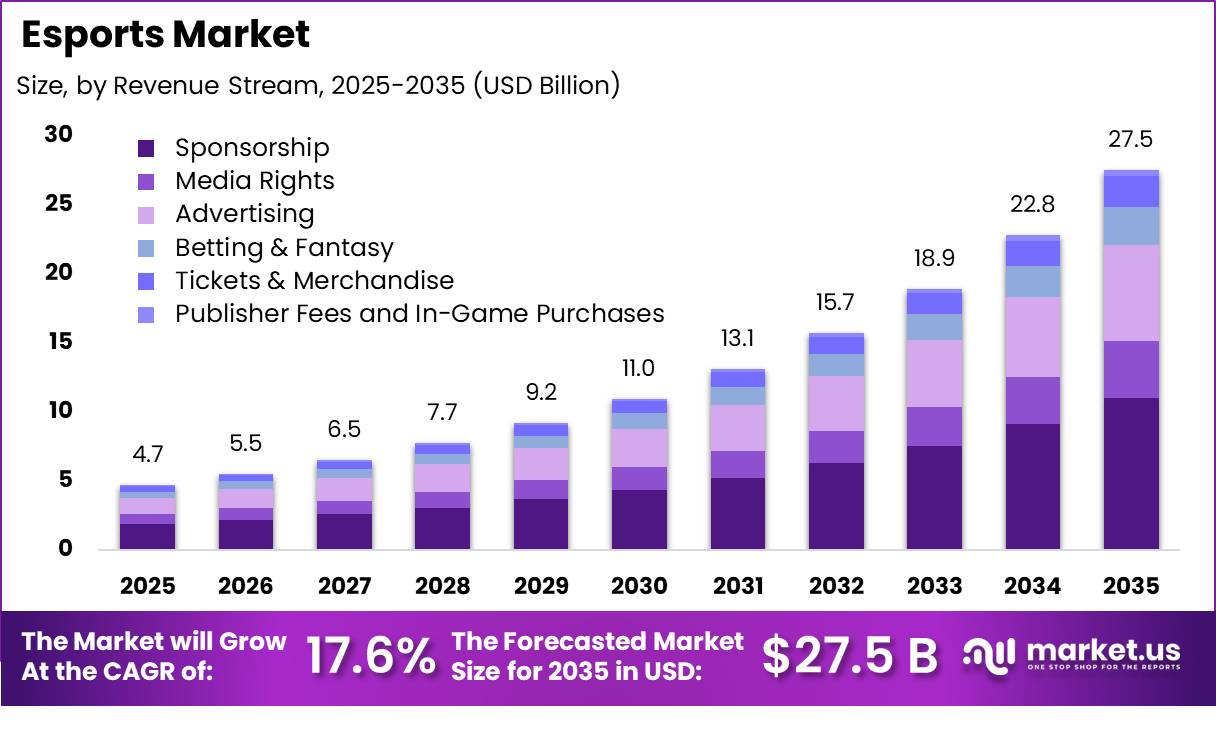
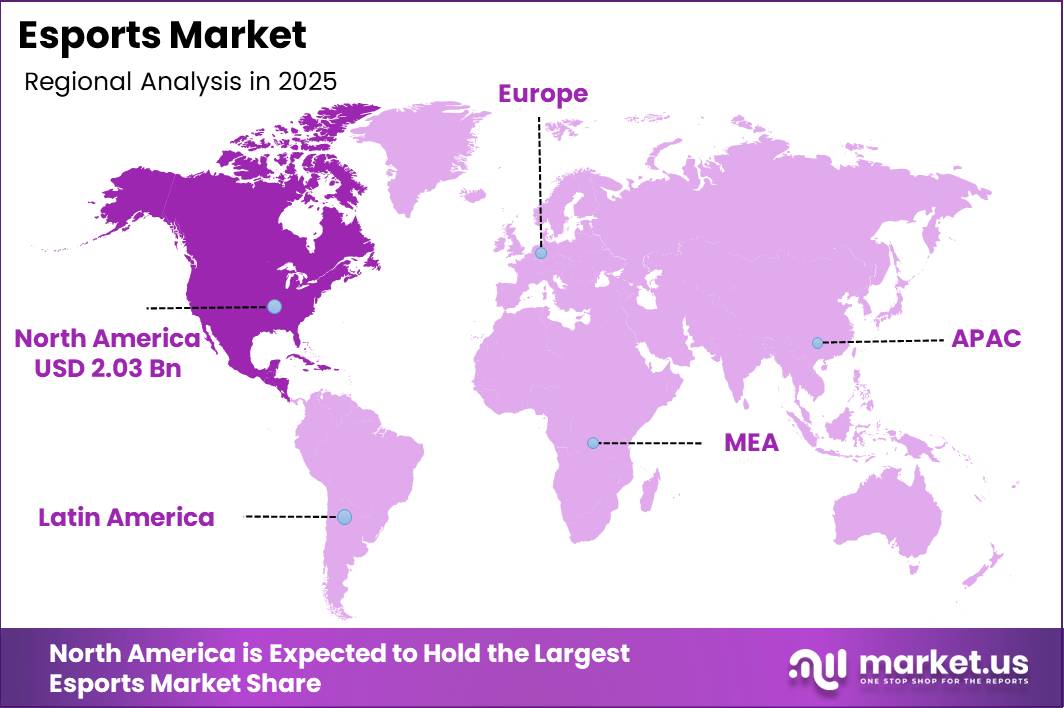
In 2025, the Global Esports Market was valued at USD 4.7 billion. The market is projected to grow at a CAGR of 17.6% during 2026–2035, reaching approximately USD 27.5 billion by 2035. North America dominated the global market in 2025, accounting for more than 43.0% of the total market share and generating approximately USD 2.03 billion in revenue.
North America emerged as the leading regional market in the esports industry, driven by its strong ecosystem and widespread industry adoption. The region benefits from high consumer spending, strong broadband access, mature gaming platforms, and valuable advertising audiences. The United States and China together account for nearly half of global consumer gaming spending, while the U.S. gaming market alone exceeds USD 49 billion.
This creates favourable conditions for premium esports leagues, live events, streaming services, and major brand partnerships. Over the next decade, an additional 2–3% shift from the U.S. gaming and interactive media market toward esports could generate several billion dollars in added revenue and support North America’s continued market leadership.
Key Takeaway
- The Esports Market is projected to grow from USD 4.7 billion in 2025 to USD 27.5 billion by 2035, registering a 17.6% CAGR.
- Sponsorship leads the esports revenue model with around a 40% share, supported by strong brand spending across sports and entertainment.
- Live streaming dominates esports content delivery with approximately a 58.3% share, driven by real-time competition and audience interaction.
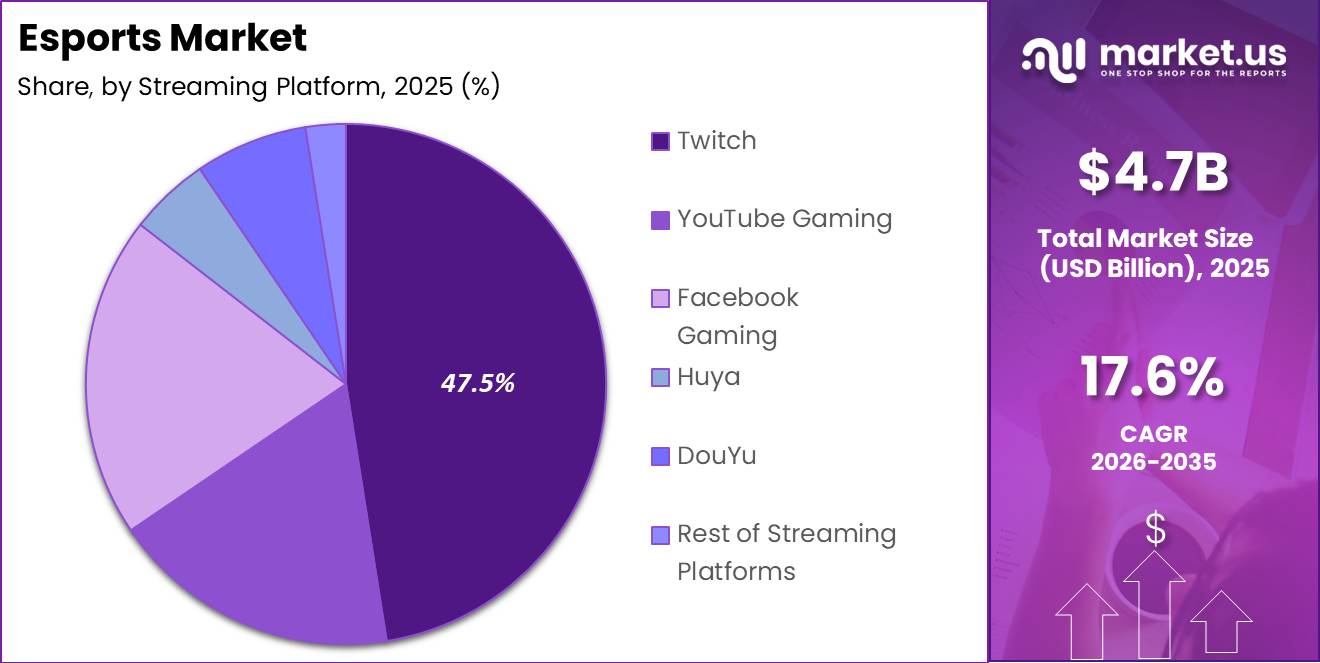
- Twitch leads esports streaming platforms with around a 47.5% share, supported by its large and highly engaged gaming audience.
- Smartphones dominate esports devices with nearly a 49% share, owing to their accessibility and widespread use for gaming and video streaming.
- MOBA games lead the esports genre category with around 36.5% share, supported by strategic gameplay, teamwork, and structured competitions.
- North America dominated the esports market with a 43.0% share and approximately USD 2.03 billion in revenue.
By Revenue Stream
Sponsorship accounts for around 40% of esports revenue, supported by the large global spending pool for sports and entertainment marketing. Worldwide sponsorship rights fees reached approximately USD 97.5 billion in 2024, while sports sponsorship spending was projected to approach USD 115 billion by 2025.
Esports gives brands direct access to young, digitally active audiences through team jerseys, tournament naming rights, in-game advertising, and live-stream overlays. Even a small transfer from the wider USD 100+ billion sponsorship market can generate substantial revenue for esports teams, event organizers, prize pools, and content producers.
Betting and fantasy esports are the fastest-growing segments, expanding at a CAGR of 5.5%, supported by the wider legalization of sports wagering across digital platforms. U.S. sports betting revenue reached USD 16.9 billion in 2025, while total legal wagers amounted to USD 166.9 billion.
State tax revenue from sports betting increased by more than 380% between 2021 and mid-2025, reflecting stronger consumer participation. Frequent matches, real-time performance data, and structured tournaments are further supporting esports betting and fantasy engagement.
By Streaming Type
Live streaming dominates esports streaming with around a 58.3% share, as fans prefer watching competitions and interacting with players in real time. In 2024, viewers consumed nearly 32.5 billion hours of live-streamed content across platforms such as Twitch and YouTube Gaming. Twitch represented approximately 61% of total live-stream viewing and generated more than 20 billion hours watched.
These figures show that live video remains the main format for esports tournaments, professional leagues, and creator-led matches. Live events also give advertisers valuable opportunities to display sponsorships, branded overlays, and interactive promotions during finals and important in-game moments, increasing revenue per viewing hour.
By Streaming Platform
Twitch dominates esports streaming with around a 47.5% share, supported by its large and highly engaged audience for live gaming content. In 2024, viewers watched more than 15–21 billion hours of gaming content on Twitch, while the platform captured over 60% of the global game live-streaming audience.
Facebook Gaming is the fastest-growing platform segment, expanding at a CAGR of 5%, supported by its integration with a large global social network and mobile user base. Gaming streams, short clips, and creator content can be distributed directly through Facebook feeds, improving content discovery without requiring users to download a separate application.
By Device Type
Smartphones dominate the esports device segment with around a 49% share, supported by their wide global availability and role as the main gateway to gaming, video, and internet services. In 2025, the world recorded 9.2 billion mobile-cellular subscriptions, equal to 112 subscriptions per 100 people, along with 99 mobile-broadband subscriptions per 100 people.
Mobile technologies and services also contributed nearly USD 7.6 trillion, or 6.4% of global GDP. Mobile games generated approximately USD 81.8 billion in 2025, supported by more than 50 billion downloads and billions of gameplay hours. This large user base makes smartphones the preferred platform for free-to-play games, casual competitions, esports streaming, and in-app purchases.
Gaming consoles are expanding faster because they attract high-spending users and support longer competitive sessions. Global PC and console game spending reached about USD 80.2 billion in 2024, including nearly USD 42.8 billion from console games. Console revenue was projected to increase to around USD 45.9 billion in 2025 and exceed USD 51 billion by 2027. PlayStation 5 shipments reached approximately 77.7 million units by early 2025, while Nintendo hybrid systems surpassed 156 million units.
By Game Genre
MOBA games dominate the esports genre segment with around a 36.5% share, supported by their strategic gameplay, team coordination, and clear match objectives. League of Legends maintained an estimated 117–135 million monthly active PC players during 2024–2025, showing the long-term popularity of competitive MOBA titles.
Dota 2 also supports major professional events, including The International, which recorded a prize pool of approximately USD 2.6 million in 2024. Large player communities and high-value tournaments create strong opportunities for sponsorships, media rights, advertising, and digital item sales. Fixed team sizes, defined player roles, and balanced maps also allow professional leagues to organize hundreds of matches per season under consistent rules.
Battle Royale is the fastest-growing game segment, expanding at a CAGR of 5%, supported by large player lobbies, unpredictable outcomes, and strong live-streaming appeal. PUBG Mobile generated approximately USD 1.1 billion in 2024 and averaged nearly 25 million daily active users on its international application. When combined with its Chinese and Indian versions, the franchise’s daily user base exceeded 90 million, strengthening demand for livestreams, highlights, and short-form gaming content.
Key Market Segments
By Revenue Stream
- Sponsorship
- Media Rights
- Advertising
- Betting & Fantasy
- Tickets & Merchandise
- Publisher Fees and In-Game Purchases
By Streaming Type
- On-demand
- Live Streaming
By Streaming Platform
- Twitch
- YouTube Gaming
- Facebook Gaming
- Huya
- DouYu
- Rest of Streaming Platforms
By Device Type
- Smartphones
- Desktop/Laptop
- Gaming Consoles
By Game Genre
- MOBA
- Battle Royale
- First Person Shooter (FPS)
- Real-Time Strategy (RTS)
- Sports and Racing
- Fighting
- Other
Geopolitical Impact Analysis
Geopolitical tensions are increasing the cost and reducing the availability of hardware and connectivity equipment used across the esports market. Under renewed U.S.–China trade tensions, duties on selected Chinese products have reached up to 245%, while electronics from China remain subject to sector-specific tariffs of 20%, even after many import tariffs were reduced to a 30% baseline.
China’s applied tariff on smartphones is around 3.7%, while integrated circuits used in CPUs and GPUs face rates of approximately 1.6% to 3.0%. Additional tariffs can therefore raise the landed cost of gaming PCs, consoles, smartphones, routers, peripherals, and broadcasting equipment.
Shipping disruptions in the Red Sea, Black Sea, and Panama Canal have extended transit times by nearly 10–15 days on major Asia–Europe and Asia–Americas routes. Vessel rerouting increases fuel use, insurance charges, and freight expenses, contributing to spot-rate increases of several hundred dollars per TEU during 2020–2024. Energy volatility adds further pressure, as crude oil prices have recorded increases of more than 30% year-on-year during periods of Middle East tension.
Export controls and sanctions on advanced chips have reportedly increased production costs for premium GPUs and consoles by approximately 14%. Lead times for high-end graphics cards also expanded from around 6 weeks in early 2025 to nearly 18 weeks in 2026. A 14% hardware-cost increase, combined with double-digit freight surcharges, may force esports organizers to raise sponsorship and media-rights fees, reduce event frequency, or delay equipment upgrades.
Regional Analysis
North America dominates the global esports market with around a 43.0% share, generating approximately USD 2.03 billion in revenue. The region benefits from strong consumer spending, advanced broadband networks, mature media platforms, and close links with traditional sports.
The United States contributes most of the regional value through franchised leagues, professional teams, arena-based tournaments, and major brand sponsorships. Its wider commercial gaming industry generated more than USD 70–72 billion in annual revenue in 2024, creating a large base of advertisers, broadcasters, streaming companies, and media-rights buyers.
Asia Pacific is the fastest-growing esports region. Growth in Asia Pacific is supported by China’s large PC and mobile gaming population, rising participation in India, and established console and mobile gaming markets in Japan and South Korea. The region already accounts for close to one-third of global esports revenue under some estimates, positioning it as the main growth engine while North America remains the largest regional contributor by value.
Key Regions and Countries
North America
- US
- Canada
Europe
- Germany
- France
- The UK
- Spain
- Italy
- Rest of Europe
Asia Pacific
- China
- Japan
- South Korea
- India
- Australia
- Rest of APAC
Latin America
- Brazil
- Mexico
- Rest of Latin America
Middle East & Africa
- GCC
- South Africa
- Rest of MEA
Market Dynamics
Drivers
| Driver | (~) % CAGR | Geographic Relevance | Impact Timeline |
|---|---|---|---|
| Large-scale youth digital engagement | +3.0% | Global | Short term (2 years or less) |
| Mainstream brand sponsorship adoption | +2.2% | North America & Europe | Medium term (2 to 4 years) |
| Smartphone & broadband penetration | +1.8% | Asia Pacific & Latin America | Short term (2 years or less) |
| Platform-level monetization innovation | +1.5% | Global | Medium term (2 to 4 years) |
| Integration with traditional sports ecosystems | +1.2% | North America, Europe | Long term (4 years or more) |
Large-scale youth digital engagement
Large-scale youth digital engagement is a major structural driver supporting esports growth above its baseline CAGR of 17.6%. More than 5.4 billion people used the internet globally by 2025, while users aged 15–34 accounted for over 45% of time spent on interactive entertainment platforms. More than 70% of secondary and tertiary students in advanced economies also engage with games or gaming video content each week.
Smartphone penetration has exceeded 80% of households across many Asia Pacific and Latin American markets, making competitive gaming more affordable and accessible. This broad digital reach can reduce customer acquisition costs by approximately 20–30% compared with traditional television advertising. Lower acquisition expenses allow esports leagues, teams, and publishers to reach larger audiences while improving revenue from streaming, in-game purchases, subscriptions, sponsorships, and live events.
Restraints
| Restraint | (~) % CAGR | Geographic Relevance | Impact Timeline |
|---|---|---|---|
| Regulatory uncertainty around betting & loot mechanics | -3.0% | North America, Europe, parts of Asia | Short term (2 years or less) |
| High interest rate environment | -2.1% | Global | Short term (2 years or less) |
| Fragmented publisher control over esports IP | -1.8% | Global | Medium term (2 to 4 years) |
| Bandwidth & power cost inflation | -1.5% | Emerging markets | Medium term (2 to 4 years) |
| Limited profitability of smaller teams & tournament operators | -1.3% | Global | Long term (4 years or more) |
Regulatory uncertainty around betting & loot mechanics
Regulatory uncertainty around esports betting and loot mechanics is a major market restraint, reducing the potential CAGR by an estimated 3.0 percentage points. More than 30 jurisdictions have introduced or tightened regulations on online gambling and random-reward systems since 2022. These rules include age verification, payout limits, licensing requirements, and stricter disclosure standards.
More than 60% of surveyed EU regulators consider loot boxes to be gambling-adjacent products. Compliance expenses for affected games can reach 5–10% of gross revenue due to licensing fees, consumer disclosures, and verification systems. Regulatory uncertainty also delays investment in regional leagues and lowers the expected value of expansion projects. Operators with high exposure to regulated monetization may face margin reductions of 3–5 percentage points, encouraging them to shift toward subscriptions, fixed-price digital items, and sponsorship revenue.
Challenges
| Challenge | (~) % CAGR | Geographic Relevance | Mitigation Horizon |
|---|---|---|---|
| Esports profitability model transition | -2.8% | Global | Medium term (2 to 4 years) |
| Talent burnout & player welfare | -2.0% | Global | Long term (4 years or more) |
| Infrastructure gaps in emerging markets | -1.9% | Asia Pacific, Africa, Latin America | Long term (4 years or more) |
| Measurement & attribution complexity for advertisers | -1.7% | Global | Medium term (2 to 4 years) |
| Volatile content lifecycle of competitive titles | -1.5% | Global | Short term (2 years or less) |
Esports profitability model transition
The shift from franchise-fee-led expansion toward sustainable profitability remains a major esports challenge, creating an estimated 2.8 percentage-point drag on potential growth. Policy rates across many developed and emerging economies have increased by 300–500 basis points since 2021, raising borrowing costs and limiting funding for loss-making teams and leagues.
Operating losses in North America and Europe often exceed 20–30% of revenue, while player salaries and travel can represent more than 50% of fixed operating costs. Payroll taxes, social security payments, and compliance expenses for international rosters can add another 10–15% to total personnel costs.
Opportunities
| Opportunity | (~) % CAGR | Geographic Relevance | Execution Window |
|---|---|---|---|
| Expanded regional franchising in emerging markets | +2.5% | Asia Pacific, Latin America, Middle East | Medium term (2 to 4 years) |
| Cross-media IP integration with streaming & film | +2.0% | Global | Long term (4 years or more) |
| Enterprise & education esports adoption | +1.7% | North America, Europe, Asia Pacific | Long term (4 years or more) |
| Localized mobile-first esports ecosystems | +1.6% | South & Southeast Asia, Africa | Medium term (2 to 4 years) |
| Data-driven pricing & dynamic sponsorship packaging | +1.4% | Global | Short term (2 years or less) |
Expanded regional franchising in emerging markets
Expanded regional franchising in emerging markets could add around 2.5 percentage points to the esports CAGR. South and Southeast Asia, Latin America, and parts of the Middle East are expected to contribute more than 60% of global population growth by 2030. Mobile-broadband penetration in these markets also increased from below 50% in 2018 to above 75% by 2025, creating a large base of young and connected esports users.
Government recognition of esports in Brazil, India, Saudi Arabia, and Indonesia may provide access to facilities and tax support, reducing venue operating costs by 10–20%. Publishers could lower regional franchise fees by 50–70% compared with North American models while targeting team EBITDA margins of 15–20% through local sponsorships and media rights. This approach can improve fan acquisition costs, strengthen team economics, and increase revenue from markets that remain underdeveloped.
Key Players Analysis
Tier-1 leaders are large hardware, publishing, and content ecosystem companies whose gaming businesses are much larger than pure-play esports firms. Tencent reported FY2025 revenue of RMB 751.8 billion, or approximately USD 108.6 billion. Its international gaming revenue reached RMB 77.4 billion, or around USD 10.8 billion, increasing 33% year-on-year, while domestic gaming revenue rose 18% to RMB 164.2 billion.
This scale supports major esports titles such as VALORANT, PUBG Mobile, and Honour of Kings. NVIDIA’s Graphics segment generated USD 14.3 billion in FY2025, while Intel invested USD 13.8 billion in research and development during 2025. Take-Two Interactive recorded FY2025 net revenue of USD 5.6 billion, up 5.3%, with mobile contributing approximately 51–52% of nine-month revenue. Electronic Arts reported FY2025 revenue of USD 7.4 billion and invested USD 2.5 billion in research and development.
Tier-2 challengers, including Cloud9 Esports, Allied Esports, Gfinity plc, Fragbite Group, Modern Times Group, Huya, Gameloft, and G Esports Holding, generally operate with revenue below USD 500 million. These companies depend more on sponsorships, franchise fees, tournaments, streaming, and content monetization.
Valve, Nintendo, HTC, and Activision Blizzard, now part of Microsoft, hold important positions through Dota 2, Nintendo Switch, virtual-reality hardware, and the Call of Duty League. Overall, Tier-1 companies capture greater esports-linked value through game ownership, hardware sales, and royalties, while Tier-2 firms compete through event operations and content distribution.
Top Key Players in the Market
- Tencent Holdings Ltd.
- Activision Blizzard, Inc.
- Electronic Arts Inc.
- Epic Games, Inc.
- Valve Corporation
- Nintendo of America Inc.
- Gameloft SE
- Modern Times Group
- Gfinity plc
- Allied Esports
- Take-Two Interactive
- Huya
- Fragbite Group
- HTC Corporation
- Intel Corporation
- NVIDIA Corporation
- Cloud9 Esports
- G Esports Holding GmbH
Recent Developments
- In 2026, the Esports World Cup Foundation announced a record USD 75 million prize pool for the Esports World Cup. The event includes 25 tournaments across 24 games, bringing together more than 2,000 players and around 200 clubs from over 100 countries. This expansion strengthens the tournament’s position as a major multi-title esports platform.
- In 2026, RTS completed the acquisition of the Evolution Championship Series, or EVO, from NODWIN Gaming after Qiddiya Investment Company acquired RTS in September 2025. EVO planned events in Japan, the United States, and France during 2026, while Qiddiya’s gaming district includes 4 esports arenas with a combined capacity of 73,000 seats.
- In 2025, the Esports World Cup Foundation expanded its Club Partner Program from 30 to 40 esports organizations. The program committed USD 20 million and offered each selected club up to USD 1 million for marketing, content development, brand expansion, and global fan engagement. The participating clubs collectively reached more than 300 million fans worldwide.
Report Scope
| Report Features | Description |
|---|---|
| Market Value (2025) | USD 4.7 Billion |
| Forecast Revenue (2035) | USD 27.5 Billion |
| CAGR (2026-2035) | 17.6% |
| Base Year for Estimation | 2025 |
| Historic Period | 2020-2024 |
| Forecast Period | 2026-2035 |
| Report Coverage | Revenue Forecast, Market Dynamics, Competitive Landscape, Recent Developments |
| Segments Covered | By Revenue Stream (Sponsorship, Media Rights, Advertising, Betting & Fantasy, Tickets & Merchandise, Publisher Fees and In-Game Purchases); By Streaming Type (On-demand, Live Streaming); By Streaming Platform (Twitch, YouTube Gaming, Facebook Gaming, Huya, DouYu, Rest of Streaming Platforms); By Device Type (Smartphones, Desktop/Laptop, Gaming Consoles); By Game Genre (MOBA, Battle Royale, First Person Shooter (FPS), Real-Time Strategy (RTS), Sports and Racing, Fighting, Others Game Genre) |
| Regional Analysis | North America – US, Canada; Europe – Germany, France, The UK, Spain, Italy, Rest of Europe; Asia Pacific – China, Japan, South Korea, India, Australia, Singapore, Rest of APAC; Latin America – Brazil, Mexico, Rest of Latin America; Middle East & Africa – GCC, South Africa, Rest of MEA |
| Competitive Landscape | Tencent Holdings Ltd., Activision Blizzard, Inc., Electronic Arts Inc., Epic Games, Inc., Valve Corporation, Nintendo of America Inc., Gameloft SE, Modern Times Group, Gfinity plc, Allied Esports, Take-Two Interactive, Huya, Fragbite Group, HTC Corporation, Intel Corporation, NVIDIA Corporation, Cloud9 Esports, G Esports Holding GmbH |
| Customization Scope | Customization for segments, region/country-level will be provided. Moreover, additional customization can be done based on the requirements. |
| Purchase Options | We have three licenses to opt for: Single User License, Multi-User License (Up to 5 Users), Corporate Use License (Unlimited Users and Printable PDF) |





























