Report Overview
In 2025, the Global Business Intelligence Market was valued at USD 35.8 billion. The market is projected to grow at a CAGR of 10.1% during 2026–2035, reaching approximately USD 93.7 billion by 2035. North America dominated the global market in 2025, accounting for more than 40.4% of the total market share and generating approximately USD 14.5 billion in revenue.
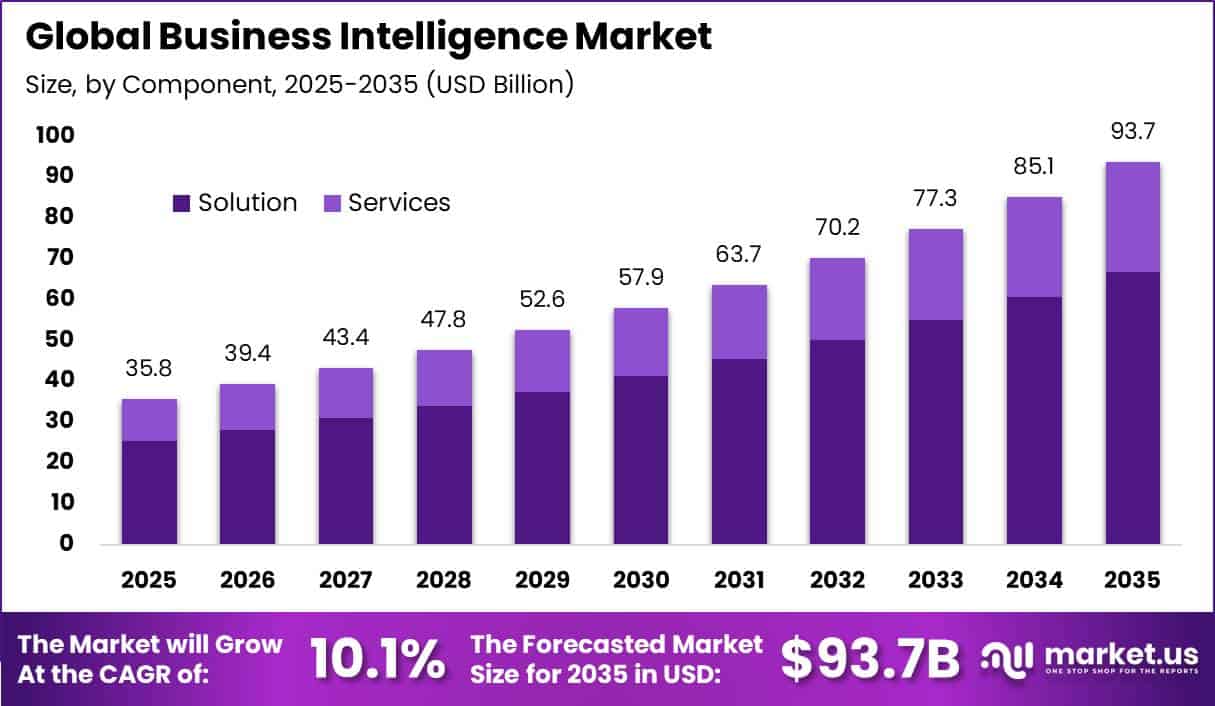
The Business Intelligence (BI) Market is expected to grow from USD 35.8 billion in 2025 to approximately USD 93.7 billion by 2035, at a 10.1% CAGR. Market growth is supported by rising digital business activity, increasing enterprise data volumes, and stronger demand for faster, data-based decision-making across banking, retail, healthcare, manufacturing, logistics, and technology.
According to the U.S. Bureau of Economic Analysis (BEA), the U.S. digital economy generated USD 4.27 trillion in current-dollar value added in 2022, compared with USD 3.89 trillion in 2021. As businesses expand digital sales, cloud operations, and connected systems, they generate larger and more complex data sets.
Business investment in data-driven technologies is also increasing. U.S. businesses spent USD 722 billion on domestic R&D in 2023, representing a 4.4% year-on-year increase, while company-funded R&D reached USD 635 billion. In addition, U.S. data scientist employment is projected to increase from 202,900 in 2023 to 276,000 by 2033, adding 73,100 jobs, or 36.0%, which is expected to strengthen demand for BI, predictive analytics, and self-service reporting tools.
Key Takeaway
- The Business Intelligence Market was valued at USD 35.8 billion in 2025 and is projected to reach approximately USD 93.7 billion by 2035, growing at a 10.1% CAGR.
- The solution segment dominated the Business Intelligence market with a 71.3% share.
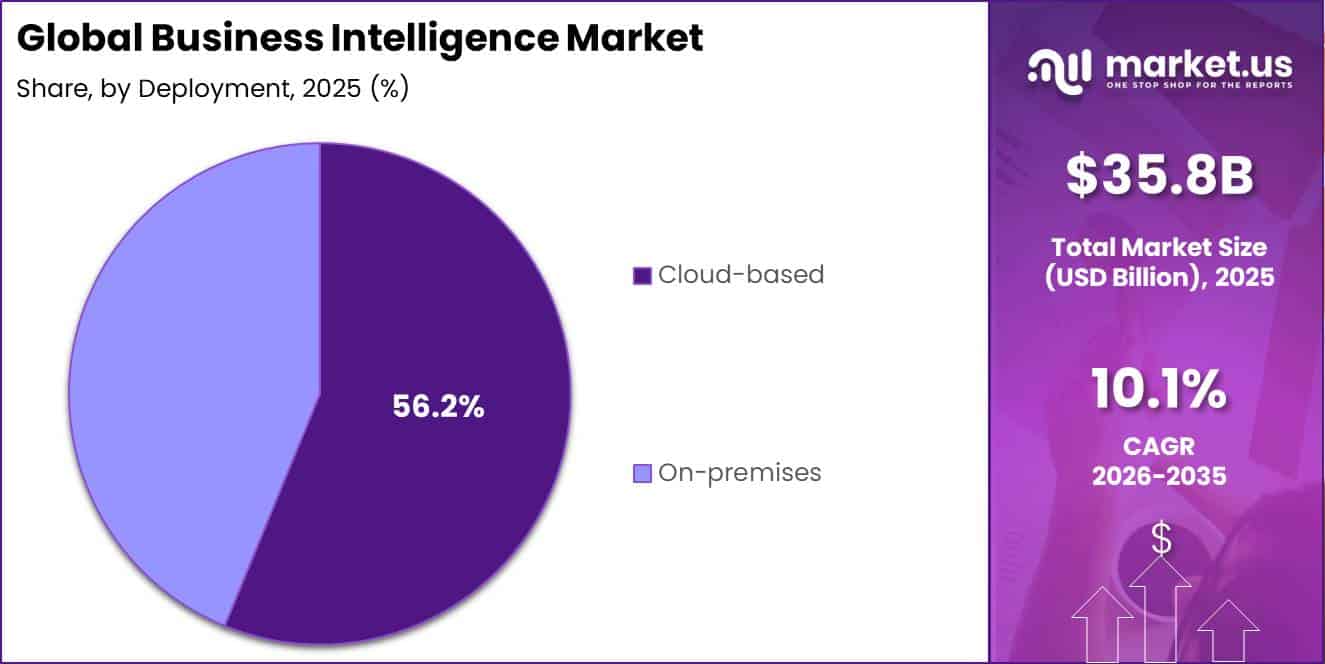
- The cloud-based deployment segment led the market with a 56.2% share.
- The large enterprises segment accounted for a leading 64.7% share of the market.
- The finance segment held the largest share at 35.6%.
- The BFSI segment captured a dominant 29.2% share of the Business Intelligence market.
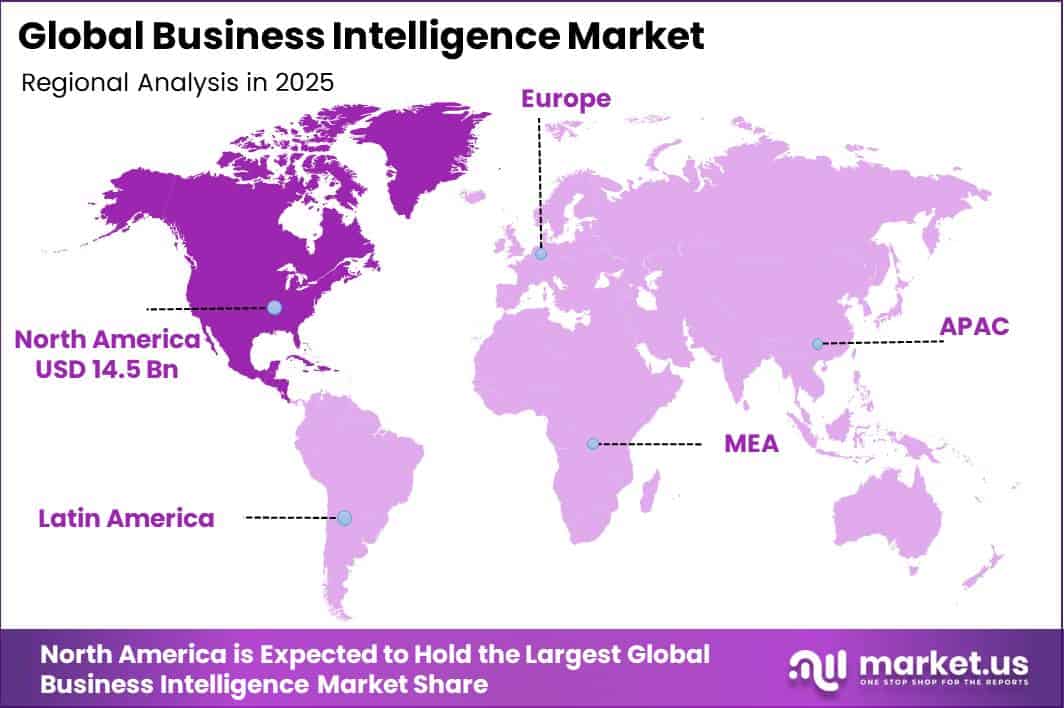
- North America led the market in 2025 with more than 40.4% share, generating around USD 14.5 billion in revenue.
By Component
The Solution segment held a dominant position in the Business Intelligence market, accounting for 71.3% of the total share. Its leadership is supported by strong enterprise demand for software that can collect, organize, analyze, and present business data. BI solutions include dashboards, reporting platforms, data integration tools, visualization software, query tools, and predictive analytics applications.
These solutions are widely used across finance, sales, operations, procurement, customer service, and supply-chain functions, creating more recurring demand than implementation or consulting services. Growing enterprise digital adoption is further supporting the segment. According to Eurostat, 52.7% of EU enterprises with at least 10 employees used paid cloud computing services in 2025, increasing by 7.42 percentage points from 2023.
In addition, 39.8% of EU enterprises conducted data analytics internally or through external providers in 2025, while adoption reached 78.8% among large enterprises. As cloud platforms, databases, ERP systems, CRM applications, and AI tools generate more business data, companies increasingly require BI software to combine these sources into common dashboards, reports, alerts, and performance indicators.
By Deployment
The Cloud-based deployment segment held a dominant position in the Business Intelligence market, accounting for 56.2% of the total share. Its leadership is supported by the need for scalable, flexible, and lower-capital analytics systems that can handle growing enterprise data volumes and reduce dependence on on-site infrastructure.
According to the UK Office for National Statistics, 69% of UK firms used cloud-based computing systems and applications in 2023, compared with 61% using specialised software, 36% using specialised equipment, 9% using artificial intelligence, and 4% using robotics. Among employment-weighted firms, cloud adoption was even higher at 78%, showing stronger use among larger organizations.
Cloud adoption is also increasing in other markets. In Canada, 48% of businesses used cloud computing in 2023, up from 45% in 2021. The UK public sector spent around £26 billion on digital and data activities in 2023, while about 55% of central government organizations placed more than 60% of their technology estate in the cloud, supporting demand for scalable BI platforms.
By Enterprise Size
The large enterprises segment held a dominant position in the Business Intelligence market, accounting for 64.7% of the total share. Large organizations manage high transaction volumes, large workforces, multiple business units, suppliers, customers, and international operations. This creates strong demand for centralized dashboards, automated reporting, forecasting, and data controls across finance, sales, procurement, production, and logistics.
According to Eurostat, large enterprises with 250 or more employees represented only 0.2% of EU business-economy enterprises, equal to around 53,000 companies, in 2024. Despite their limited number, these companies generated 51% of total net turnover, equal to €19.6 trillion, and employed 58.4 million people, representing 36% of the EU business-economy workforce.
The OECD also reported that large firms are 15 times more likely than small firms to use big-data analytics and nearly 13 times more likely to use enterprise resource planning software. This higher digital adoption increases demand for BI platforms that connect ERP, financial, customer, and supply-chain data, supporting greater spending on software licenses, cloud capacity, integrations, analytics users, and platform upgrades.
By Business Function
The Finance segment held a dominant position in the Business Intelligence market, accounting for 35.6% of the total share. Finance teams require accurate and timely information on cash flow, revenue, costs, margins, budgets, debt, fraud risks, and regulatory exposure.
According to the World Bank’s Global Findex 2025, around 79% of adults worldwide had a financial account in 2024, compared with 74% in 2021 and 51% in 2011. In low- and middle-income economies, 61% of adults made or received a digital payment in 2024, while digital merchant payments reached 42% of adults.
The International Monetary Fund estimated global debt at USD 251 trillion in 2024, equal to more than 235% of global GDP. Growing payment activity, borrowing, and compliance requirements are therefore increasing demand for BI tools that improve financial reporting, working-capital planning, forecasting, and risk monitoring.
By Industry Vertical
The BFSI segment held a dominant position in the Business Intelligence market, accounting for 29.2% of the total share. Banks, insurers, investment firms, and other financial institutions generate large volumes of transaction, customer, credit, claims, market, and compliance data.
According to the World Bank, 79% of adults worldwide held a financial account in 2024, representing billions of users generating payment and financial-service data. This rising transaction activity increases the need for analytics tools that can track customer behavior, fraud indicators, profitability, loan performance, and operational risks.
The International Monetary Fund estimated that the euro-area financial system held €80.7 trillion in assets in 2024, equal to 532.4% of regional GDP. Banks alone accounted for €46.0 trillion, representing 57.0% of these assets. Such large financial positions require continuous monitoring of capital, liquidity, credit exposure, interest-rate risk, and performance, supporting strong demand for BI platforms across the BFSI sector.
Key Market Segments
By Component
- Solution
- Dashboards and Scorecards
- Data Integration and ETL
- Reporting and Visualization
- Query and Analysis
- Services
- Consulting
- Integration and Deployment
- Support and Maintenance
By Deployment
- On-premises
- Cloud-based
By Enterprise Size
- Large Enterprises
- Small and Medium Enterprises (SMEs)
By Business Function
- Finance
- Human Resource
- Operation
- Sales and Marketing
- Others
By Industry Vertical
- BFSI
- Government and Public Sector
- Healthcare and Life Sciences
- Manufacturing
- Retail
- Media and Entertainment
- Telecom and IT
- Others
Geopolitical Impact Analysis
Geopolitical tensions are influencing the Business Intelligence market mainly through the physical infrastructure required to develop, host, and deliver BI software. This includes data-centre servers, semiconductors, networking equipment, storage systems, cooling equipment, and power supplies.
Disruptions in the Red Sea have increased transport risks and hardware-delivery costs for cloud providers, system integrators, and enterprise IT buyers. According to UNCTAD, Red Sea and Suez Canal disruptions added 148 percentage points to the cumulative 120% increase in the China Containerized Freight Index between October 2023 and June 2024.
UNCTAD also reported that Suez and Panama Canal transits declined by more than 40% from peak levels, while Panama Canal transits fell by almost 50%. Rerouting Asia-Europe cargo around the Cape of Good Hope can extend a typical voyage from 43 days to 63 days, requiring 1 additional vessel to maintain service frequency.
Energy volatility is another major concern. The International Energy Agency projects global data-centre electricity consumption to increase from 485 TWh in 2025 to 950 TWh by 2030, reaching about 3% of global electricity demand. Middle East conflict temporarily removed nearly 20% of global LNG supply, while average spot wholesale electricity prices in the European Union and Japan rose by more than 30% year on year during the second quarter.
Regional Analysis
North America accounted for 40.4% of the global Business Intelligence market in 2025, generating USD 14.5 billion in revenue. Regional growth is supported by a large enterprise base, advanced cloud infrastructure, strong AI investment, and high use of data-driven management across BFSI, healthcare, retail, manufacturing, telecommunications, and public services.
The United States remains the main contributor because large companies require BI platforms to combine financial, operational, customer, workforce, and supply-chain data. According to the U.S. Bureau of Labor Statistics, professional, scientific, and technical services employed 10.8 million people in 2025 and are expected to add 926,700 jobs by 2035, reaching 11.7 million jobs.
Industry output is projected to increase from USD 3.23 trillion in 2025 to USD 4.13 trillion by 2035. Canada is also supporting digital infrastructure through CAD 2.0 billion over five years, including up to CAD 700 million for AI data centres, CAD 705 million for AI supercomputing, CAD 300 million for compute access, and CAD 200 million for public infrastructure expansion.
Asia Pacific is the fastest-growing regional market, supported by rapid digitization, cloud adoption, mobile connectivity, and modernization across banking, retail, manufacturing, logistics, and government. World Bank data show that 88.0% of the East Asia and Pacific population used the internet in 2025.
Key Regions and Countries
North America
- US
- Canada
Europe
- Germany
- France
- The UK
- Spain
- Italy
- Rest of Europe
Asia Pacific
- China
- Japan
- South Korea
- India
- Australia
- Rest of APAC
Latin America
- Brazil
- Mexico
- Rest of Latin America
Middle East & Africa
- GCC
- South Africa
- Rest of MEA
Market Dynamics
Drivers
| Driver | (~) % CAGR | Geographic Relevance | Impact Timeline |
|---|---|---|---|
| Cloud-native BI subscription migration | +2.6% | Global, led by North America | Short term (2 years or less) |
| Embedded AI-assisted analytics in ERP/CRM suites | +1.8% | North America, Western Europe | Short term (2 years or less) |
| Rising enterprise data-scientist and analytics headcount | +1.2% | North America, Asia Pacific | Medium term (2 to 4 years) |
| Digital payments and transaction-data proliferation | +1.0% | Asia Pacific, Latin America | Short term (2 years or less) |
| Self-service dashboarding replacing IT-dependent reporting | +0.9% | Global | Medium term (2 to 4 years) |
Cloud-native BI subscription migration
Cloud-based BI can reduce upfront spending by an estimated 15% to 20% per seat, while recurring subscriptions provide vendors with more predictable revenue. Major cloud providers also reported cloud-segment growth of more than 30% in fiscal 2025.
Self-service trials and faster cloud deployment can shorten procurement cycles compared with traditional on-premises projects, helping BI vendors move from one-time software sales toward recurring, usage-based platform revenue.
Restraints
| Restraint | (~) % CAGR | Geographic Relevance | Impact Timeline |
|---|---|---|---|
| Data-sovereignty and cross-border transfer restrictions | -1.4% | European Union, China | Short term (2 years or less) |
| High interest-rate environment delaying enterprise IT CapEx | -1.1% | North America, Europe | Short term (2 years or less) |
| SME budget constraints limiting license affordability | -0.7% | Emerging markets, Latin America | Short term (2 years or less) |
| Legacy on-premises infrastructure lock-in | -0.5% | Public sector, banking globally | Medium term (2 to 4 years) |
Data sovereignty and cross-border transfer restrictions
Data-localization rules under regulations such as the EU’s GDPR and China’s Personal Information Protection Law can slow multinational BI deployments by requiring data to remain within national or regional borders.
In 2025, around 39.85% of EU enterprises used internal or hybrid analytics processing, increasing the need for localized data infrastructure. Duplicating regional data-centre capacity can raise infrastructure costs by an estimated 12% to 18% per instance.
These requirements can reduce margins on regulated-sector contracts and delay investment decisions while enterprises wait for sovereign-cloud approvals. Certification and compliance processes may extend deployment cycles by around six to nine months, particularly in banking, insurance, and public-sector projects.
Challenges
| Challenge | (~) % CAGR | Geographic Relevance | Mitigation Horizon |
|---|---|---|---|
| Data-scientist and analytics talent shortage | -0.9% | Global, acute in North America | Medium term (2 to 4 years) |
| Data-centre power and cooling capacity strain | -0.8% | North America, EU, Middle East | Medium term (2 to 4 years) |
| Legacy system data-integration complexity | -0.6% | Global, acute in manufacturing | Long term (4 years or more) |
| Hardware and semiconductor supply-chain rerouting delays | -0.5% | Asia Pacific, Europe | Medium term (2 to 4 years) |
Data scientist and analytics talent shortage
The main limitation to wider BI adoption is the shortage of skilled data professionals rather than a lack of investment. The U.S. Bureau of Labor Statistics projects data-scientist employment to rise from 202,900 in 2023 to 276,000 by 2033, adding 73,100 jobs.
Data-centre workloads are expected to increase sharply and nearly double by 2030, increasing demand for analytics expertise. This skills gap can create implementation delays of around four to eight months for advanced predictive-analytics projects, while OECD digital-skills indicators from 2023 to 2025 also point to persistent workforce shortages.
To reduce this pressure, BI vendors are expanding low-code tools, AI-assisted query systems, partner certification programs, and managed analytics services, although the underlying skills deficit is likely to remain a market constraint.
Opportunities
| Opportunity | (~) % CAGR | Geographic Relevance | Execution Window |
|---|---|---|---|
| Agentic-AI monetization layered on existing BI data pipes | +2.1% | North America, Western Europe | Medium term (2 to 4 years) |
| Untapped SME self-service analytics penetration | +1.5% | Asia Pacific, Latin America | Medium term (2 to 4 years) |
| Sovereign-cloud roll-up and localized-hosting M&A | +1.1% | European Union, Middle East | Long term (4 years or more) |
| Vertical-specific analytics bundling for BFSI and healthcare | +0.8% | Global | Medium term (2 to 4 years) |
Agentic-AI monetization layered on existing BI data pipes
This represents a clear untapped opportunity because agentic-AI monetization needs a new usage-based pricing model on top of existing data pipelines, rather than simply adding more subscription users. In fiscal 2025, leading cloud-platform vendors reported R&D-to-revenue ratios of around 17% to 20%, but most spending was still focused on core infrastructure rather than agent-specific monetization.
The opportunity is attractive because automated query resolution can reduce reliance on human analyst hours and support per-query pricing. OECD estimates through 2025 suggest AI could reduce cost-per-insight by around 25% to 35%.
However, regulatory uncertainty around autonomous decision-making under emerging EU AI rules keeps this as a future growth area, leaving significant white space for vendors that can build compliant agentic pricing models.
Key Players Analysis
The Business Intelligence market is led by Tier-1 platform providers, including Microsoft, SAP, Oracle, Salesforce, Google, Amazon Web Services (AWS), IBM, and Cisco. Together, these companies are estimated to represent around 65.0%–75.0% of global BI spending. Microsoft has a strong position through Power BI, Azure, Microsoft Fabric, Dynamics 365, and Microsoft 365.
In FY2025, Microsoft reported USD 281.7 billion in revenue, USD 168.9 billion from Microsoft Cloud, and more than USD 75.0 billion from Azure, while Azure and other cloud services grew 34.0%. SAP generated EUR 36.8 billion in revenue in 2025, including EUR 21.0 billion in cloud revenue and EUR 32.5 billion from cloud and software, while R&D spending reached EUR 6.6 billion.
Oracle reported FY2025 revenue of USD 57.4 billion, cloud-services revenue of USD 24.5 billion, R&D spending of USD 9.9 billion, and capital expenditure of USD 21.2 billion. IBM generated USD 30.0 billion in software revenue in 2025, up 10.6%, with USD 8.3 billion in R&D spending.
Salesforce reported FY2025 revenue of USD 37.9 billion, including USD 35.7 billion, or 94.1%, from subscription and support, while R&D spending reached USD 5.5 billion. Cisco’s software revenue reached USD 22.3 billion, up 21.0%, while observability revenue increased 26.0% to USD 1.1 billion. Its Splunk acquisition was valued at USD 28.0 billion. Tier-2 challengers hold around 10.0%–15.0%, while other vendors represent about 15.0%–25.0%.
Top Key Players in the Market
- Rackspace US Inc.
- SAP SE
- Oracle Corporation
- Microsoft Corporation
- Cisco Systems Inc.
- SAS Institute Inc.
- GoodData Corporation
- Targit AS
- IBM Corporation
- VMware Inc.
- Tableau Software Inc. (Salesforce)
- Google LLC
- Amazon Web Services
- Other
Recent Developments
- In 2026, Microsoft launched Fabric Go Local in Singapore, providing local data residency for OneLake, Data Factory, Data Engineering, Data Warehouse, Data Science, Databases, and Power BI. The launch supports regulated BI and analytics workloads and forms part of Microsoft’s planned USD 5.5 billion spending on Singapore cloud and AI infrastructure and operations from 2025 through 2029.
- In 2026, IBM completed its acquisition of Confluent for approximately USD 11.0 billion, paying USD 31.00 per share in cash on March 17, 2026. Confluent serves more than 6,500 enterprises, including 40% of the Fortune 500. The combination strengthens IBM’s real-time data, analytics, governance, automation, and AI capabilities across on-premises and hybrid-cloud environments.
Report Scope
| Report Features | Description |
|---|---|
| Market Value (2025) | USD 35.8 Billion |
| Forecast Revenue (2035) | USD 93.7 Billion |
| CAGR (2026-2035) | 10.1% |
| Base Year for Estimation | 2025 |
| Historic Period | 2020-2024 |
| Forecast Period | 2026-2035 |
| Report Coverage | Revenue Forecast, Market Dynamics, Competitive Landscape, Recent Developments |
| Segments Covered | By Component (Solution [Dashboards and Scorecards, Data Integration and ETL, Reporting and Visualization, Query and Analysis], Services [Consulting, Integration and Deployment, Support and Maintenance]); By Deployment (On-premises, Cloud-based); By Enterprise Size (Large Enterprises, Small and Medium Enterprises (SMEs)); By Business Function (Finance, Human Resources, Operations, Sales and Marketing, Others); By Industry Vertical (BFSI, Government and Public Sector, Healthcare and Lifesciences, Manufacturing, Retail, Media and Entertainment, Telecom and IT, Others) |
| Regional Analysis | North America – US, Canada; Europe – Germany, France, The UK, Spain, Italy, Rest of Europe; Asia Pacific – China, Japan, South Korea, India, Australia, Singapore, Rest of APAC; Latin America – Brazil, Mexico, Rest of Latin America; Middle East & Africa – GCC, South Africa, Rest of MEA |
| Competitive Landscape | Rackspace US Inc., SAP SE, Oracle Corporation, Microsoft Corporation, Cisco Systems Inc., SAS Institute Inc., GoodData Corporation, Targit AS, IBM Corporation, VMware Inc., Tableau Software Inc. (Salesforce), Google LLC, Amazon Web Services, Other |
| Customization Scope | Customization for segments, region/country-level will be provided. Moreover, additional customization can be done based on the requirements. |
| Purchase Options | We have three licenses to opt for: Single User License, Multi-User License (Up to 5 Users), Corporate Use License (Unlimited Users and Printable PDF) |