


Report Overview
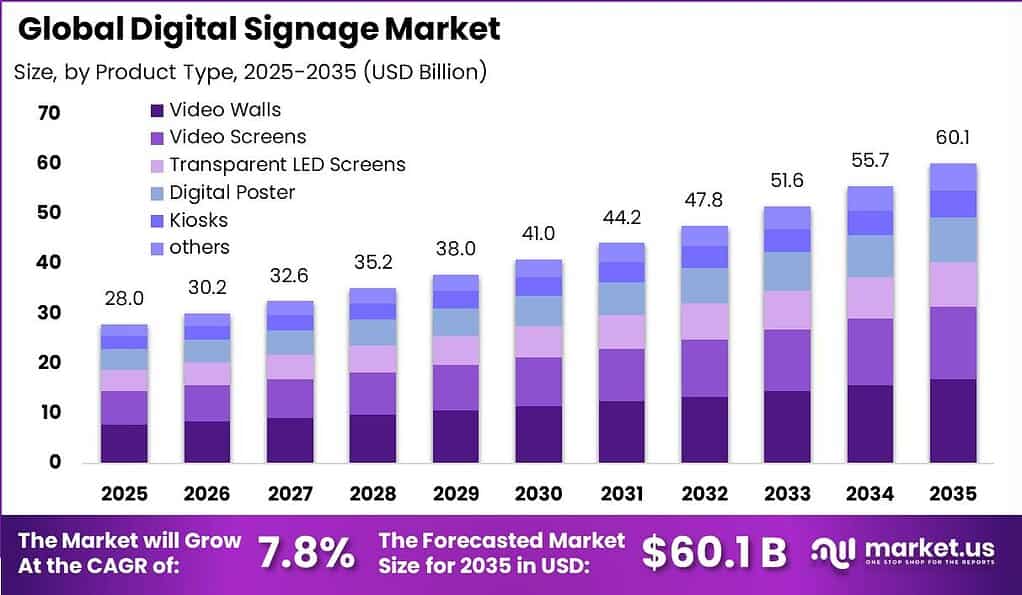
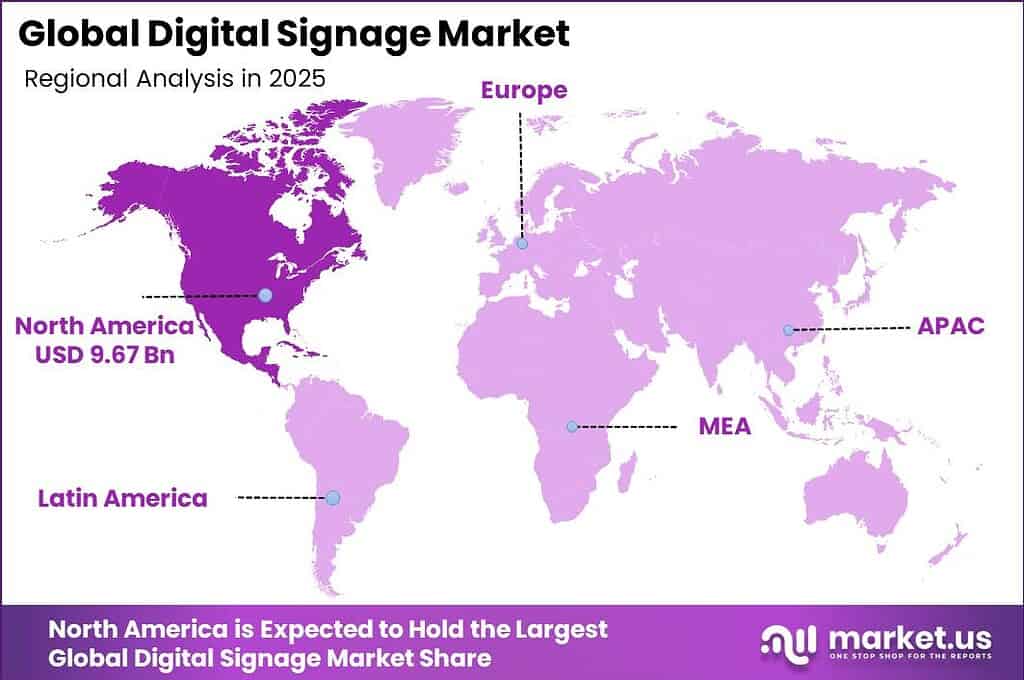
In 2025, the Global Digital Signage Market was valued at USD 28.0 billion. The market is projected to grow at a CAGR of 7.8% during 2026–2035, reaching approximately USD 60.1 billion by 2035. North America dominated the global market in 2025, accounting for more than 34.6% of the total market share and generating approximately USD 9.67 billion in revenue.
This growth path is supported by strong expansion in out-of-home and retail media advertising, where US out-of-home ad revenue alone reached USD 9.46 billion in 2025, and digital out-of-home formats already contribute 36.3% of that total, growing more than 10% year on year. As brands move budgets from static billboards and print to dynamic, targeted screens in malls, transit hubs, roadside networks, and stores, each incremental dollar of digital out-of-home spend converts directly into more deployed displays, players, and content management licenses, giving a clear volume-driven push to digital signage demand.
Global retail media and in-store advertising are scaling fast, with worldwide retail media ad spending projected to reach about USD 165.9 billion by 2025, up from USD 50.7 billion in 2019, more than tripling in six years. According to industry data cited by Nielsen, retail media in the US alone is expected to grow about 20% in 2025, far above the wider ad market, which supports a rapid shift toward digital shelf displays, end-cap screens, and in-store networks that are all powered by digital signage solutions.
Key Takeaway
- The global digital signage market was valued at USD 28.0 billion in 2025.
- The global digital signage market is projected to grow at a CAGR of 7.8% and is estimated to reach USD 60.1 billion by 2035.
- On the basis of product type, the video walls segment dominated the market, accounting for 28.2% of the total market share.
- Based on component, the hardware segment dominated the market, accounting for 56.0% of the total market share.
- By technology, the LED segment dominated the market, accounting for 46.5% of the total market share.
- Based on screen size, the 32 to 52 inches segment dominated the market, accounting for 44.0% of the total market share.
- By content category, the broadcast segment dominated the market, accounting for 81.0% of the total market share.
- Based on location, the indoor segment dominated the market, accounting for 66.0% of the total market share.
- By application, the retail segment dominated the market, accounting for 22.0% of the total market share.
- In 2025, North America was the most dominant region in the digital signage market, accounting for 34.6% of the total market share, equivalent to approximately USD 9.68 billion.
By Product Type
In 2025, Video Walls held a dominant market position, capturing more than a 28.2% share in generative AI-enabled gaming displays, reflecting rapid adoption in esports arenas and themed entertainment centers. As global gaming activity reached 3.58 billion players in 2025, operators leaned on large, AI-driven video walls to orchestrate dynamic in-venue content, including real-time match visualizations, interactive leaderboards, and targeted sponsor messaging.
Kiosks held a significant share of the market in 2025 within generative AI-powered gaming interfaces with a CAGR of 9.0%, standing out as the fastest-growing product type as venues experimented with self-service, on-premise digital experiences. With 3.0 billion mobile gamers globally in 2025, many retailers and arcades deployed AI-enabled kiosks to bridge mobile accounts with physical locations, offering instant log-ins, procedurally generated mini-quests, and dynamic reward suggestions based on recent play history.
By Component
Hardware held a significant share of the market in 2025, accounting for an estimated 56% of generative AI in gaming spending as consoles, GPUs, and networking equipment were upgraded to handle real-time content generation. The AI in gaming market itself was valued at around 4.54 billion dollars in 2025, and hardware vendors captured much of this by bundling accelerators optimized for procedural world building and AI-driven rendering.
Software is emerging as a fast-growing segment in 2025 with a CAGR of 10.5%, reflecting a shift toward flexible generative AI tools that can be updated monthly and monetized through subscriptions or usage-based models. Developers invested heavily in middleware, plug-ins, and cloud APIs that automate dialogue writing, quest generation, and scene composition.
By Technology
LED held a significant share of the market in 2025 within generative AI-ready gaming display technologies, representing roughly 46.5% of installed advanced screens due to its brightness, durability, and compatibility with high-frame-rate content. Esports venues and flagship retail stores chose LED walls and panels to showcase AI-generated animations, dynamic maps, and reactive ambient lighting tied to in-game events.
OLED is emerging as a fast-growing segment in 2025 in gaming display technology, favored for deep blacks and high contrast that enhance AI-generated cinematic experiences. As 3.49 billion players engaged with games worldwide in 2025, premium gamers and boutique venues increasingly adopted OLED panels for story-driven titles that rely on generative narrative engines and subtle visual cues.
By Screen Size
32 to 52 Inches held a significant share of the market in 2025 among generative AI-compatible gaming screen sizes, accounting for about 44% of installations, as this range aligns with mainstream living room setups. With 3.58 billion global players and a strong base of console and PC gamers, mid-sized screens became the standard for households seeking immersive AI-driven experiences without redesigning their spaces.
More than 52 Inches is emerging as a fast-growing segment in 2025 with a CAGR of 7.5%, driven by the spread of home cinema rooms, gaming cafés, and esports stages that favor larger-than-life visuals for AI-enhanced content. A slice of players invested in big-screen setups to fully experience generative AI worlds, from expansive open landscapes to crowd simulations that react to every match.
By Resolution
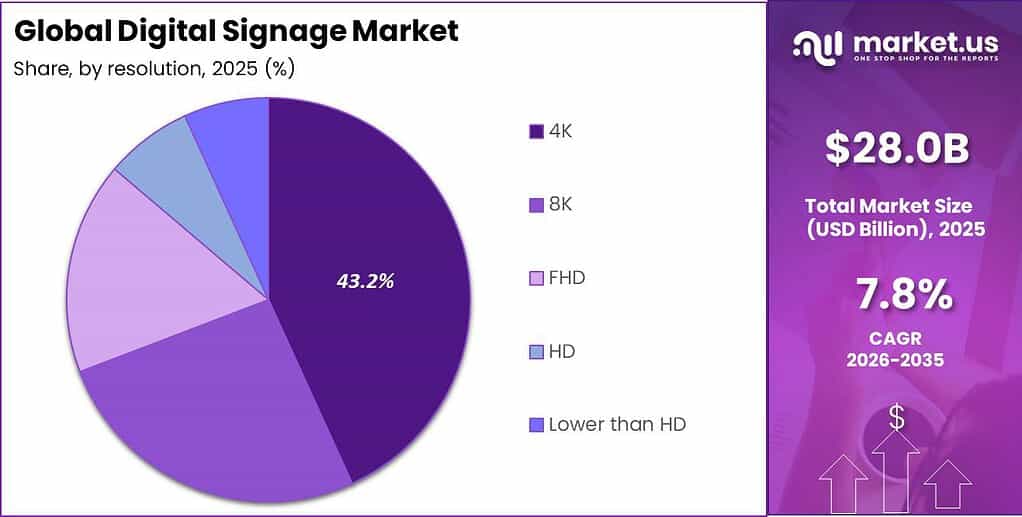
4K held a significant share of the market in generative AI gaming resolutions in 2025, representing about 43.2% of active advanced setups as it balanced visual fidelity with achievable performance across mainstream hardware. With global revenues at roughly 260 billion dollars and widespread console penetration, many studios targeted 4K as their baseline for AI-generated textures, lighting, and crowd details.
Release cycles in March and October 2025 saw numerous titles optimized for 4K, using generative AI to refine foliage, urban scenes, and character clothing without overwhelming network capacity. 8K is emerging as a fast-growing segment in 2025, centered on early adopters and high-end venues experimenting with ultra-detailed generative AI game worlds.
Although the installed base is smaller than 4K, a niche of enthusiasts and professional esports broadcasters began using 8K panels to showcase intricate AI-generated environments and micro-animations visible only at very high pixel counts.
By Content Category
Broadcast held a dominant market position in 2025 in generative AI-driven gaming content categories, capturing more than an 81% share as live streaming and event coverage became the core way players and fans interacted with games. With 3.58 billion players worldwide and a large audience watching rather than just playing, broadcasters adopted generative AI to create automatic highlight packages, real-time overlays, and multilingual commentary tracks.
During peak months such as March and July 2025, AI systems processed thousands of hours of footage, identifying critical plays and generating alternative camera angles without manual editing. In 2026, as total revenues climbed to around 268 billion dollars, broadcast platforms leaned on AI to personalize feeds, showing different statistics or narratives depending on viewer preferences. experiences.
By Location
Indoor environments held a significant share of the market in 2025 in generative AI gaming locations, accounting for around 66% of usage, as most play still occurs at home, in cafés, or in organized esports venues. With the global gaming market valued at nearly 202 billion dollars in 2025 and internet access reaching 6.0 billion people, indoor environments provided reliable connectivity and controlled lighting needed for AI-heavy experiences.
Outdoor is emerging as a fast-growing segment in 2025 for generative AI gaming locations with a CAGR of 9.0%, as festivals, fan zones, and public screenings experiment with more interactive experiences. While starting from a smaller base than indoor play, outdoor events reached sizable crowds during months like May and September 2025, when weather conditions favor open-air gatherings.
By Application
Retail held a significant share of the market in 2025 among generative AI gaming applications, representing about 22% of deployments as stores turned to interactive game-based experiences to attract and retain shoppers. With AI-powered personalization expected to improve user satisfaction rates by around 60%, retailers embedded generative gaming elements into digital signage, kiosks, and mobile apps to tailor challenges and rewards.
Campaigns in March and December 2025 frequently used in-store mini-games that adapt in real time to stock levels and visitor profiles, encouraging engagement with specific product categories. Data from April 2026 showed strong traction for retail experiences where AI creates unique quests for each shopper, combining purchase history with social preferences to keep game loops fresh across repeated visits.
Key Market Segments
By Product Type
- Video Walls
- Video Screens
- Transparent LED Screens
- Digital Poster
- Kiosks
- Others
By Component
- Hardware
- Display
- Media Player
- Projectors
- Others
- Software
- Services
- Installation Services
- Maintenance & Support Services
- Consulting Services
- Others
By Technology
- LCD
- LED
- OLED
- Projection
By Screen Size
- Below 32 Inches
- 32 to 52 Inches
- More than 52 Inches
By Resolution
By Content Category
- Broadcast
- News
- Weather
- Sports
- Others
- Non-Broadcast
By Location
- Indoor
- Outdoor
By Application
- Retail
- Hospitality
- Entertainment
- Stadiums & Playgrounds
- Corporate
- Banking
- Healthcare
- Education
- Transportation
Market Dynamics
Drivers
| Driver | (~) % Impact on CAGR Forecast | Geographic Relevance | Impact Timeline |
|---|---|---|---|
| Retail omnichannel digitization | +2.0% | North America, Europe, Asia-Pacific | Short term (≤ 2 years) |
| Programmatic DOOH ad spend | +1.6% | North America, Europe | Medium term (2–4 years) |
| Transit & infrastructure upgrades | +1.3% | Asia-Pacific, Middle East | Medium term (2–4 years) |
| Menu board modernization in QSR | +1.0% | Global | Short term (≤ 2 years) |
| Education & corporate AV refresh | +0.9% | Global | Medium term (2–4 years) |
| Lower LED panel cost curve | +0.8% | Asia-Pacific manufacturing, global deployments | Long term (≥ 4 years) |
Retail omnichannel digitization
In the 2024–2026 window, large retailers accelerated omnichannel investments, with many top chains reporting more than 40% of store remodels including new in-store digital signage zones, interactive displays, and queue-management screens, directly converting static print spend into recurring digital media budgets.
This driver adds roughly 2.0 percentage points to the baseline 7.80% CAGR by shifting promotional OPEX from printed materials (often 3–5% of sales for marketing-intensive categories) into digital signage networks with higher utilization (screen uptime above 95% and content refresh cycles of 24–48 hours), which increases campaign ROI and justifies larger content licenses and SaaS-based CMS fees.
Strategically, this alters retailer business models from episodic capex on fixtures to platform-like media networks: store fleets with thousands of screens can monetize 10–20% of their playlist as paid brand inventory, improving location-level EBITDA margins by an estimated 80–150 basis points while supporting bundled analytics, personalization engines, and dynamic pricing capabilities deployed via digital signage endpoints.
Restraints
| Restraint | (~) % Impact on CAGR Forecast | Geographic Relevance | Impact Timeline |
|---|---|---|---|
| Logistics disruption on hardware imports | -1.9% | Middle East, Europe, parts of Africa | Short term (≤ 2 years) |
| High interest rate environment | -1.4% | North America, Europe | Short term (≤ 2 years) |
| Building code & permitting delays | -1.1% | Global urban centers | Medium term (2–4 years) |
| Content rights & compliance risk | -0.9% | Global | Medium term (2–4 years) |
| Energy cost spikes for large displays | -0.8% | Europe, parts of Asia | Short term (≤ 2 years) |
| Capital scarcity for SMEs | -0.7% | Global emerging markets | Long term (≥ 4 years) |
Logistics disruption on hardware imports
Digital signage deployments in the Middle East and parts of Europe are currently restrained by logistics disruption and rising transport costs, with regional analysts highlighting project delays of 3–6 months for LCD, LED, and interactive flat panel shipments that rely heavily on Asian manufacturing hubs.
These bottlenecks shave an estimated 1.9 percentage points off the baseline 7.80% CAGR by pushing scheduled rollouts into later fiscal periods, increasing landed hardware costs by 8–15% due to container rate volatility and insurance surcharges, and forcing integrators to carry higher working capital as inventory turns extend from roughly 60 days to more than 120 days.
Strategically, this compresses margins on turnkey projects (often by 150–250 basis points), causes governments and infrastructure owners to re-phase capex plans, and raises the hurdle rate for new large-format installations, effectively freezing or downsizing some near-term tenders despite underlying demand remaining robust.
Challenges
| Challenge | (~) % CAGR Friction Drag | Geographic Relevance | Mitigation Horizon |
|---|---|---|---|
| Fragmented software ecosystems | -1.7% | Global | Long term (≥ 4 years) |
| Skilled installer workforce gaps | -1.3% | North America, Europe, Middle East | Medium term (2–4 years) |
| Cybersecurity & network risk | -1.2% | Global | Long term (≥ 4 years) |
| Content production scalability | -1.0% | Global | Medium term (2–4 years) |
| Measurement & attribution complexity | -0.9% | North America, Europe | Medium term (2–4 years) |
| Environmental & visual pollution concerns | -0.8% | Major cities worldwide | Long term (≥ 4 years) |
Fragmented software ecosystems
The digital signage market faces structural friction from a fragmented software and CMS ecosystem, where hundreds of platforms coexist without standardized APIs, leading large networks to operate 3–5 parallel systems across regions and formats.
This fragmentation imposes a drag of about 1.7 percentage points on maximum attainable CAGR by inflating integration costs (multi-platform deployment and maintenance often add 10–20% to project budgets), extending rollout timelines by 2–4 months as IT teams reconcile data feeds, and limiting cross-network programmatic campaigns that could otherwise raise screen fill rates by 15–25%.
Over the long term, enterprises respond with centralization initiatives, vendor consolidation, and investment in middleware or in-house platforms, but these strategies require multi-year capex and change-management cycles, which delay full-scale monetization of installed displays and keep unit economics less favorable than potential benchmarks (IT and content operations overheads often remain 2–3 percentage points of revenue higher than in more standardized digital ad ecosystems).
Opportunities
| Opportunity | (~) % CAGR | Geographic Relevance | Execution Window |
|---|---|---|---|
| Programmatic DOOH & retail media networks | +2.2% | North America, Europe, Asia-Pacific | Medium term (2–4 years) |
| AI-driven dynamic content optimization | +1.8% | Global | Long term (≥ 4 years) |
| Subscription-based signage-as-a-service | +1.5% | Global SMEs | Medium term (2–4 years) |
| Integration with in-store analytics & POS | +1.3% | Global | Medium term (2–4 years) |
| Smart city & mobility ecosystems | +1.1% | Asia-Pacific, Europe, Middle East | Long term (≥ 4 years) |
| Green signage retrofits & energy-efficient displays | +0.9% | Europe, North America | Long term (≥ 4 years) |
Programmatic DOOH & retail media networks
This opportunity represents untapped upside because many installed retail and out-of-home digital signage networks still sell inventory via manual, location-based buys, leaving programmatic and data-driven retail media revenues underpenetrated despite rapidly growing DOOH ad spend projections through the post-2026 period.
Capturing this white space could add roughly 2.2 percentage points above the baseline 7.80% CAGR by increasing effective yields per screen (cost-per-thousand impressions often 20–40% higher for targeted programmatic campaigns), lifting average screen utilization from around 50–60% to more than 80% of available loop time, and enabling unified buying across tens of thousands of retail and transit locations.
From a unit-economics perspective, shifting to programmatic retail media networks can expand operating margins by an estimated 200–400 basis points, as incremental ad revenue per screen (for example, a mid-tier chain adding multiple tens of ad slots per day) scales without proportional increases in hardware or installation costs.
Geopolitical Impact Analysis
Geopolitical tensions are exerting direct, quantifiable pressure on digital signage manufacturing economics, with impacts visible across components, energy, and logistics. In container shipping, rerouting around the Red Sea has increased Asia–Europe round-trip sailing time by about 20 days, driving fuel costs per voyage up by roughly 33% and adding up to USD 272 per 40-ft container, materially inflating landed costs for LCD panels, LED modules, power supplies, and controller boards used in signage systems.
At the same time, global container shipping costs remain 141% above pre-crisis levels, with Red Sea-exposed routes such as Shanghai–Rotterdam and Shanghai–Genoa averaging 230% higher freight rates than end-2023, compressing margins for integrators that rely on high-volume hardware imports from East Asia into Europe and the Middle East.
Energy price volatility is simultaneously raising operating and manufacturing overhead for digital signage. The International Energy Agency reports that in 2024 electricity prices for energy-intensive industries in the European Union were still double those in the United States and 50% higher than in China, despite declines from the 2022 peak.
World Bank analysis shows that travel distances for cargo ships diverted from the Red Sea had risen by 48% by October 2024, with travel times up to 45%, which in practice extends deployment schedules and forces project owners to budget for an extra 2–3 weeks of transit risk on critical components. Collectively, these quantified shocks in tariffs, energy, and freight are re-pricing digital signage hardware, tightening availability of key electronics, and reshaping preferred sourcing corridors for global rollouts.
Regional Analysis
The global digital signage market demonstrates strong regional variation, with North America emerging as the dominating region, accounting for approximately 34.6% of the total market share and reaching a valuation of USD 9.67 billion.
This dominance is primarily driven by the region’s advanced technological infrastructure, high adoption of digital advertising solutions, and the strong presence of key market players investing in innovation and large-scale deployments across retail, transportation, and corporate sectors. The United States, in particular, contributes significantly due to widespread integration of data-driven signage and AI-powered display systems.
Asia Pacific is identified as the fastest-growing region, with a CAGR of 8.5% supported by rapid urbanization, increasing retail expansion, and rising investments in smart city initiatives across countries such as China, India, and Japan.
Growing demand for interactive displays, coupled with increasing consumer engagement strategies by brands, is further accelerating regional growth. Additionally, improving digital infrastructure and declining hardware costs are enabling broader adoption among small and medium enterprises in the region. Europe also holds a notable share, driven by strong demand in the retail and hospitality sectors, along with regulatory support for digital transformation.
Key Regions and Countries
North America
- US
- Canada
Europe
- Germany
- France
- The UK
- Spain
- Italy
- Rest of Europe
Asia Pacific
- China
- Japan
- South Korea
- India
- Australia
- Rest of APAC
Latin America
- Brazil
- Mexico
- Rest of Latin America
Middle East & Africa
- GCC
- South Africa
- Rest of MEA
Key Players Analysis
Tier-1 leadership in digital signage hardware is concentrated around diversified electronics majors such as Samsung Electronics, LG Electronics, Sony Group, Panasonic and Sharp NEC, with Samsung alone controlling c.35% of the global commercial display market by unit volume in 2025 (2.5 million units shipped, 35.2% share per Omdia), implying low-teens percentage share of the dedicated digital signage market valued around US$30–33 billion by 2025–2026.
Daktronics operates as a large pure-play digital signage and LED systems vendor, but with fiscal 2026 net sales of US$838.7 million and a backlog of US$356.2 million, its implied share of the global digital signage and large LED displays space is in the low single digits, positioning it as a Tier-2 specialist rather than a scale hardware leader.
Within LG Electronics’ record 2025 revenue of KRW 89.2 trillion (c.US$66–70 billion depending on FX), commercial displays and LED video walls are embedded in its Business Solutions segment; though segment-specific signage revenue is not explicitly broken out publicly, LG’s broad commercial display footprint means its implied signage exposure likely tracks high single-digit to low-teens percent of global market value, alongside Samsung and Sony.
Structurally, Tier-1 leaders (Samsung, LG, Sony, Panasonic, Sharp, NEC) participate across LCD/LED panels, video walls, SoC-based smart signage, and media players, using scale manufacturing economics to defend share while integrating software CMS platforms (e.g., Samsung MagicINFO, LG ProActive360 managed signage services launched June 2025) to lock in recurring service revenue.
Samsung’s 17-year streak at No.1 in commercial displays shows sustained share defense, with 2025 unit shipments reaching an all-time high; assuming ASPs in the US$1,500–3,000 range for large-format commercial displays, this implies multi-billion-dollar signage-adjacent revenue, underlining its Tier-1 dominance.
Top Key Players in the Market
- BrightSign, LLC
- Cisco Systems, Inc.
- Daktronics
- Intel Corporation
- KeyWest Technology, Inc.
- LG Electronics
- Microsoft Corporation
- Omnivex Corporation
- Panasonic Holdings Corporation
- Samsung Electronics Co., Ltd.
- Scala
- Sharp Corporation
- Sharp NEC Display Solutions
- Winmate Inc.
- Leyard Optoelectronic Co., Ltd.
- Barco
- AUO Corporation
- Sony Group Corporation
- Exceptional 3D
- E Ink Holdings Inc.
- Deepsky Corporation Ltd.
- ADFLOW Networks
Recent Developments
- In August 2025, Navori Labs acquires Signagelive: Swiss-based Navori Labs announced the strategic acquisition of UK-headquartered Signagelive, combining two major digital signage CMS providers and creating what was described as the world’s largest independent, channel-only CMS platform by installed base, strengthening its global enterprise and retail presence.
- In May 2026, Vertiseit acquires Scala: Vertiseit AB announced the acquisition of Scala for approximately SEK 265 million, financed through an expanded Nordea credit facility and directed share issue. The deal added around SEK 85 million in annual recurring revenue (ARR) and targeted a long-term cash EBITDA margin of 35%.
Report Scope
| Report Features | Description |
|---|---|
| Market Value (2025) | USD 28.0 Billion |
| Forecast Revenue (2035) | USD 60.1 Billion |
| CAGR (2026-2035) | 7.8% |
| Base Year for Estimation | 2025 |
| Historic Period | 2020-2024 |
| Forecast Period | 2026-2035 |
| Report Coverage | Revenue Forecast, Market Dynamics, Competitive Landscape, Recent Developments |
| Segments Covered | By Product Type (Video Walls, Video Screens, Transparent LED Screens, Digital Poster, Kiosks, Interactive Kiosks, Self-service Kiosks, Others), By Component (Hardware, Display, Media Player, Projectors, Others, Software, Services, Installation Services, Maintenance & Support Services, Consulting Services, Others), By Technology (LCD, LED, OLED, Projection), By Screen Size (Below 32 Inches, 32 to 52 Inches, More than 52 Inches), By Resolution (8K, 4K, FHD, HD, Lower than HD), By Content Category (Broadcast, News, Weather, Sports, Others, Non-Broadcast), By Location (Indoor, Outdoor), By Application (Retail, Hospitality, Entertainment, Stadiums & Playgrounds, Corporate, Banking, Healthcare, Education, Transportation) |
| Regional Analysis | North America – US, Canada; Europe – Germany, France, The UK, Spain, Italy, Rest of Europe; Asia Pacific – China, Japan, South Korea, India, Australia, Singapore, Rest of APAC; Latin America – Brazil, Mexico, Rest of Latin America; Middle East & Africa – GCC, South Africa, Rest of MEA |
| Competitive Landscape | BrightSign, LLC, Cisco Systems, Inc., Daktronics, Intel Corporation, KeyWest Technology, Inc., LG Electronics, Microsoft Corporation, Omnivex Corporation, Panasonic Holdings Corporation, Samsung Electronics Co., Ltd., Scala, Sharp Corporation, Sharp NEC Display Solutions, Winmate Inc., Leyard Optoelectronic Co., Ltd., Barco, AUO Corporation, Sony Group Corporation, Exceptional 3D, E Ink Holdings Inc., Deepsky Corporation Ltd., ADFLOW Networks |
| Customization Scope | Customization for segments, region/country-level will be provided. Moreover, additional customization can be done based on the requirements. |
| Purchase Options | We have three licenses to opt for: Single User License, Multi-User License (Up to 5 Users), Corporate Use License (Unlimited Users and Printable PDF) |





































