


Report Overview
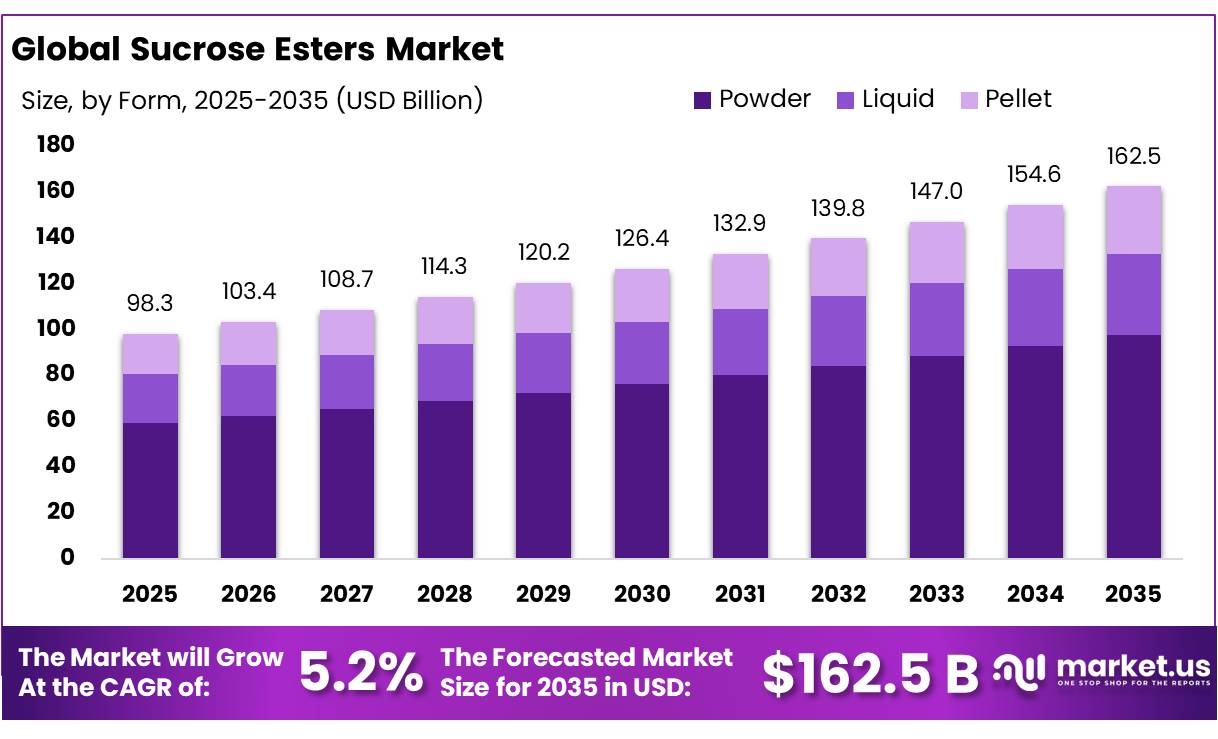
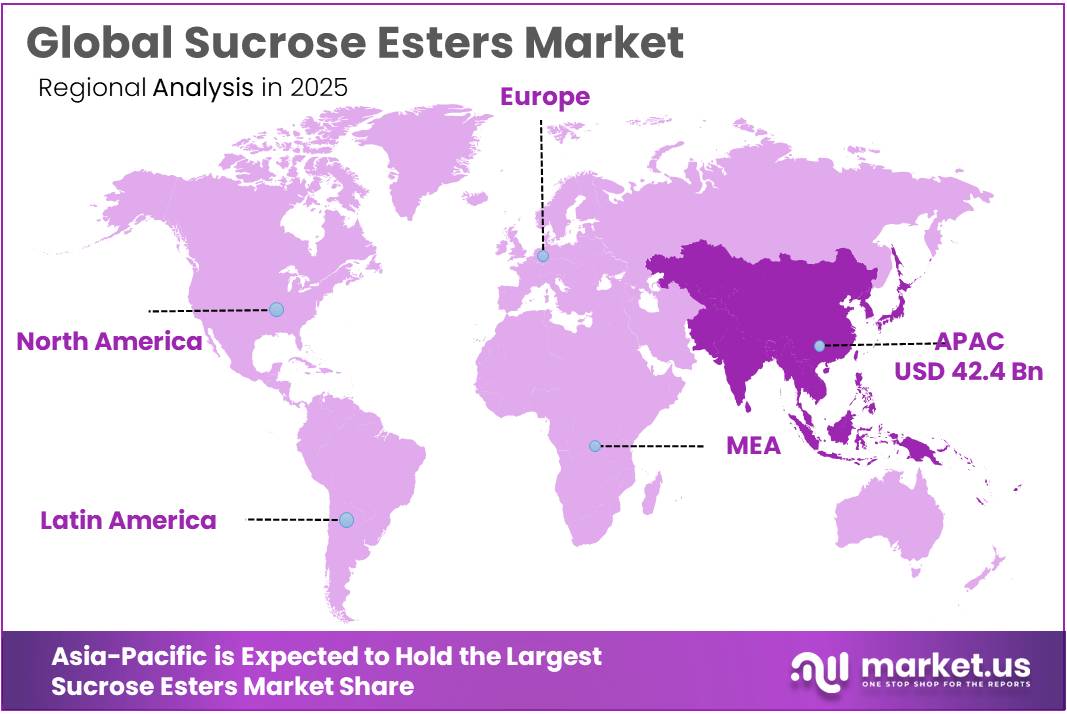
The Global Sucrose Esters Market size is expected to be worth around USD 162.5 Billion by 2035, from USD 98.3 Billion in 2025, growing at a CAGR of 5.2% during the forecast period from 2026 to 2035. In 2025, Asia-Pacific held a dominant market position, capturing more than a 43.2% share, holding USD 42.4 Billion revenue.
Sucrose esters are non-ionic surfactants produced by esterifying sucrose with food-grade fatty acids. They are mainly used as emulsifiers, stabilizers, texturizers, and dispersion agents across food, beverage, personal care, pharmaceutical, and specialty chemical formulations. FAO/WHO classifies sucrose esters of fatty acids as INS 473, while specifications require commercial material to contain at least 80% sucrose esters. FAO specifications also limit free sucrose to 5% and sulfated ash to 2%, highlighting the strict purity requirements surrounding industrial food-grade production.
- Codex Alimentarius permits sucrose esters across numerous food categories. Current Codex provisions allow up to 1,000 mg/kg in certain fluid milk products, 5,000 mg/kg in flavoured milk drinks, 10,000 mg/kg in cream analogues, and as much as 20,000 mg/kg in beverage whiteners. These broad permitted-use levels support industrial demand from dairy alternatives, bakery products, confectionery, desserts, beverages, and processed foods.
Regulatory acceptance is another important driving factor. In the United States, FDA regulations allow sucrose fatty acid esters for applications including baked goods, chewing gum, confectionery, dairy-product analogues, frozen dairy desserts, coffee and tea beverages containing dairy ingredients, and whipped milk products. An FDA GRAS notification also evaluated their use in chocolate and chocolate-containing products at a maximum concentration of 0.3%, creating additional formulation opportunities for confectionery manufacturers.
- European regulations similarly provide an established commercial framework. Under EU food-additive legislation, E473-E474 can be used at levels reaching 10,000 mg/kg in applications such as certain bakery products and fat emulsions. This regulatory coverage encourages manufacturers to develop formulations with improved emulsion stability, reduced fat separation, better whipping characteristics, and consistent texture while meeting defined additive limits.
The broader specialty-chemical environment also supports long-term product development, although cost pressures remain significant. Cefic reported that the European chemical industry generated approximately €635 billion in turnover in 2025 and employed around 1.2 million people, while roughly 31,000 companies operated across the sector. Specialty chemicals represented €36.3 billion of extra-EU imports during January-October 2025, demonstrating the scale of value-added formulation chemicals used by downstream industries.
- Safety evaluation will remain important: JECFA maintains a group acceptable daily intake of 0–30 mg/kg body weight per day for sucrose esters and related sucroglycerides. In its 2020 assessment, JECFA reported a conservative high dietary-exposure estimate of 113 mg/kg body weight per day for children aged 3–9 years, reinforcing the need for manufacturers to focus on controlled dosage, improved formulation efficiency, high-purity grades, and regulatory-compliant product development as the industry expands.
Key Takeaways
- Sucrose Esters Market size is expected to be worth around USD 162.5 Billion by 2035, from USD 98.3 Billion in 2025, growing at a CAGR of 5.2%.
- Powder held a dominant market position, capturing more than a 60.23% share.
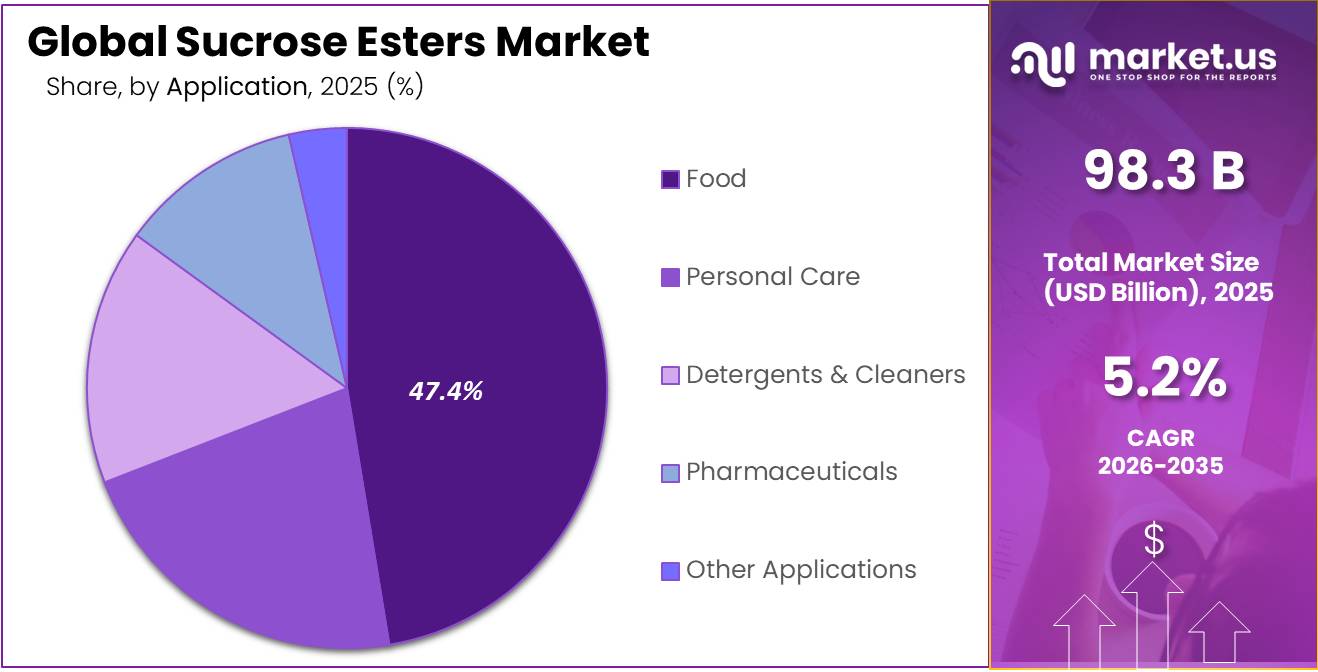
- Food held a dominant market position, capturing more than a 47.45% share.
- Asia-Pacific held a dominant market position, capturing more than a 43.22% share and accounting for USD 42.4 Bn.
By Form Analysis
Powder dominates the Sucrose Esters Market with more than a 60.23% share due to easier handling, storage, and use in dry food formulations.
In 2025, “Powder” held a dominant market position, capturing more than a 60.23% share. Powdered sucrose esters remained widely preferred because they are easy to measure, transport, store, and blend with dry food ingredients. Their solid form also supports consistent dosing in bakery mixes, powdered beverages, dairy powders, confectionery, and other processed food formulations. Regulatory acceptance continues to support this segment.
The European Union’s 2025 specification for E473 sucrose esters of fatty acids describes the additive as white to slightly greyish-white powders, soft solids, or stiff gels and requires an ester content of at least 80%. This purity requirement supports the use of standardized powder grades in industrial food production.
Liquid sucrose esters continue to hold an important position in formulations where manufacturers require faster mixing, uniform dispersion, and direct incorporation into water- or fat-containing systems. Their practical use is particularly relevant in beverages, dairy-based preparations, sauces, emulsified foods, and specialty formulations where a pre-dispersed emulsifier can simplify production. In the Codex Alimentarius standards updated through 2025, sucrose esters are permitted in water-based flavoured drinks at up to 200 mg/kg, supporting their use in fluid beverage applications.
By Application Analysis
Food dominates the Sucrose Esters Market with more than a 47.45% share, supported by extensive use across bakery, dairy, confectionery, and processed food formulations.
In 2025, “Food” held a dominant market position, capturing more than a 47.45% share. The segment remained the leading application because sucrose esters work effectively as emulsifiers, stabilizers, and texture-improving ingredients in bakery products, dairy formulations, confectionery, beverages, desserts, and processed foods. Their ability to stabilize mixtures containing both oil and water also makes them useful when manufacturers need consistent texture and product quality during large-scale processing.
Government food standards provide strong support for this application. The FAO/WHO Codex General Standard for Food Additives, updated through the 48th Session of the Codex Alimentarius Commission in 2025, lists sucrose esters under INS 473 and permits their use across a wide range of food categories. For example, Codex establishes a maximum level of 20,000 mg/kg in beverage whiteners and soybean-based beverages. Milk powder and cream powder can contain up to 10,000 mg/kg, while fine bakery wares and mixes are also permitted up to 10,000 mg/kg.
Personal Care represents another important application area for sucrose esters, particularly in creams, lotions, facial products, cleansers, and other emulsion-based formulations. Sucrose-derived esters can function as mild non-ionic emulsifying ingredients, helping manufacturers combine oil and water phases while also supporting skin-conditioning properties. This makes the ingredient group useful for formulations focused on gentle cleansing, smooth texture, and plant-derived ingredient positioning.
Key Market Segments
By Form
- Powder
- Liquid
- Pellet
By Application
- Food
- Personal Care
- Detergents & Cleaners
- Pharmaceuticals
- Other Applications
Driver Analysis
Clean-Label Emulsifier Reformulation
Sucrose esters are commercially attractive because they are derived from sucrose and edible vegetable oils or tallow-derived fatty acids and can function as emulsifiers, stabilizers, texturizers, and protective coatings across bakery, confectionery, dairy analogues, beverage systems, frozen desserts, and fresh produce; U.S. regulation permits use under current good manufacturing practice provided the ester content is at least 80%, free sucrose does not exceed 5%, acid value does not exceed 6, and residual solvents meet tight limits, including 10 ppm for methanol or methyl ethyl ketone where relevant.
These standardized specifications lower formulation risk for multinational food groups: a 0.1–0.5% sucrose-ester dose can replace combinations of mono- and diglycerides, lecithin, polysorbates, or synthetic surfactants in selected applications, allowing an analyst-modelled 5–15% reduction in total emulsifier-system complexity and 1–3 fewer ingredients on a label.
The unit economics are compelling when functional performance reduces batch separation, improves crumb softness, or extends shelf life by two to five days, because avoiding 1% food waste on a USD 10 million packaged-food production line can create USD 100,000 of annual value, far outweighing an incremental USD 0.02–0.10 per kg finished-product formulation cost.
Drivers Impact Analysis
| Driver | (~) % Impact on CAGR | Geographic Relevance | Impact Timeline |
|---|---|---|---|
| Clean-label emulsifier reformulation | +2.0 pp | North America, EU, Japan, Korea | Short term (≤ 2 years) |
| Plant-based food texturizing | +1.7 pp | North America, EU, China, ASEAN | Medium term (2-4 years) |
| Bakery and confectionery automation | +1.4 pp | China, India, ASEAN, LATAM | Short term (≤ 2 years) |
| Nutraceutical delivery systems | +1.2 pp | U.S., EU, Japan, Korea, China | Medium term (2-4 years) |
| Fresh-produce coating adoption | +1.0 pp | U.S., EU, LATAM, APAC exporters | Medium term (2-4 years) |
| Personal-care mild surfactants | +0.8 pp | EU, Japan, Korea, North America | Long term (≥ 4 years) |
Restraint Analysis
Sugar and Oil Feedstock Volatility
An analyst-modelled 20–35% rise in combined sugar-and-fatty-acid input costs can lift total sucrose-ester cash manufacturing cost by 12–22%, because raw materials commonly account for 55–70% of ex-works cost; a producer selling 5,000 tonnes annually at USD 5–10 per kg therefore faces USD 3–11 million of annual gross-profit exposure if only half of an input shock is passed through.
Food manufacturers, especially in bakery, confectionery, and beverage categories, treat emulsifiers as small-volume but highly price-sensitive formulation inputs, so a USD 1–3 per kg increase can prompt dosage reduction, substitution with mono and diglycerides or lecithin, and 3–12-month purchasing delays.
The margin effect is amplified by contract mismatch: raw materials often reprice monthly or quarterly, while food-brand formulation contracts can lock ingredient prices for 6–12 months, potentially compressing sucrose-ester EBITDA margins by 300–900 basis points during commodity spikes.
Producers can partially manage this exposure through 6–18-month supplier contracts, multiple oil-feedstock approvals, derivative hedging, 60–120 days of inventory, and formula-indexed customer pricing, but these measures consume 5–15% more working capital and do not protect small suppliers from abrupt crop, energy, or shipping disruptions.
Restraint Impact Analysis
| Restraint | (~) % Impact on CAGR | Geographic Relevance | Impact Timeline |
|---|---|---|---|
| Sugar and oil feedstock volatility | -1.8 pp | Global; APAC, EU, North America | Short term (≤ 2 years) |
| Premium price versus alternatives | -1.5 pp | India, ASEAN, LATAM, Africa | Short term (≤ 2 years) |
| E 473 regulatory uncertainty | -1.3 pp | EU, UK, export markets | Medium term (2-4 years) |
| Palm-oil traceability burden | -1.1 pp | EU-linked global supply chains | Medium term (2-4 years) |
| Limited thermal-process tolerance | -0.9 pp | Bakery, confectionery, food-service markets | Medium term (2-4 years) |
| Fragmented grade standardization | -0.7 pp | Global cross-border markets | Long term (≥ 4 years) |
Opportunity Analysis
Precision Nutrition Delivery
FDA permits sucrose fatty-acid esters under 21 CFR 172.859 when specifications are met, including at least 80% combined mono-, di-, and tri-esters, no more than 5% free sucrose, acid value not above 6, and use at levels consistent with current good manufacturing practice.
A specialized sucrose-ester blend dosed at 0.05–0.30% in a 10,000-tonne functional beverage, gummy, powder, or clinical-nutrition line creates 5–30 tonnes of annual demand, but the commercial value is driven by formulation support: product priced at USD 12–25 per kg can yield USD 60,000–750,000 in ingredient revenue per site, while a USD 50,000–250,000 annual development-and-stability service agreement can lift account margin by 15–30 percentage points.
If an optimized emulsion reduces oil separation from 3% to below 0.5%, improves active dispersion consistency by 10–20%, or enables a 20–40% reduction in expensive active dose for equivalent sensory or delivery performance, a customer with USD 10–50 million of annual functional-product sales can capture USD 0.5–5 million of additional gross value, supporting premium chemical pricing.
Suppliers that package emulsifier, oil carrier, processing protocol, and stability data as a proprietary system can increase retention above 80%, reduce price-only bidding, and create recurring high-margin formulation revenue. This opportunity could add +1.9 percentage points above baseline market CAGR in North America, Europe, Japan, South Korea, China, and high-income urban nutrition markets over two to four years.
Opportunity Impact Analysis
| Opportunity | (~) % Potential CAGR Upside | Geographic Relevance | Execution Window |
|---|---|---|---|
| Precision nutrition delivery | +1.9 pp | North America, EU, Japan, Korea | Medium term (2-4 years) |
| Postharvest coating platforms | +1.6 pp | Americas, EU, APAC exporters | Short term (≤ 2 years) |
| EUDR-traceable ester grades | +1.4 pp | EU, Southeast Asia, global exporters | Short term (≤ 2 years) |
| Low-fat texture systems | +1.2 pp | North America, EU, China, Japan | Medium term (2-4 years) |
| Contract formulation services | +1.0 pp | India, ASEAN, LATAM, Middle East | Short term (≤ 2 years) |
| Infant-nutrition regulatory dossiers | +0.8 pp | EU, UK, North America, APAC | Long term (≥ 4 years) |
Challenges Analysis
Feedstock Traceability Integration
The EUDR applies to palm oil and derivatives and will apply to large and medium operators on 30 December 2026, while most micro and small operators follow on 30 June 2027; companies placing covered products on the EU market or exporting them must demonstrate that their products are deforestation-free and produced in accordance with applicable local law.
For a producer buying 3,000–10,000 tonnes of fatty-acid inputs annually, reconciling mill, refinery, trader, and plant-level records can require 100–500 supplier data submissions per year, 10–30 audits, 30–90 days of segregated inventory, and USD 0.3–1.5 million of annual IT, assurance, and compliance cost; a single missing geolocation record can cause a 20–200-tonne lot to be withheld, tying up USD 0.2–2.0 million of working capital and disrupting food-grade production.
Strategic mitigation requires integrated ERP genealogy, supplier API links, country-risk protocols, dual certified sources, digital certificates of analysis, lot-level mass-balance reconciliation, and 12–18 months of supplier onboarding, yet the risk cannot be fully removed because upstream data quality varies materially across oil-producing regions.
This traceability friction is estimated to reduce maximum sucrose-esters market CAGR by -1.3 percentage points across EU-linked supply chains, Southeast Asia, India, China, Latin America, and global export markets over two to four years.
Challenges Impact Analysis
| Challenge | (~) % CAGR Friction Drag | Geographic Relevance | Mitigation Horizon |
|---|---|---|---|
| Feedstock Traceability Integration | -1.3 pp | EU, Southeast Asia, global exporters | Medium term (2-4 years) |
| Multi-Grade Process Consistency | -1.1 pp | North America, EU, Japan, Korea | Medium term (2-4 years) |
| Formulation Talent Scarcity | -1.0 pp | North America, EU, developed APAC | Long term (≥ 4 years) |
| Application Data Fragmentation | -0.9 pp | Global food and nutraceutical hubs | Medium term (2-4 years) |
| Cross-Border Approval Complexity | -0.8 pp | EU, UK, APAC, Middle East | Long term (≥ 4 years) |
| Customer Scale-Up Variability | -0.7 pp | India, ASEAN, LATAM, Africa | Short term (≤ 2 years) |
Geopolitical Impact Analysis
Middle East and Russia–Ukraine Conflicts Raise Feedstock, Energy, and Freight Risks for Sucrose Esters
Ongoing geopolitical conflicts are creating fresh cost and supply risks for the sucrose esters industry in 2026. Sucrose esters depend on fatty-acid feedstocks, processing energy, and international shipping, making producers sensitive to disruptions in vegetable oils, fuel, chemicals, and freight. The Russia–Ukraine war continues to create uncertainty around Black Sea agricultural trade, while instability in the Middle East has increased pressure on global energy and shipping routes.
The strongest impact is coming through energy costs. In September 2026, the U.S. Energy Information Administration reported that Brent crude averaged US$91 per barrel in August 2026, as Middle East exports remained constrained. Higher crude prices can increase manufacturing, packaging, and transportation expenses for specialty emulsifiers such as sucrose esters.
Shipping disruptions are also important. UNCTAD reported that the Strait of Hormuz carries around one-quarter of global seaborne oil trade, while early-2026 disruptions sharply increased tanker freight, marine fuel, and war-risk insurance costs.
Regional Insights
Asia-Pacific Leads the Sucrose Esters Market with 43.22% Share and USD 42.4 Bn
In 2025, Asia-Pacific held a dominant market position, capturing more than a 43.22% share and accounting for USD 42.4 Bn. Its leadership is supported by strong chemical and food-manufacturing activity across China, Japan, South Korea, Southeast Asia, and economies.
China’s manufacture of raw chemical materials and chemical products increased 7.8% in 2025, while food processing from agricultural and sideline products advanced 5.6%. Refined sugar output reached 16.21 million tons and increased 9.0% from 2024. These trends strengthen regional availability of feedstocks and downstream processing capacity for sucrose ester applications in food and personal-care formulations.
China reported industrial value added of CNY 41.68 trillion in 2025, while manufacturing output increased 6.4% year over year. Food manufacturing value added rose 5.3%, creating a favorable demand environment for emulsifiers and stabilizers used in processed foods. Japan maintained a sizeable food-business ecosystem, with foodservice activity rising 3.2% during 2025, supporting downstream formulation demand.
Key Regions and Countries Insights
- North America
- US
- Canada
- Europe
- Germany
- France
- The UK
- Spain
- Italy
- Rest of Europe
- Asia Pacific
- China
- Japan
- South Korea
- India
- Australia
- Rest of APAC
- Latin America
- Brazil
- Mexico
- Rest of Latin America
- Middle East & Africa
- GCC
- South Africa
- Rest of MEA
Key Players Analysis
Evonik Industries AG remains a major specialty-chemicals supplier with strong capabilities in additives, care ingredients, and formulation technologies relevant to the broader sucrose esters value chain. In 2025, its Custom Solutions segment generated €5.49 billion in sales and €909 million in adjusted EBITDA, with an EBITDA margin of 16.6%. Asia-Pacific accounted for 23% of Evonik Group sales, reaching €3.21 billion, while regional sales increased 3%.
Sisterna is a specialized supplier focused directly on sucrose esters for food and personal-care applications. The company was established in 1992 as a joint venture between DKS Co. Ltd. and Royal Cosun, with the ownership ratio standing at 95:5 since 2009. Its distribution network covers more than 40 countries, while its sucrose ester powders achieve purity above 90%, compared with the regulatory minimum of 80%.
Croda International maintains a strong position in specialty ingredients used across personal care, life sciences, and industrial formulations. In 2025, the company generated total sales of £1.70 billion, up 4.4% from 2024. Consumer Care sales reached £972.7 million, increasing 5.7%, while adjusted operating profit in the division rose to £169.8 million.
Top Key Players Outlook
- Evonik Industries AG
- Sisterna
- Croda International
- Alfa Chemicals
- P&G Chemicals
- Dai-Ichi Kogyo Seiyaku
- Mitsubishi Chemical Holdings Corporation
- BASF SE
- Stearinerie Dubois
- FELDA IFFCO
- Other Key Players
Recent Developments
- In March 2025, Alfa Chemicals introduced TRIsol™ KCP, a sustainable emulsifier recommended at 1–3% use levels; company testing reported a 19% improvement in SPF performance and 2.5× higher perceived moisturisation, showing its focus on advanced emulsification technology for personal care.
- By 2026, P&G Chemicals covered 4 major product groups fatty alcohols, fatty acids, glycerin, and methyl esters—with manufacturing operations across 3 regions: Europe, Asia, and the Americas, serving customers in more than 40 countries.
Report Scope
| Report Features | Description |
|---|---|
| Market Value (2025) | USD 98.3 Bn |
| Forecast Revenue (2035) | USD 162.5 Bn |
| CAGR (2026-2035) | 5.2% |
| Base Year for Estimation | 2025 |
| Historic Period | 2020-2024 |
| Forecast Period | 2026-2035 |
| Report Coverage | Revenue Forecast, Market Dynamics, Competitive Landscape, Recent Developments |
| Segments Covered | By Form (Powder, Liquid, Pellet), By Application (Food, Personal Care, Detergents & Cleaners, Pharmaceuticals, Other Applications) |
| Regional Analysis | North America – US, Canada; Europe – Germany, France, The UK, Spain, Italy, Rest of Europe; Asia Pacific – China, Japan, South Korea, India, Australia, Singapore, Rest of APAC; Latin America – Brazil, Mexico, Rest of Latin America; Middle East & Africa – GCC, South Africa, Rest of MEA |
| Competitive Landscape | Evonik Industries AG, Sisterna, Croda International, Alfa Chemicals, P&G Chemicals, Dai-Ichi Kogyo Seiyaku, Mitsubishi Chemical Holdings Corporation, BASF SE, Stearinerie Dubois, FELDA IFFCO, Other Key Players |
| Customization Scope | Customization for segments, region/country-level will be provided. Moreover, additional customization can be done based on the requirements. |
| Purchase Options | We have three licenses to opt for: Single User License, Multi-User License (Up to 5 Users), Corporate Use License (Unlimited User and Printable PDF) |





































