


Report Overview
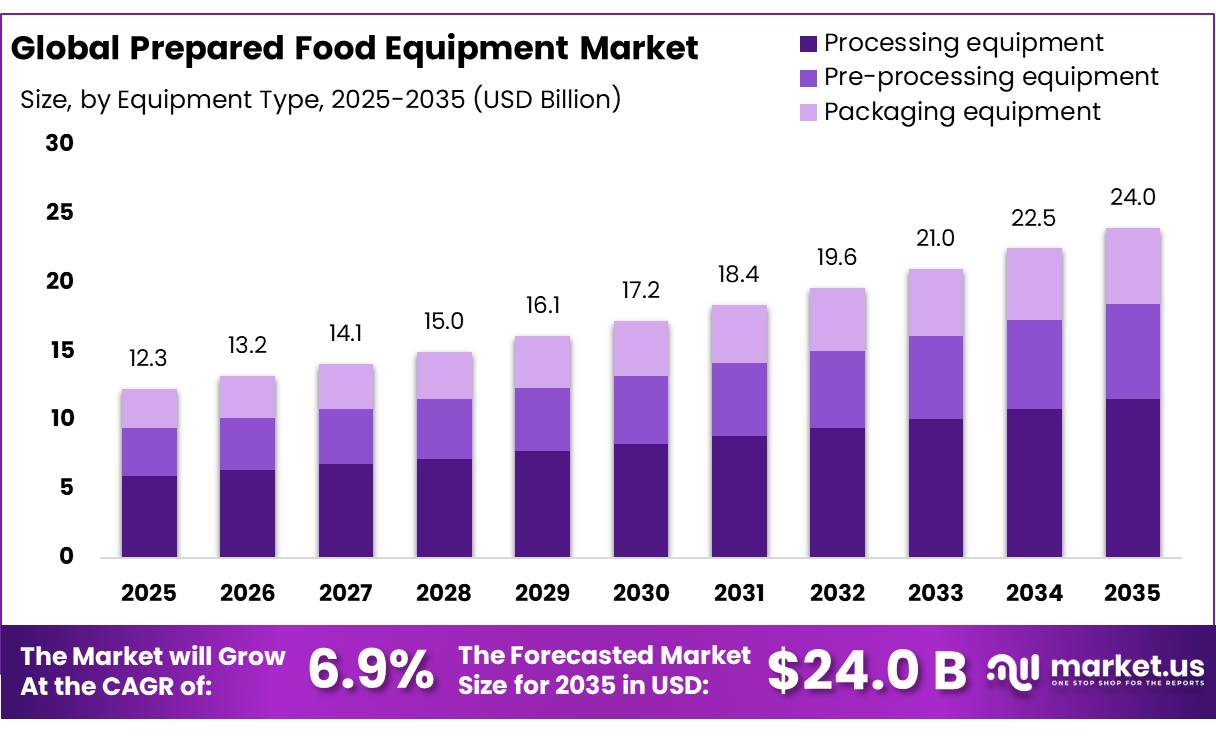
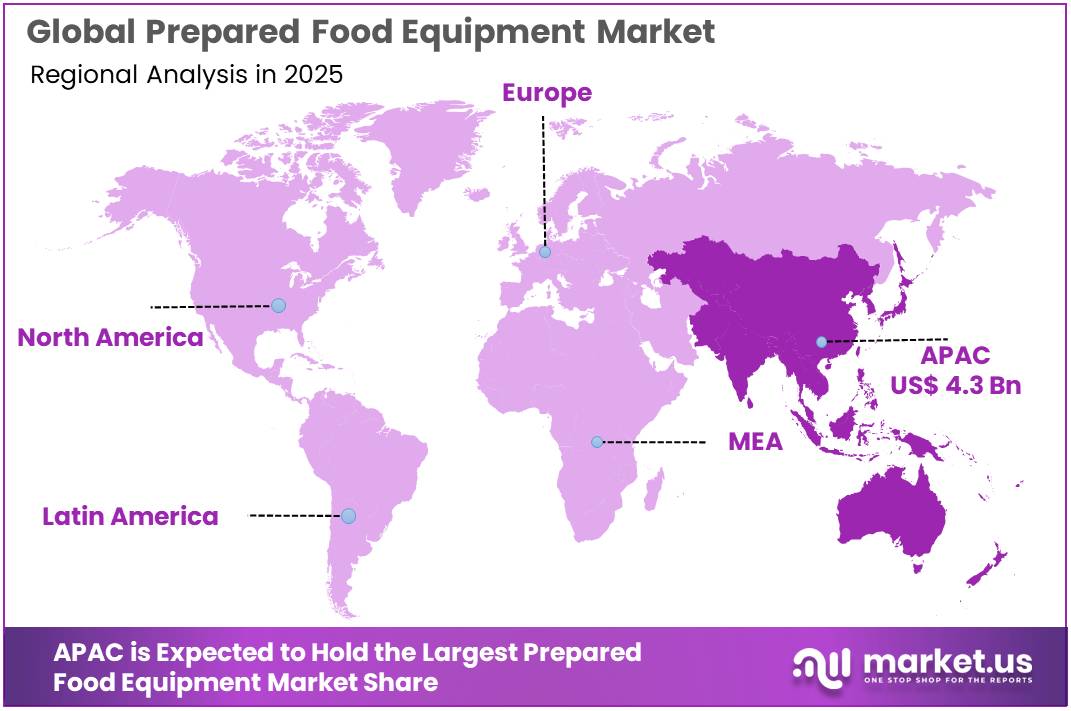
The Global Prepared Food Equipment Market size is expected to be worth around USD 24.0 Billion by 2035, from USD 12.3 Billion in 2025, growing at a CAGR of 6.9% during the forecast period from 2026 to 2035. In 2025, Asia Pacific held a dominant market position, capturing more than a 35.50% share, holding USD 4.3 Billion revenue.
The prepared food equipment industry covers machinery used to mix, cut, cook, bake, fry, cool, freeze, portion, fill, inspect, and package ready-to-eat and ready-to-cook foods. Demand is closely linked with industrial food processing, restaurants, institutional kitchens, frozen foods, snacks, meat products, bakery items, and convenience meals.
- In the United States, food and beverage processing machinery shipments reached USD 6.2 billion in 2025, increasing 3.2% from 2024. Prepared-food applications represented about 14% of the processing machinery sector, demonstrating their meaningful position within industrial food equipment demand, according to PMMI and the Food Production Solutions Association.
The industrial environment remains favorable as consumers continue allocating substantial spending toward commercially prepared meals. USDA reported total U.S. food expenditure of USD 2.51 trillion in 2025, including USD 1.41 trillion spent on food away from home. Prepared meals and foodservice consequently represented 56.3% of total food expenditure.
Europe also provides a substantial industrial base for equipment manufacturers. FoodDrinkEurope reports that the EU food and drink industry generates approximately €1.5 trillion in turnover, employs 4.8 million people, and contains around 310,000 enterprises. About 99% of these businesses are SMEs. Such a broad manufacturing network creates recurring requirements for mixers, ovens, forming systems, thermal processing lines, hygienic conveyors, inspection equipment, and flexible packaging systems capable of handling frequent product changes.
- Automation is becoming a major driving factor because food manufacturing continues to depend heavily on production labor. U.S. food manufacturing employed approximately 1.765 million workers in August 2026, while 168,370 packaging and filling machine operators were employed in the sector during 2025.
Energy efficiency is another important equipment-development area. The U.S. Department of Energy identifies more than 30,000 food and beverage manufacturing facilities nationwide and estimates that the industry accounts for around 6% of total U.S. industrial energy consumption. Approximately two-thirds of plant end-use energy is associated with manufacturing processes such as process heating.
Key Takeaways
- Prepared Food Equipment Market size is expected to be worth around USD 24.0 Billion by 2035, from USD 12.3 Billion in 2025, growing at a CAGR of 6.9%.
- Processing Equipment held a dominant market position, capturing more than a 48.00% share.
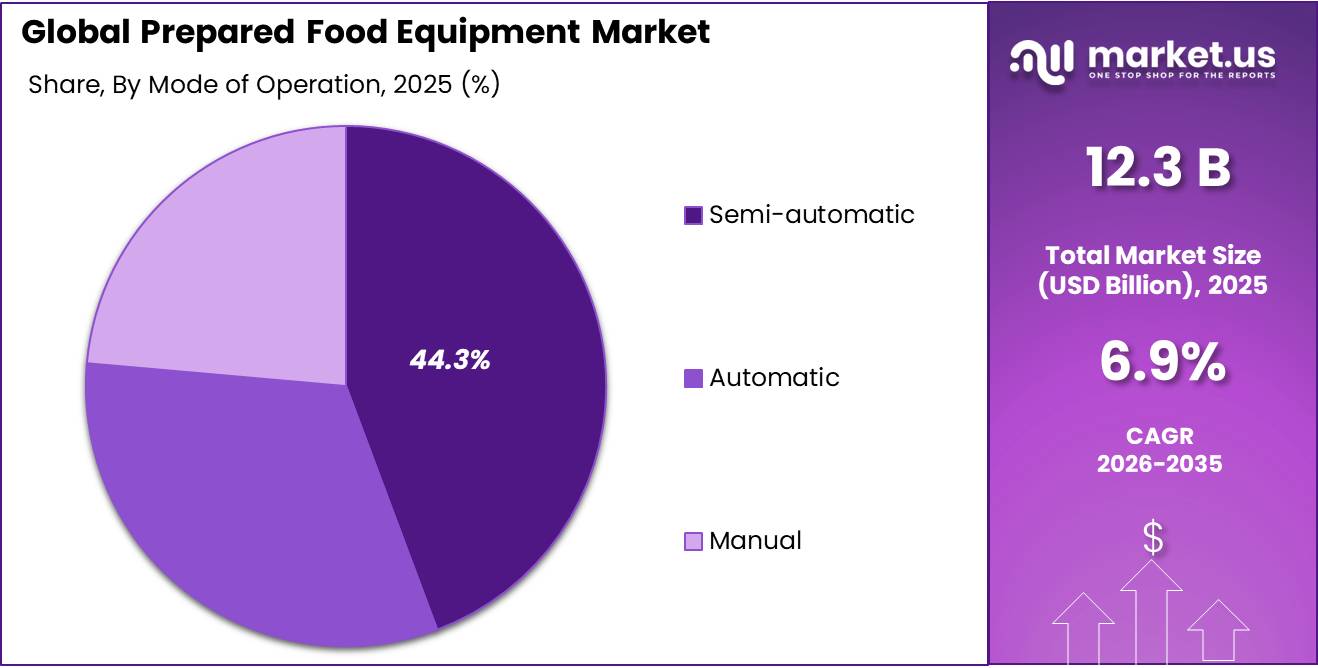
- Semi-automatic held a dominant market position, capturing more than a 44.00% share.
- Meat and seafood products held a dominant market position, capturing more than a 25.00% share.
- Food-processing companies held a dominant market position, capturing more than a 58.00% share.
- Asia Pacific held a dominant position in the Prepared Food Equipment Market, capturing more than a 35.50% share and generating about USD 4.37 billion.
By Equipment Type Analysis
Processing Equipment dominates the Prepared Food Equipment Market with more than a 48.00% share
In 2025, “Processing Equipment” held a dominant market position, capturing more than a 48.00% share. Processing equipment remained widely used across prepared food plants for cooking, mixing, cutting, forming, blending, frying, baking, and other production operations. Its strong position is supported by the large volume of food passing through commercial processing facilities.
According to the U.S. Department of Agriculture, total U.S. commercial red meat production reached 53.8 billion pounds in 2025, including 26.1 billion pounds of beef and 27.6 billion pounds of pork. Such large production volumes create continuous demand for industrial cutting, cooking, mixing, forming, portioning, and thermal-processing systems.
Pre-processing equipment remained an important part of the Prepared Food Equipment Market in 2025, as manufacturers required reliable systems for washing, sorting, grading, peeling, trimming, cutting, deboning, and preparing raw ingredients before cooking or further processing. These machines help processors maintain uniform ingredient size, reduce manual handling, improve production speed, and prepare large raw-material volumes for automated production lines.
By Mode of Operation Analysis
Semi-automatic equipment dominates with more than a 44.00% share, supported by its balance of operator control and production efficiency
In 2025, “Semi-automatic” held a dominant market position, capturing more than a 44.00% share. Semi-automatic equipment remained widely used in prepared food production because it combines machine-based processing with operator control. It is particularly suitable for mixing, cutting, filling, portioning, cooking, and packaging operations where processors need flexibility for different recipes, batch sizes, and frequent product changes.
The large workforce involved in food production also supports the continued use of semi-automatic systems. According to the U.S. Bureau of Labor Statistics, U.S. food manufacturing employed about 1.765 million people in August 2026, including approximately 1.390 million production and nonsupervisory workers. The industry also employed 168,370 packaging and filling machine operators and 144,690 food batchmakers in 2025. These figures indicate that human-operated production remains an important part of food manufacturing, supporting equipment that improves productivity while keeping operators involved in process control.
Automatic equipment remained an important operating category in the Prepared Food Equipment Market in 2025. These systems are increasingly used for continuous cooking, conveying, portioning, filling, sorting, inspection, and packaging because they can maintain consistent production speed with less direct handling. Their use is particularly relevant in large food plants where manufacturers need repeatable output, better process control, and efficient movement of products between different production stages.
By Application Analysis
Meat and seafood products dominate with more than a 25.00% share, supported by high-volume protein processing
In 2025, “Meat and seafood products” held a dominant market position, capturing more than a 25.00% share. The segment remained a major user of prepared food equipment because meat and seafood require several controlled operations, including cutting, grinding, mixing, cooking, smoking, portioning, chilling, freezing, and packaging. Large production volumes encourage processors to use equipment that can maintain consistent product quality while handling continuous production.
According to the U.S. Department of Agriculture, U.S. red meat production totaled 53.8 billion pounds in 2025. This included 26.1 billion pounds of beef and 27.6 billion pounds of pork. Poultry production was also substantial, with 62.2 billion pounds of broiler live weight produced from 9.40 billion broilers during the year. These volumes create strong requirements for industrial preparation, thermal processing, portioning, and handling equipment.
Prepared meals remained an important application area in the Prepared Food Equipment Market in 2025. Producers of ready meals, chilled foods, frozen meals, prepared entrées, and foodservice products depend on mixers, cookers, ovens, portioning systems, conveyors, cooling equipment, and packaging lines to produce large volumes with consistent taste, weight, and food-safety standards.
By End User Analysis
Food-processing companies dominate with more than a 58.00% share, supported by a large food-manufacturing base
In 2025, “Food-processing companies” held a dominant market position, capturing more than a 58.00% share. Food-processing companies remained the largest users of prepared food equipment because they depend on industrial systems for mixing, cutting, cooking, forming, filling, cooling, and packaging. These companies need reliable equipment to maintain consistent quality while processing large volumes across meat, bakery, dairy, vegetables, seafood, and specialty foods.
- The U.S. Bureau of Labor Statistics recorded 43,113 private food-manufacturing establishments in the fourth quarter of 2025, increasing to 43,277 establishments in the first quarter of 2026. Food manufacturing employed approximately 1.765 million workers in August 2026, including about 1.390 million production and nonsupervisory employees. These plants represent a broad installed base for processing, preparation, conveying, and packaging machinery.
Foodservice establishments remained an important end-user segment in the Prepared Food Equipment Market in 2025. Restaurants, cafeterias, caterers, institutional kitchens, and limited-service outlets require ovens, fryers, grills, mixers, refrigeration systems, food preparation machines, and portioning equipment to prepare meals quickly while maintaining product consistency and food-safety standards.
Key Market Segments
By Equipment Type
- Pre-processing equipment
- Processing equipment
- Packaging equipment
By Mode of Operation
- Automatic
- Semi-automatic
- Manual
By Application
- Prepared meals
- Snacks and savory products
- Meat and seafood products
- Dairy and refrigerated products
- Other applications
By End User
- Food-processing companies
- Foodservice establishments
- Retail and commercial kitchens
- Other end users
Driver Analysis
Prepared-Food Volume Growth and Production Centralization
Urbanization and the structural transfer of meal preparation from households to factories, commissaries, supermarkets, restaurants, and institutional kitchens expand the number of mixing, cutting, cooking, cooling, filling, portioning, conveying, and packaging operations required per consumed meal: the UN’s 2025 framework places 45% of the world’s 8.2 billion people in cities and tracks 33 megacities with at least 10 million inhabitants, while longer-run projections indicate that urban areas will absorb another 2.2–2.5 billion residents by 2050, primarily in Asia and Africa.
FAO evidence links urbanization and rising opportunity costs of time to increased consumption of convenient and processed food across income groups; processed products already penetrate about 63% of urban household diets in parts of East and Southern Africa versus 36% of rural household diets, illustrating how urban migration changes not only food volume but processing intensity.
The commercial signal is equally visible in the mature U.S. market: inflation-adjusted food-away-from-home expenditure reached $1.41 trillion in 2025, represented 56.3% of all food expenditure, and exceeded the $1.10 trillion food-at-home channel, creating sustained throughput demand for preparation equipment in restaurants, central kitchens, retailers, caterers, hospitals, schools, and industrial meal plants.
The modeled +2.1 percentage-point CAGR contribution assumes prepared-food output grows 2.5–4.0% annually across the addressable regions, equipment intensity rises 0.5–1.0% per tonne as producers add portion control, cooling, hygienic transfer, and secondary packaging, and 55–65% of incremental output requires either greenfield equipment or meaningful line debottlenecking; under these assumptions, a plant adding 10,000 tonnes of annual prepared-food capacity typically needs five to nine principal process modules plus inspection and packaging interfaces, converting consumer demand into multi-machine projects rather than isolated replacements.
Drivers Impact Analysis
| Driver(~) | % Impact on CAGR Forecast | Geographic Relevance | Impact Timeline |
|---|---|---|---|
| Prepared-food volume growth | +2.1% | North America, APAC, EU | Long term (≥ 4 years) |
| Labor-saving automation | +1.8% | North America, EU, East Asia | Short term (≤ 2 years) |
| Hygiene and traceability upgrades | +1.3% | North America, EU | Medium term (2-4 years) |
| Emerging-market processing CapEx | +1.5% | India, China, Southeast Asia | Medium term (2-4 years) |
| Energy-efficient replacement | +1.0% | EU, North America | Medium term (2-4 years) |
| Flexible high-mix production | +0.9% | North America, EU, urban APAC | Short term (≤ 2 years) |
Restraint Analysis
High CapEx and Financing Cost
The principal restraint is not the headline machine price but the fully installed capital requirement: prepared-food systems need sanitary utilities, drainage, reinforced floors, ventilation, refrigeration, steam, electrical upgrades, controls integration, validation, operator training, commissioning inventory, and production downtime, so a $500,000 mixer-cooker, depositor, oven, freezer, or automated cell can require an analytically modeled $625,000–$750,000 total project envelope before contingency, while a $5 million line can absorb another $1.25–$2.50 million in building and integration expenditure; this 1.25–1.50 installed-cost relationship is consistent with food-project engineering frameworks, although actual ratios vary materially by site condition and process complexity.
Financing remains restrictive in the 2026 baseline: the U.S. effective federal funds rate was 3.63% on September 10, 2026, while the ECB raised its deposit facility, refinancing, and marginal-lending rates to 2.50%, 2.65%, and 2.90%, respectively, effective September 16, increasing lease and term-loan hurdle rates above policy benchmarks after lender spreads, fees, and borrower risk are included. At an illustrative 7.5% equipment-finance rate, five-year annual debt service on $1 million is approximately $247,000 versus roughly $224,000 at 4.0%, lifting the required annual cash benefit by about $23,000 and reducing the present value of energy, labor, and yield savings; a processor demanding a sub-three-year payback must therefore prove more than $333,000 of annual gross benefit on the purchase price alone and $417,000–$500,000 on the installed project.
The modeled -1.9 percentage-point CAGR effect assumes that elevated all-in funding costs defer 15–20% of otherwise addressable projects for 12–24 months and reduce average project scope by 8–12%, shifting vendor revenue from high-margin turnkey systems toward spare parts and piecemeal upgrades; suppliers without leasing, milestone payments, performance guarantees, or equipment-as-a-service structures face the greatest order-conversion and working-capital pressure.
Restraint Impact Analysis
| Restraint(~) | % Impact on CAGR Forecast | Geographic Relevance | Impact Timeline |
|---|---|---|---|
| High CapEx and financing cost | -1.9% | North America, EU, emerging APAC | Short term (≤ 2 years) |
| Metals tariffs and input inflation | -1.4% | North America core, EU spill-over | Short term (≤ 2 years) |
| Custom integration complexity | -1.2% | Global brownfield plants | Medium term (2-4 years) |
| Compliance and cyber burden | -0.9% | EU core, North America | Medium term (2-4 years) |
| Controls and logistics disruption | -0.8% | EU-Asia, North America-Asia | Short term (≤ 2 years) |
| Thin customer margins | -1.1% | Foodservice core, SME processors | Medium term (2-4 years) |
Opportunity Analysis
Equipment-as-a-Service and Outcome Pricing
A modeled $600,000 preparation cell sold conventionally at a 28% gross margin creates $168,000 of gross profit at shipment; priced instead at $15,500 per month over 60 months, it produces $930,000 of contracted revenue, and after assuming $600,000 hardware cost basis, $90,000 maintenance, $45,000 financing and insurance, and a 5% downtime or credit reserve, it can generate approximately $148,500 of cumulative contribution plus residual equipment value, while renewal software and service can move lifetime contribution above the original sale if utilization is maintained.
For customers, replacing a $750,000 installed capital request with a two-month deposit of roughly $31,000 lowers initial cash commitment by about 96%, converts fixed investment into volume-matched operating expense, and allows the payment to be underwritten against measurable savings; for suppliers, sensorized contracts improve installed-base visibility, parts pull-through, renewal rates, and remarketing economics, but require balance-sheet capacity, standardized machines, remote diagnostics, credit scoring, and enforceable minimum-volume clauses.
The +1.7 percentage-point upside assumes that by 2031 outcome-based contracts penetrate 8–12% of addressable new placements, unlock 15–20% of projects presently deferred by CapEx constraints, and raise recognized lifetime revenue per installed unit by 20–35%; execution should begin within two years because financing friction is immediate, but success depends on separating machine credit risk from technical performance risk through special-purpose leasing partnerships and tightly defined uptime service-level agreements.
Opportunity Impact Analysis
| Opportunity(~) | % Potential CAGR Upside | Geographic Relevance | Execution Window |
|---|---|---|---|
| Equipment-as-a-Service | +1.7% | North America, EU, urban APAC | Short term (≤ 2 years) |
| SME modular automation | +1.5% | India, Southeast Asia, Latin America | Medium term (2-4 years) |
| Autonomous sanitation systems | +1.3% | North America, EU, Japan | Medium term (2-4 years) |
| Traceability data layer | +1.1% | North America, EU | Short term (≤ 2 years) |
| Waste-valorization modules | +1.0% | EU core, North America, APAC | Medium term (2-4 years) |
| Service-network roll-ups | +0.9% | North America, EU, fragmented APAC | Short term (≤ 2 years) |
Challenges Analysis
Controls Talent Scarcity
Prepared-food equipment is becoming a hybrid mechanical, controls, data and hygienic-engineering stack, but the technician base capable of commissioning robots, tuning servo motion, diagnosing PLC networks, validating food-safety interlocks and securing remote access is expanding more slowly than the installed base; U.S. manufacturing had 580,000 seasonally adjusted job openings in July 2026, up from 450,000 in March, while the broader sector may need 3.8 million workers between 2024 and 2033 and could leave 1.9 million positions unfilled without stronger recruitment and reskilling.
The scarcity is also structural in Europe, where nearly four in five SMEs report difficulty finding needed talent, and employers in several major industrial economies continue to flag manufacturing, engineering, IT and data capabilities as hard to source. For prepared-food equipment vendors, this does not stop orders; it creates persistent friction through commissioning queues, premium field-service rates, slower factory-acceptance testing, reduced first-time-fix rates and underutilized advanced features after handover.
The modeled -1.4 percentage-point drag assumes that, across exposed projects, scarce specialists add roughly 2–6 weeks to commissioning, lift engineering and service labor content by an estimated 8–15%, and defer 5–8% of otherwise feasible annual deployments—a scenario estimate rather than an observed industry statistic. Sustainable mitigation requires OEM-run academies, remote-assist centers, standardized PLC/HMI libraries, simulation-based commissioning and tiered certification for customer technicians; because proficiency across automation, sanitation and food-process validation typically demands multiple project cycles, normalization is unlikely within a two-year hiring program and remains a ≥4-year capability-building challenge.
Challenges Impact Analysis
| Challenge(~) | % CAGR Friction Drag | Geographic Relevance | Mitigation Horizon |
|---|---|---|---|
| Controls Talent Scarcity | -1.4 pp | North America, EU, Japan | Long term (≥ 4 years) |
| Legacy System Interoperability | -1.2 pp | North America, EU, APAC | Medium term (2–4 years) |
| SKU Changeover Complexity | -1.1 pp | North America, EU, urban APAC | Medium term (2–4 years) |
| Sanitation–Utility Trade-offs | -0.9 pp | EU, North America, water-stressed APAC | Long term (≥ 4 years) |
| Component Lifecycle Volatility | -0.8 pp | EU–APAC corridors, North America | Medium term (2–4 years) |
| OT Cybersecurity Exposure | -1.0 pp | North America, EU, APAC | Long term (≥ 4 years) |
Geopolitical Impact Analysis
The ongoing Russia–Ukraine war and conflict around the Middle East are affecting the Prepared Food Equipment market through energy costs, shipping disruption, raw-material availability, and delayed industrial investment. Equipment manufacturers depend on stainless steel, electrical parts, motors, sensors, refrigeration components, and international freight, making geopolitical disruption important for production planning. The Ukraine war also continues to affect Black Sea trade and global food supply routes.
In September 2026, the U.S. Energy Information Administration reported that Brent crude averaged USD 91 per barrel in August, USD 7 higher than July. It also estimated Middle East crude-oil production shut-ins at 6.7 million barrels per day during August as shipping and export constraints affected the region. Higher energy and transport costs can increase manufacturing, logistics, and installation expenses for food-processing machinery.
Shipping risk is another concern. UN Trade and Development states that maritime transport carries more than 80% of world merchandise trade by volume, while disruptions around the Red Sea, Suez Canal, Black Sea, and Strait of Hormuz have forced changes in routes and schedules. For prepared food equipment suppliers, this can lengthen delivery times for imported components and machinery. Food processors may favor energy-efficient, automated, locally serviceable equipment to reduce exposure to supply disruptions.
Regional Insights
In 2025, Asia Pacific held a dominant position in the Prepared Food Equipment Market, capturing more than a 35.50% share and generating about USD 4.37 billion. The region benefits from a large food-processing base, rapid urbanization, expanding organized foodservice, and rising demand for convenient meals.
Asia Pacific is also positioned as the fastest-growing regional opportunity as food manufacturers continue expanding capacity and modernizing plants. UNIDO reported that Asia and the Pacific led global manufacturing production and trade in the first quarter of 2026, when worldwide manufacturing production increased by 1.2% and manufacturing exports rose by 3.5%.
Higher-technology manufacturing output increased by 1.9%, while related exports climbed 4.7%. This stronger industrial environment supports greater adoption of automated controls, efficient motors, sensors, robotics, hygienic systems, and digitally connected machinery across prepared food factories, particularly where producers are moving toward higher throughput and more standardized production.
Key Regions and Countries Insights
- North America
- US
- Canada
- Europe
- Germany
- France
- The UK
- Spain
- Italy
- Rest of Europe
- Asia Pacific
- China
- Japan
- South Korea
- India
- Australia
- Rest of APAC
- Latin America
- Brazil
- Mexico
- Rest of Latin America
- Middle East & Africa
- GCC
- South Africa
- Rest of MEA
Key Players Analysis
GEA Group is a major supplier of processing technology for food, beverage, and pharmaceutical industries. In 2025, the company generated EUR 5.495 billion in revenue, while order intake reached EUR 5.924 billion. EBITDA before restructuring expenses rose to EUR 907.4 million, with a 16.5% margin. GEA employed 18,628 full-time employees at year-end. Its Food & Healthcare Technologies division generated EUR 1.058 billion in revenue, supported by demand for food-processing and packaging lines.
JBT Marel Corporation strengthened its position in prepared food equipment after completing the Marel acquisition in January 2025. The combined company generated USD 3.798 billion in 2025 revenue and employed about 11,500 people worldwide. Its Prepared Food and Beverage Solutions segment produced USD 2.082 billion in revenue and USD 358.7 million in adjusted EBITDA, with a 17.2% margin. Around 50% of total company revenue came from recurring revenue, supporting service, parts, and aftermarket activities.
Bühler Group remains an important technology supplier to food, grain, feed, and advanced-material industries. In 2025, its Grains & Food business generated CHF 2.164 billion in turnover, while order intake reached CHF 2.147 billion. The group employed 12,092 people and operated across more than 140 countries. Its global network included 90 sales offices, 105 service stations, 27 manufacturing sites, and 26 research and training centers, supporting equipment development, customer service, and food-processing solutions.
Top Key Players Outlook
- GEA Group
- JBT Marel Corporation
- Bühler Group
- Tetra Laval Group
- Alfa Laval
- SPX FLOW
- The Middleby Corporation
- Krones AG
- Heat and Control
- MULTIVAC Group
- IMA Group
- Ali Group
- Dover Corporation
- Hosokawa Alpine
- Provisur Technologies
Recent Developments
- In March 2026, Tetra Pak began expanding its Denton Product Development Center with 12,000 square feet of development space and an additional 3,000 square feet Customer Innovation Center, scheduled to open in 2027. In July 2026, it launched the Tetra Pak Bioreactor RF, its first industrial bioreactor, designed to deliver up to 12% lower operational costs.
- July 2026, when Middleby completed the spin-off of Midera as an independent Nasdaq-listed food-processing company. Midera entered the market with more than 100,000 installed equipment units, over 30 established brands, and approximately 2,800 employees, giving the former Middleby Food Processing operation greater focus for new product development, automation, acquisitions, and prepared-food production technology.
Report Scope
| Report Features | Description |
|---|---|
| Market Value (2025) | USD 12.3 Bn |
| Forecast Revenue (2035) | USD 24.0 Bn |
| CAGR (2026-2035) | 6.9% |
| Base Year for Estimation | 2025 |
| Historic Period | 2020-2024 |
| Forecast Period | 2026-2035 |
| Report Coverage | Revenue Forecast, Market Dynamics, Competitive Landscape, Recent Developments |
| Segments Covered | By Equipment Type (Pre-processing equipment, Processing equipment, Packaging equipment), By Mode of Operation (Automatic, Semi-automatic, Manual), By Application (Prepared meals, Snacks and savory products, Meat and seafood products, Dairy and refrigerated products, Other applications), By End User (Food-processing companies, Foodservice establishments, Retail and commercial kitchens, Other end users) |
| Regional Analysis | North America – US, Canada; Europe – Germany, France, The UK, Spain, Italy, Rest of Europe; Asia Pacific – China, Japan, South Korea, India, Australia, Singapore, Rest of APAC; Latin America – Brazil, Mexico, Rest of Latin America; Middle East & Africa – GCC, South Africa, Rest of MEA |
| Competitive Landscape | GEA Group, JBT Marel Corporation, Bühler Group, Tetra Laval Group, Alfa Laval, SPX FLOW, The Middleby Corporation, Krones AG, Heat and Control, MULTIVAC Group, IMA Group, Ali Group, Dover Corporation, Hosokawa Alpine, Provisur Technologies |
| Customization Scope | Customization for segments, region/country-level will be provided. Moreover, additional customization can be done based on the requirements. |
| Purchase Options | We have three licenses to opt for: Single User License, Multi-User License (Up to 5 Users), Corporate Use License (Unlimited User and Printable PDF) |





































