


Report Overview
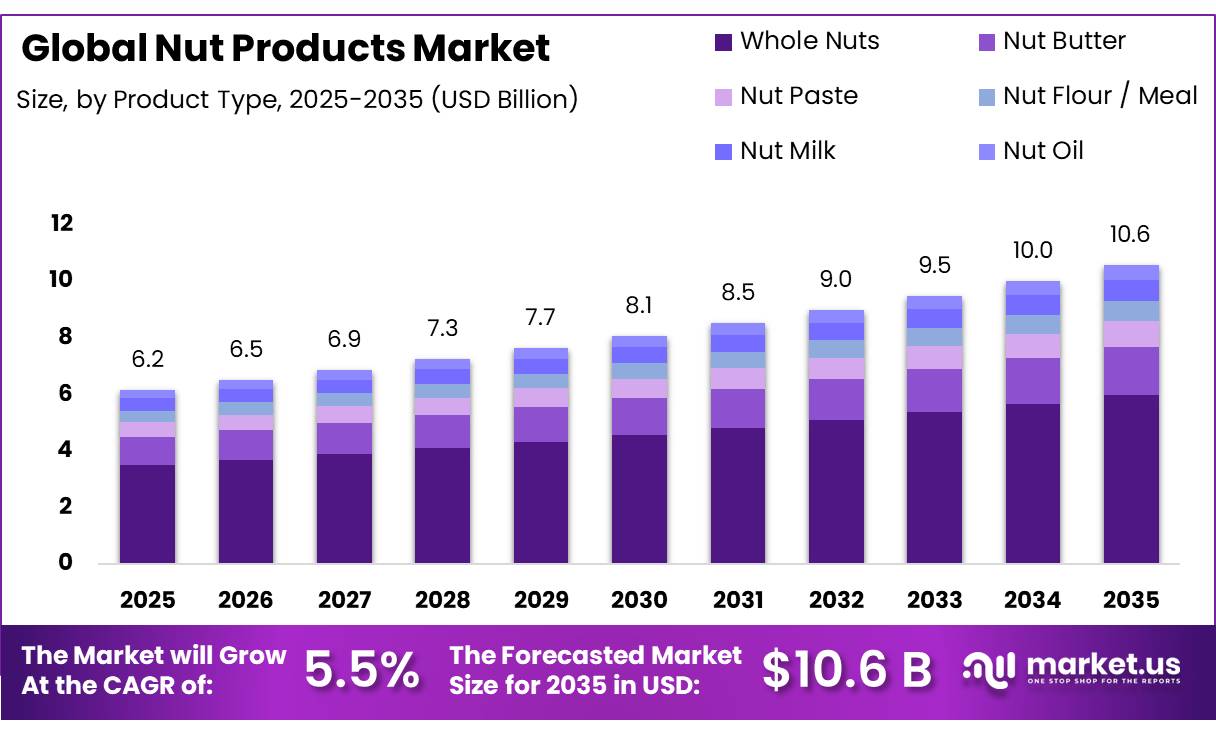
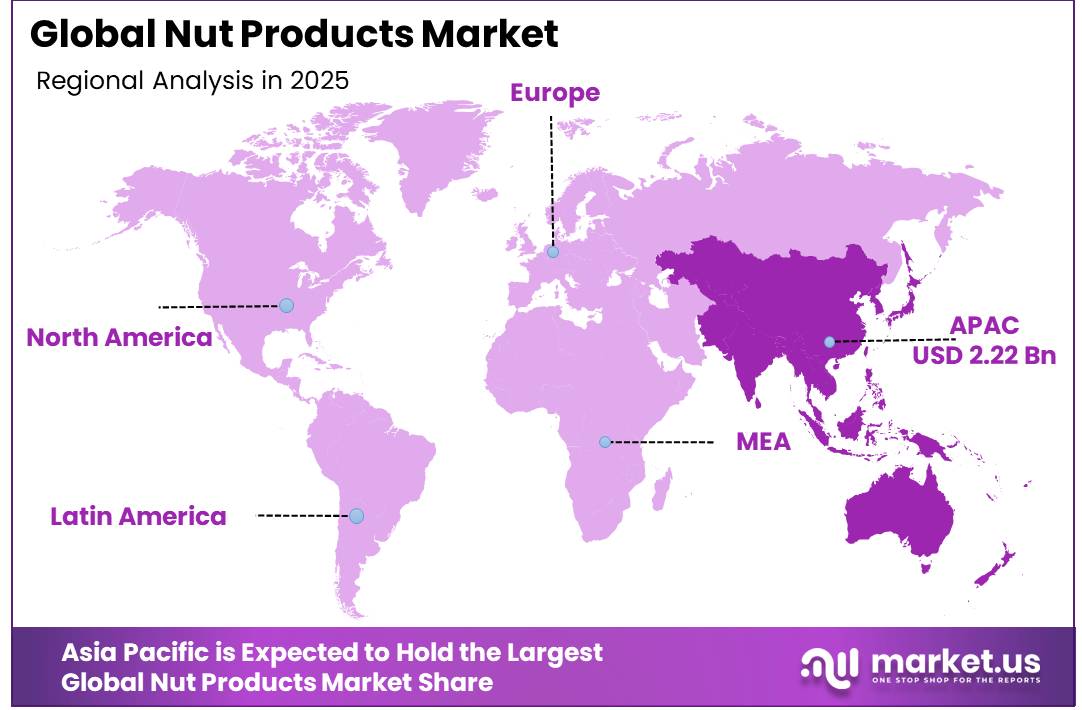
In 2025, the Global Nut Products Market was valued at USD 6.2 billion, and between 2026 and 2035, this market is estimated to register a CAGR of 5.5%, reaching about USD 10.6 billion by 2035. Asia Pacific held a dominant market position, capturing more than a 36.0% share, holding USD 2.22 billion in revenue.
The Nut Products Market covers whole nuts and processed formats such as butter, paste, flour, milk, and oil used across retail, foodservice, and food manufacturing. Supply availability remains a central industry factor because processors depend on stable harvest volumes and consistent quality.
- United States Department of Agriculture data for California show 2025 almond utilization at 715 billion pounds, with 1.4 million acres recorded and production value reaching USD 6.8744 billion, supporting sizeable downstream processing activity.
Key Takeaways
- The global Nut Products Market was valued at USD 6.2 billion in 2025.
- The global Market is projected to grow at a CAGR of 5.5% and is estimated to reach USD 10.6 billion by 2035.
- On the basis of product type, Whole Nuts dominated the market, constituting 56.7% of the total market share.
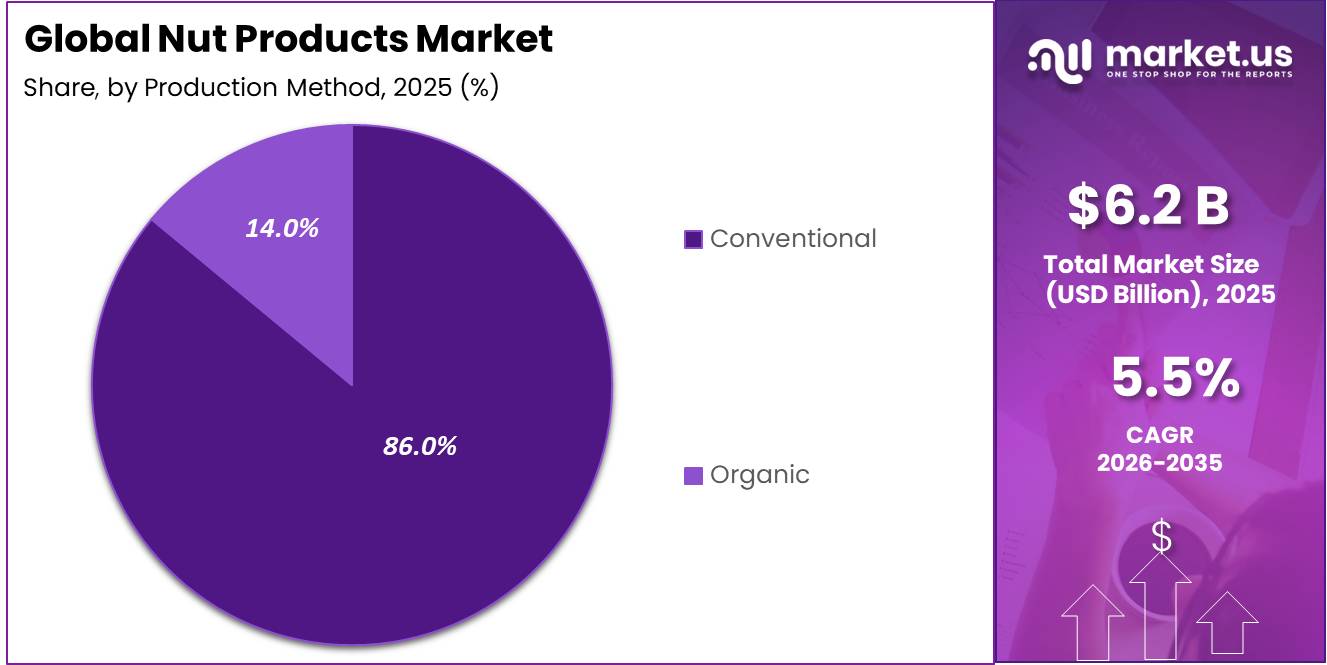
- Based on the production method, Conventional dominated the Nut Products Market, with a substantial market share of around 86.0%.
- Among the end-users, Food & Beverage Processing held a major share in the Nut Products Market, accounting for 41.0% of the market share.
- Based on packaging, Pouches & Bags led the market, comprising 47.0% of the total market.
- Among the distribution channels, Supermarkets & Hypermarkets held a major share in the Nut Products Market, accounting for 38.0% of the market share.
- In 2025, Asia Pacific was the most dominant region in the Nut Products Market, accounting for 36.0% of the total market share.
The industrial scenario is also supported by strong output across other tree nuts used in snacks, spreads, bakery products, beverages, and ingredients. United States Department of Agriculture 2025 data show California pistachio utilization at 1.58 billion pounds, with production valued at USD 3.9184 billion. English walnut utilization reached 809,000 tons. These volumes provide processors with substantial raw material for roasting, grinding, blending, extraction, packaging, and development of value-added nut products for domestic and export channels.
- Demand is being supported by nutrition positioning and consumer interest in nutrient-dense foods. The United States Food and Drug Administration states that nuts and seeds can qualify for the updated “healthy” claim under specified conditions. For nut, seed, and soy products, the criteria require at least 1 ounce equivalent from the food group, while added sugar is limited to 1 gram and sodium to 230 milligrams per reference amount, creating opportunities for compliant product reformulation.
Government nutrition policy is creating further room for minimally processed nut products and cleaner formulations. The United States Department of Agriculture released the current Dietary Guidelines in January 2026, placing emphasis on whole, healthy, nutrient-rich foods and limiting highly processed products. The guidance is the 10th edition and is supported by a daily-servings framework covering 12 calorie levels, ranging from 1,000 to 3,200 calories per day, giving manufacturers clearer direction for portioning and product positioning.
By Product Type
Whole Nuts dominate with 56.70% due to broad consumer acceptance, while Nut Butter gains momentum
In 2025, Whole Nuts held a dominant market position, capturing more than a 56.70% share of the Nut Products Market by product type. Their leadership reflects broad use as snacks and ingredients across retail, bakery, confectionery, cereals, and foodservice. Whole nuts benefit from simple processing, formats, shelf stability, and availability across supermarkets, stores, and online channels. Demand remains supported by consumer preference for convenient foods retaining texture, flavor, and nutritional value.
- In July 2026, according to the United States Department of Agriculture Economic Research Service, almond production was forecast at 2.7 billion pounds for 2026, with bearing acreage projected at 1.39 million acres and output expected to decrease by 15 million pounds from the previous season.
Nut Butter is the growing segment in the Nut Products Market. Its growth is supported by spreadable formats and use in breakfast foods, bakery recipes, smoothies, snacks, sauces, and protein-focused products. Manufacturers are widening product choice through smooth and crunchy textures, blended nut varieties, portion packs, and formulations for retail and food-processing applications. This supports wider use across household and commercial food preparation channels.
Production Method Analysis
Conventional dominates with 86.00% due to established supply, while Organic gains steadily
In 2025, Conventional held a dominant market position, capturing more than a 86.00% share of the Nut Products Market by production method. Its leadership reflects the use of conventionally produced almonds, walnuts, pistachios, peanuts, and other nuts across retail and food processing. Conventional production supports large-scale sourcing, established farming practices, consistent availability, and supply to manufacturers producing snacks, spreads, bakery ingredients, beverages, and packaged products.
- In December 2025, according to the United States Department of Agriculture Risk Management Agency, 2026 crop-year almond additional price elections were set at USD 2.25 per pound for conventional production and USD 3.40 per pound for organic production. The corresponding established prices were USD 1.70 per pound for conventional almonds and USD 2.55 per pound for organic almonds.
Organic is the growing segment in the Nut Products Market. Demand is supported by consumers seeking certified production methods, traceable sourcing, and products aligned with organic food preferences. Producers are expanding organic nut offerings across whole nuts, nut butters, pastes, flours, oils, and beverages, while certification and differentiated pricing support participation in premium retail and specialty channels.
End-User Analysis
Food & Beverage Processing dominates with 41.00% due to broad ingredient use, while Foodservice / HoReCa grows steadily
In 2025, Food & Beverage Processing held a dominant market position, capturing more than a 41.00% share of the Nut Products Market by end-user. The segment benefits from use of nuts in bakery products, confectionery, cereals, spreads, beverages, sauces, snacks, and prepared foods. Processors value nuts for flavor, texture, nutrition, and versatility, while innovation supports wider incorporation of nut ingredients across packaged foods.
- In June 2026, according to the United States Department of Agriculture Economic Research Service, food-away-from-home spending reached USD 1.41 trillion in 2025 and represented 56.3% of total food expenditures. Full-service establishment sales reached USD 488.4 billion, while limited-service establishment sales totaled USD 516.1 billion during 2025.
Foodservice / HoReCa is the growing segment in the Nut Products Market. Restaurants, hotels, cafés, caterers, and institutional kitchens increasingly use nuts in desserts, breakfast dishes, salads, sauces, beverages, bakery items, and menu offerings. The segment benefits from rising food-away-from-home activity, menu diversification, and demand for ingredients that add texture, flavor, and visual appeal. Nut butters, pastes, flours, oils, and whole nuts give kitchens flexible options for sweet and savory preparations.
Packaging Analysis
Pouches & Bags dominate with 47.00% due to flexible handling, while Jars & Bottles gain steadily
In 2025, Pouches & Bags held a dominant market position, capturing more than a 47.00% share of the Nut Products Market by packaging. Their leadership reflects wide use for whole nuts, nut mixes, roasted products, flour, and snack formats. Flexible packaging supports lightweight handling, resealing, product protection, storage convenience, and efficient transport, helping manufacturers serve retail, foodservice, and online channels with different pack sizes and practical formats suited to everyday purchasing needs.
- In June 2026, according to the Flexible Packaging Association, the POUCH3 format cut packaging use by up to 40%, while Emerald Packaging’s food-contact potato bag incorporated 30% post-consumer recycled content.
Jars & Bottles are the growing segment in the Nut Products Market. Demand is supported by nut butters, pastes, oils, and other products that benefit from rigid, resealable containers. These formats provide convenient dispensing, repeated opening and closing, shelf visibility, and product protection, supporting wider adoption across household retail, specialty stores, foodservice outlets, and premium product ranges where reusable packaging and easy product access remain important purchasing considerations for many consumers seeking convenient storage and dependable daily handling.
Distribution Channel Analysis
Supermarkets & Hypermarkets dominate with 38.00% due to broad assortment, while Convenience Stores expand steadily
In 2025, Supermarkets & Hypermarkets held a dominant market position, capturing more than a 38.00% share of the Nut Products Market by distribution channel. Their leadership is supported by wide product availability, strong shelf visibility, bulk purchasing, and access to branded and private-label nut products. These stores offer whole nuts, nut butters, oils, flours, and snack packs across multiple price points, supporting household purchases.
- In April 2026, according to the National Association of Convenience Stores, U.S. convenience-store in-store sales reached USD 341.2 billion in 2025, increasing 1.7% from the previous year, while the national store count stood at 151,975 locations.
Convenience Stores are the growing segment in the Nut Products Market. Their expansion is supported by demand for portable snacks, single-serve packs, impulse purchases, and quick meal options. Nuts fit well within convenience retail because they require limited preparation, offer easy storage, and can be sold in compact packages near checkout areas or grab-and-go sections. Wider use of resealable pouches, flavored nuts, mixed nut packs, and protein-focused snacks also supports stronger placement across convenience outlets serving commuters and time-sensitive consumers.
Key Market Segments
By Product Type
- Whole Nuts
- Nut Butter
- Nut Paste
- Nut Flour / Meal
- Nut Milk
- Nut Oil
By Production Method
- Conventional
- Organic
By End-User
- Food & Beverage Processing
- Foodservice / HoReCa
- Household / Retail
By Packaging
- Pouches & Bags
- Jars & Bottles
- Cans & Tins
- Bulk
By Distribution Channel
- Supermarkets & Hypermarkets
- Convenience Stores
- Specialty Stores
- Online Retail / E-Commerce
- B2B / Direct Industrial Supply
Driver Analysis
Health-led plant protein and healthy-fat positioning
Health-oriented food purchasing is the largest demand-side growth engine because nut products occupy a commercially attractive space between conventional snacks and higher-priced specialist nutrition products: WHO notes that shifting toward plant protein can benefit many adults when it replaces red meat, while FAO includes nuts within the core food groups of plant-based dietary patterns. In the model, this adds approximately 1.1 percentage points to 2026–2031 CAGR by allowing processors to sell portion-controlled, lightly processed, no-added-sugar and protein-positioned products at higher revenue per kilogram than bulk kernels.
A 28–30 g serving is a commercially useful pack-size threshold: it supports calorie control messaging, enables price points suited to convenience retail and digital subscriptions, and reduces the consumer’s upfront spend versus a 200–500 g family pack. The business-model implication is a migration from commodity trading margins toward branded gross-margin pools in roasted nuts, nut-and-fruit mixes, nut butters, flour blends and protein-oriented snack bars; however, claims discipline is essential, since brands that rely on broad “healthy” language without managing sodium, added sugar and allergen communication will struggle to sustain premium pricing.
Drivers Impact Analysis
| Driver | (\~) % Impact on CAGR | Geographic Relevance | Impact Timeline |
|---|---|---|---|
| Health-led plant protein and healthy-fat positioning | +1.1% | North America, EU, urban APAC | Medium term (2–4 years) |
| Convenient premium snack and functional formats | +0.9% | North America, EU, GCC, APAC metros | Short term (≤ 2 years) |
| Larger almond, pistachio and walnut supply base | +0.8% | U.S., Australia, Türkiye, Iran, EU, India import market | Short term (≤ 2 years) |
| India and Asian import-demand expansion | +0.6% | India core, China, ASEAN, Gulf re-export hubs | Medium term (2–4 years) |
| Nut ingredients in bakery, confectionery and beverages | +0.4% | EU, North America, China, Japan, South Korea | Medium term (2–4 years) |
| Traceability, safety and recyclable packaging value capture | +0.3% | EU, U.S., UK, export-oriented APAC | Long term (≥ 4 years) |
Restraint Analysis
Climate-driven crop volatility
Climate and alternate-bearing exposure are the most significant structural restraint because a small group of origins determines the availability and cost of major commercial nut types: the United States represented 39% of global tree-nut production in 2023/24, followed by China at 12% and Türkiye at 10%, creating substantial exposure to regional weather, irrigation conditions and orchard-yield cycles. California’s 2025 almond forecast was 2.80 billion pounds, illustrating the scale at which one producing region can influence global kernel availability and contract pricing.
The modeled -1.0 percentage-point CAGR impact arises when drought, frost, heat stress, poor pollination or alternate-bearing declines reduce merchantable yield, while processors still carry fixed roasting, packing, labour and distribution costs; a 10% raw-material price increase cannot always be passed through to retail packs without reducing unit velocity. The resulting value destruction is greatest in private-label snacks, bakery ingredients and nut butters, where raw nuts can represent roughly 45–70% of finished-product cost of goods, depending on formulation and pack format, forcing brands either to compress gross margin, reformulate toward lower-cost inclusions or delay promotional activity.
Restraint Impact Analysis
| Restraint | (\~) % Impact on CAGR | Geographic Relevance | Impact Timeline |
|---|---|---|---|
| Climate-driven crop volatility | -1.0% | U.S., Türkiye, Iran, Australia, EU | Medium term (2–4 years) |
| Tariffs and freight-cost shocks | -0.8% | China, India, EU, GCC, APAC | Short term (≤ 2 years) |
| Aflatoxin and quality rejections | -0.6% | EU, Japan, U.S., export APAC | Short term (≤ 2 years) |
| Premium-price demand elasticity | -0.5% | India, ASEAN, LATAM, Africa | Short term (≤ 2 years) |
| Allergen-control complexity | -0.4% | North America, EU, UK, APAC | Medium term (2–4 years) |
| Fragmented processing and wastage | -0.3% | India, Africa, ASEAN, LATAM | Medium term (2–4 years) |
Opportunity Analysis
Precision nutrition platforms
FDA defines medical foods narrowly as products formulated for the dietary management of a disease or condition with distinctive nutritional requirements and used under physician supervision, so companies should not treat ordinary nut snacks as medical foods without the necessary evidence, formulation and clinical pathway.
The commercial white space lies between mainstream snacks and regulated medical nutrition: a processor can develop 20–35 g portion-controlled nut, seed and fibre blends; low-added-sugar spreads; powdered formats; and dietitian-supported subscription packs, then monetise through e-pharmacies, employer wellness programmes, diagnostics partners and premium direct-to-consumer memberships.
In the model, a brand shifting only 8–12% of its sales mix into clinically informed or personalised formats could obtain a 300–800 basis-point gross-margin improvement versus commodity roasted nuts through higher realised price, lower retailer dependence and recurring subscription revenue, supporting a potential +0.9 percentage-point category CAGR uplift if scaled across developed markets.
Opportunity Impact Analysis
| Opportunity | (\~) % Potential CAGR | Geographic Relevance | Execution Window |
|---|---|---|---|
| Precision nutrition platforms | +0.9 pp | North America, EU, Japan, GCC | Medium term (2–4 years) |
| Standardised B2B nut ingredients | +0.7 pp | EU, North America, China, India | Short term (≤ 2 years) |
| Localised India–ASEAN value chains | +0.7 pp | India, ASEAN, GCC | Medium term (2–4 years) |
| By-product valorisation | +0.6 pp | U.S., EU, India, Australia | Medium term (2–4 years) |
| Traceable premium sourcing platforms | +0.5 pp | EU, U.S., Japan, export APAC | Short term (≤ 2 years) |
| Vertical M&A roll-up platforms | +0.4 pp | U.S., EU, India, Türkiye, Vietnam | Long term (≥ 4 years) |
Challenges Analysis
Crop-cycle inventory planning
Crop-cycle inventory planning is a persistent operating challenge because nut processors must convert biologically variable, annually harvested inputs into stable, year-round retail and ingredient supply, while major origins remain concentrated: the United States accounted for 39% of global tree-nut production in 2023/24, China for 12% and Türkiye for 10%. Almond, pistachio and walnut yields can shift sharply with alternate-bearing cycles, heat, frost, pollination, water conditions and orchard age, creating a mismatch between crop forecasts, customer contracts and packaging commitments; for context, California’s 2025 almond forecast alone was 2.80 billion pounds, meaning a single revised crop outlook can rapidly alter global procurement behaviour.
The modeled -0.9-percentage-point CAGR friction reflects the cost of carrying 4–9 months of strategic inventory, forecasting errors that can leave processors overstocked with slow-moving grades, and working-capital lock-up when raw kernels must be purchased before final retail demand is visible. Companies need multi-origin sourcing matrices, crop-linked index contracts, monthly grade-level demand planning, probabilistic yield scenarios and product formulations capable of switching between nut types or grades; the challenge remains long term because no amount of analytics eliminates the agricultural production cycle.
Challenges Impact Analysis
| Challenge | (\~) % CAGR Friction | Geographic Relevance | Mitigation Horizon |
|---|---|---|---|
| Crop-cycle inventory planning | -0.9 pp | U.S., Türkiye, Iran, Australia | Long term (≥ 4 years) |
| Multi-origin logistics coordination | -0.8 pp | EU, India, China, GCC, APAC | Medium term (2–4 years) |
| Processing-skills automation gap | -0.6 pp | North America, EU, India, Vietnam | Medium term (2–4 years) |
| Allergen changeover validation | -0.5 pp | U.S., EU, UK, export APAC | Long term (≥ 4 years) |
| Recyclable barrier-pack transition | -0.4 pp | EU, UK, North America | Medium term (2–4 years) |
| Demand-data fragmentation | -0.4 pp | Global, especially emerging APAC | Medium term (2–4 years) |
Geopolitical Impact Analysis
Trade Frictions and Shipping Disruptions Reshaping Nut Products Supply Chains
Current geopolitical tensions are reshaping the Nut Products Market through tariff changes, trade-route disruption, and shifting access to import destinations. In February 2025, the United States Department of Agriculture Economic Research Service estimated that higher Turkish tariffs could reduce U.S. almond exports to Türkiye by 19.4% and walnut exports by 26.6%, highlighting exposure to policy-driven changes in demand.
- In May 2025, the United States Department of Agriculture Foreign Agricultural Service reported that tariff increases that had reached 125% were reduced to 10%, while retaliatory tariffs of 10% to 15% on U.S. agricultural products remained. Such policy changes can alter sourcing, pricing, and destination planning for nut exporters.
Shipping instability adds geopolitical pressure. In September 2025, United Nations Trade and Development projected maritime trade growth at 0.5% for 2025 and noted that shipping carries over 80% of world trade. Red Sea diversions and volatile freight conditions can raise transport costs for traded nuts and nut products.
Trade agreements can create offsetting opportunities. In August 2025, the European Union and United States framework proposed preferential European Union market access for U.S. tree nuts, while the United States committed to a 15% tariff framework for originating European Union goods. These shifts encourage exporters to diversify markets, reassess logistics, and strengthen processing and sourcing flexibility.
Regional Analysis
Asia Pacific dominates with 36.00% share and USD 2.22 billion, while North America grows fastest
In 2025, Asia Pacific held a dominant position in the Nut Products Market, capturing more than a 36.00% share and generating around USD 2.22 billion. The region benefits from consumer bases, established food-processing industries, expanding retail, and strong availability of almonds, walnuts, pistachios, cashews, and nuts.
- United States Department of Agriculture Foreign Agricultural Service data for the 2024/2025 season placed Australia’s almond production at 160,000 metric tons and China’s at 24,000 metric tons, supporting regional processing and trade activity.
North America is the fastest-growing region in the Nut Products Market, supported by snack consumption, product innovation, and expanding use of nuts in spreads, bakery foods, beverages, and convenience products. United States Department of Agriculture Foreign Agricultural Service data for 2025/2026 estimated U.S. peanut production at 3.257 million metric tons, about 18% above the five-year average. The region also benefits from established processing capacity and supermarket, foodservice, and online distribution networks.
Key Regions and Countries Covered
- North America
- The US
- Canada
- Europe
- Germany
- France
- The UK
- Spain
- Italy
- Russia & CIS
- Rest of Europe
- APAC
- China
- Japan
- South Korea
- India
- ASEAN
- Rest of APAC
- Latin America
- Brazil
- Mexico
- Rest of Latin America
- Middle East & Africa
- GCC
- South Africa
- Rest of MEA
Key Players Analysis
Nut products manufacturers focus on processing scale, product quality, sourcing resilience, and portfolio breadth to strengthen competitive positioning. In 2026, Olam Group through ofi remained active across almonds, cashews, hazelnuts, pistachios, and macadamias, supported by crop monitoring. Select Harvests Limited also emphasized integrated almond operations, with its Carina West facility capable of processing more than 50,000 metric tonnes during peak season, supporting whole, inshell, and value-added products.
Competition is shaped by branded offerings, private-label supply, distribution reach, and processing efficiency. John B. Sanfilippo & Son, Inc. continued operating across peanuts, pecans, cashews, walnuts, almonds, nut butters, snack mixes, and related products during fiscal 2026. Companies are therefore investing in automation, traceability, differentiated flavors, packaging flexibility, and stronger supplier relationships. Broader retail and ingredient portfolios help improve customer retention, while integrated sourcing and processing support cost control and consistent quality across consumer, foodservice, and industrial channels.
Market Key Players
- Olam Group (ofi – Olam Food Ingredients)
- Barry Callebaut AG
- Blue Diamond Growers
- Wonderful Pistachios & Almonds
- Archer-Daniels-Midland Company
- John B. Sanfilippo & Son, Inc.
- Mondelez International, Inc.
- Kerry Group plc
- Select Harvests Limited
- Mariani Nut Company, Inc.
- Intersnack Group GmbH & Co. KG
- Zentis GmbH & Co. KG
- Besana S.p.A.
- Hormel Foods Corporation
- Diamond Foods LLC
Key Development
- In February 2026, Blue Diamond Growers launched a new Blue Diamond Almondmilk product line in four varieties, expanding its presence in almond-based beverages and strengthening its value-added nut product portfolio.
- In February 2026, Hormel Foods Corporation expanded its PLANTERS portfolio with the launch of Garlic Chili Crisp Flavored Cashews. The new product combines whole cashews with chili pepper and garlic seasoning and is offered in a 5-ounce resealable stand-up bag.
- In May 2026, Olam Food Ingredients, part of Olam Group, formed a joint venture with WNC Capital Holdings Inc. to establish ofi Philippines Blends. The partnership includes a new manufacturing facility in Bulacan, Philippines, scheduled for commissioning in the fourth quarter of 2026, strengthening ofi’s regional food and beverage ingredient capabilities.
Report Scope
| Report Features | Description |
|---|---|
| Market Value (2025) | USD 6.2 Bn |
| Forecast Revenue (2035) | USD 10.6 Bn |
| CAGR (2026-2035) | 5.5% |
| Base Year for Estimation | 2025 |
| Historic Period | 2020-2024 |
| Forecast Period | 2026-2035 |
| Report Coverage | Revenue Forecast, Market Dynamics, Competitive Landscape, Recent Developments |
| Segments Covered | By Product Type (Whole Nuts, Nut Butter, Nut Paste, Nut Flour / Meal, Nut Milk, and Nut Oil), By Production Method (Conventional and Organic), By End-User (Household / Retail, Food & Beverage Processing, and Foodservice / HoReCa), By Packaging (Pouches & Bags, Jars & Bottles, Cans & Tins, and Bulk), By Distribution Channel (Supermarkets & Hypermarkets, Convenience Stores, Specialty Stores, Online Retail / E-Commerce, and B2B / Direct Industrial Supply) |
| Regional Analysis | North America – The US & Canada; Europe – Germany, France, The UK, Spain, Italy, Russia & CIS, Rest of Europe; APAC– China, Japan, South Korea, India, ASEAN & Rest of APAC; Latin America– Brazil, Mexico & Rest of Latin America; Middle East & Africa– GCC, South Africa, & Rest of MEA |
| Competitive Landscape | Olam Group (ofi – Olam Food Ingredients), Barry Callebaut AG, Blue Diamond Growers, Wonderful Pistachios & Almonds (The Wonderful Company), Archer-Daniels-Midland Company (ADM), John B. Sanfilippo & Son, Inc. (Fisher Nuts), Mondelez International, Inc., Kerry Group plc, Select Harvests Limited, Mariani Nut Company, Inc., Intersnack Group GmbH & Co. KG, Zentis GmbH & Co. KG, Besana S.p.A., Hormel Foods Corporation (Planters), and Diamond Foods LLC. |
| Customization Scope | Customization for segments, region/country-level will be provided. Moreover, additional customization can be done based on the requirements. |
| Purchase Options | We have three licenses to opt for: Single User License, Multi-User License (Up to 5 Users), Corporate Use License (Unlimited Users and Printable PDF) |





































