


Report Overview
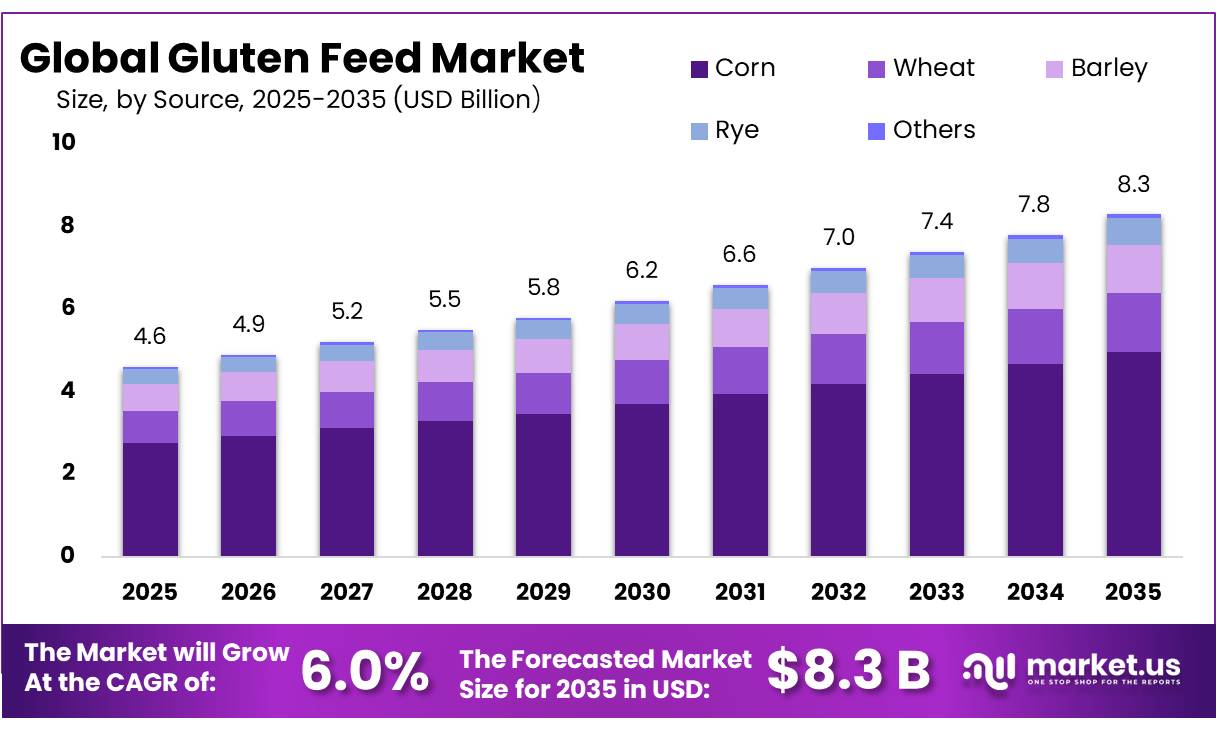
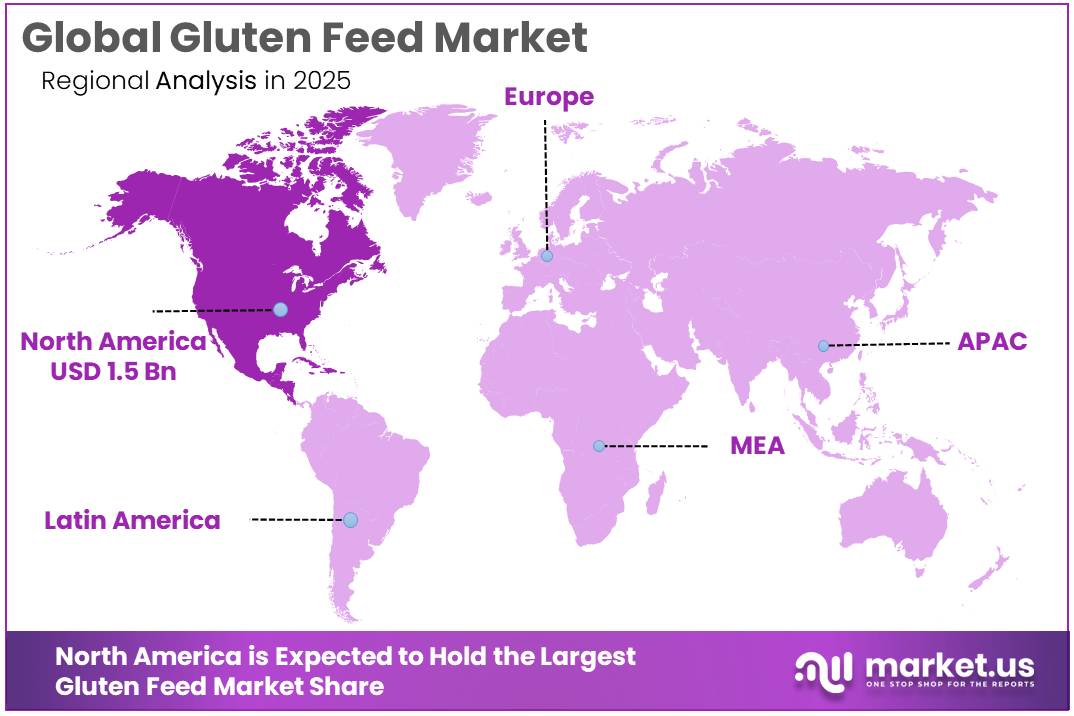
The Global Gluten Feed Market size is expected to be worth around USD 8.3 Billion by 2035, from USD 4.6 Billion in 2025, growing at a CAGR of 6.0% during the forecast period from 2026 to 2035. In 2025, North America held a dominant market position, capturing more than a 32.60% share, holding USD 1.5 Billion revenue.
Gluten feed, particularly corn gluten feed, is an important co-product of the grain-processing industry and is widely used in livestock rations as a source of protein, digestible fibre, and energy. It is generated mainly during corn wet milling, where starch, sweeteners, and other industrial ingredients are separated from the grain. USDA market reporting classifies corn gluten feed pellets at 21% protein, while wet corn gluten feed is commonly traded with 50–60% moisture.
- The Corn Refiners Association reported 25 U.S. corn-grinding plants operating across 10 states in 2025. The sector directly employed 9,735 people and supported 166,556 jobs across the broader economy. On the raw-material side, USDA estimated global corn production at 1.33 billion metric tons in 2025/26, including 432.34 million metric tons in the United States.
The European Commission states that approximately 5 million EU farmers raise food-producing animals valued at about EUR 130 billion and require roughly 450 million tons of feed each year. In the United States, USDA reported in April 2026 that Central U.S. corn gluten feed pellets averaged USD 155.71 per ton in one truck-traded assessment, compared with USD 122.83 per ton a year earlier. This price movement highlights the commercial value of gluten feed but also shows its exposure to grain, freight, and competing-feed costs.
- The European Commission reported that the EU produces about 67 million tonnes of plant-based protein while using around 80 million tonnes for feed, food, and industrial purposes. Livestock alone uses 74 million tonnes of protein annually, while only 25% of protein from oilseeds and protein crops was sourced within the EU in 2025.
Future growth is expected to be supported by livestock intensification, feed-cost optimization, and circular processing. The OECD-FAO Agricultural Outlook 2026–2035 projects global feed-protein consumption to increase by 13.5% over the coming decade. It also expects maize feed use to reach 747 million tonnes by 2035, an increase of 103 million tonnes from the base period.
Key Takeaways
- Gluten Feed Market size is expected to be worth around USD 8.3 Billion by 2035, from USD 4.6 Billion in 2025, growing at a CAGR of 6.0%.
- Corn held a dominant market position, capturing more than a 59.80% share of the Gluten Feed Market.
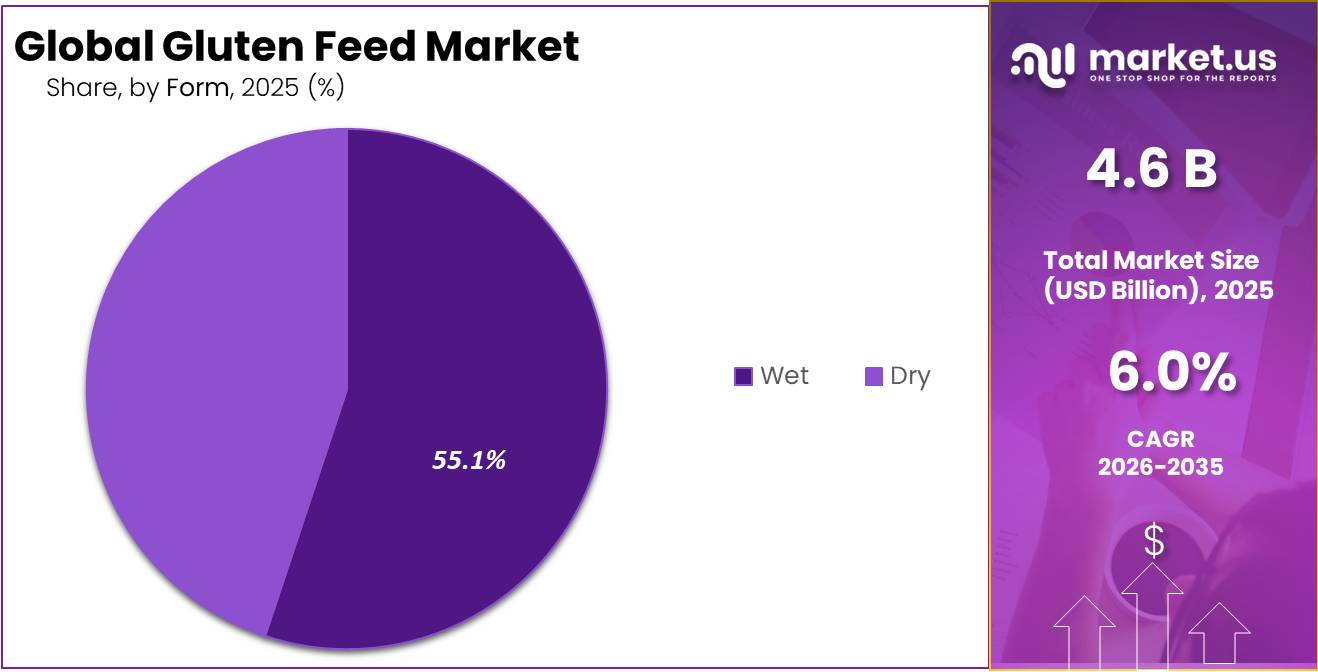
- Wet held a dominant market position, capturing more than a 55.10% share of the Gluten Feed Market.
- Cattle held a dominant market position, capturing more than a 52.80% share of the Gluten Feed Market.
- North America held a dominant market position in 2025, capturing more than a 32.60% share and reaching USD 1.51 billion.
By Source Analysis
Corn 59.80% Share, Supported by Large-Scale Corn Processing
In 2025, Corn held a dominant market position, capturing more than a 59.80% share of the Gluten Feed Market. Corn remained the leading source because large-scale wet-milling operations generate gluten feed as a useful co-product while producing starch, sweeteners, and other corn-based ingredients. The USDA estimated global corn production at 1.33 billion metric tons in 2025/26, including 432.34 million metric tons in the United States and 141 million metric tons in Brazil.
- In April 2026, USDA Agricultural Marketing Service reported corn gluten feed pellets containing 21% protein, while wet corn gluten feed was marketed with 50–60% moisture. Central U.S. corn gluten feed pellets averaged USD 155.71 per ton, showing that the material has an active commercial feed market. Its protein content, digestible fibre, widespread corn-processing infrastructure, and suitability for cattle diets continue to support corn’s strong position within the gluten feed industry.
Wheat represents an important alternative source in the Gluten Feed Market, particularly in regions with established wheat-starch, flour-processing, and industrial grain-processing industries. Wheat gluten feed is produced from processing streams that contain fibre, residual starch, and protein fractions, allowing processors to recover additional value from the grain.
By Form Analysis
Wet Gluten Feed Leads with 55.10% Share as Livestock Producers Favor Fresh, Moist Feed
In 2025, Wet held a dominant market position, capturing more than a 55.10% share of the Gluten Feed Market. Wet gluten feed is widely used in cattle diets because it retains moisture, provides digestible fibre and protein, and avoids the additional drying step required for shelf-stable feed. Its use is particularly practical for livestock farms located close to corn wet-milling plants, where regular deliveries can reduce storage and processing requirements.
- Government production data shows the scale of this feed stream. In January 2026, the U.S. Department of Agriculture reported 193,748 tons of wet corn gluten feed production containing 40–60% moisture. Production increased 3% from the previous month. USDA Agricultural Marketing Service data from April 2026 also classified traded wet corn gluten feed at 50–60% moisture, with Central U.S. prices ranging from USD 20 to USD 38 per ton and averaging USD 31.60 per ton.
Dry gluten feed remains an important form within the Gluten Feed Market, particularly for compound-feed manufacturers, distributors, and livestock producers located farther from wet-milling facilities. Removing moisture improves storage stability and makes the product easier to transport over longer distances. Dry material is also commonly supplied in pellet form, which supports more convenient handling, controlled feed formulation, and bulk transportation through established feed-distribution networks.
By Livestock Analysis
Cattle Leads with 52.80% Share as Gluten Feed Fits High-Volume Ruminant Feeding
In 2025, “Cattle” held a dominant market position, capturing more than a 52.80% share of the Gluten Feed Market. Cattle remains the main livestock group for gluten feed because the ingredient supplies digestible fibre, protein, and energy that can be incorporated into beef and dairy rations. Corn gluten feed is particularly suitable for ruminants, where its fibrous composition can complement forage and grain-based feeding programs. USDA reported 86.2 million head of cattle and calves on U.S. farms as of January 2026, including 27.6 million beef cows and 9.57 million milk cows.
- USDA recorded 13.8 million head of cattle on feed in the United States at the beginning of 2026, while the 2025 calf crop reached 32.9 million head. USDA Economic Research Service also states that corn is the country’s largest feed grain and accounts for more than 95% of U.S. feed-grain production and use.
Poultry represents an important livestock segment in the Gluten Feed Market as commercial broiler, layer, and turkey producers require large quantities of formulated feed throughout their production cycles. Gluten feed can be incorporated selectively into poultry diets where feed formulators balance its fibre, protein, energy, and amino-acid contribution with other ingredients.
Key Market Segments
By Source
- Corn
- Wheat
- Barley
- Rye
- Others
By Form
- Dry
- Wet
By Livestock
- Cattle
- Poultry
- Swine
- Aquaculture
- Equine
- Pet Animals
- Others
Driver Analysis
Dairy and Cattle-Feed Expansion
This is the largest estimated driver because gluten feed monetizes most effectively in ruminant rations, where its combination of digestible fibre, energy and moderate protein can displace portions of grain and protein meal without requiring a premium-food positioning. Global milk output is projected to rise from roughly 950 million tonnes in 2024 to 1,146 million tonnes by 2034, a 1.8% annual increase, with more than half of incremental production originating in India and Pakistan; India alone produced about 247.87 million tonnes in 2024/25, up 3.58% year over year.
The near-term U.S. base is also supportive: the January 1, 2026 dairy herd was 9.568 million head, 188,000 above the prior year, while 2026 milk production was forecast to grow 1.3%; a later USDA update put June 1 feedlot inventory at 11.682 million head, 2.1% above June 2025. Commercially, this expands recurring tonnes rather than merely raising selling prices: wet product can be contracted to dairies near starch plants, while dry pellets can serve distant beef and dairy systems.
The assigned +1.6 percentage-point CAGR contribution assumes only partial conversion of rising milk and cattle output into purchased gluten-feed demand, with the strongest value capture in South Asia’s formalizing dairy chain and Africa’s herd expansion; it is deliberately below the underlying livestock-output opportunity because the EU dairy sector is expected to contract slightly and forage, DDGS, bran and oilseed meals remain strong substitutes.
Drivers Impact Analysis
| Driver | (~) % Impact on CAGR Forecast | Geographic Relevance | Impact Timeline |
|---|---|---|---|
| Dairy and cattle-feed expansion | +1.6% | South Asia, Africa, North America | Medium term (2–4 years) |
| Starch-milling co-product scale | +1.2% | EU, U.S., China | Medium term (2–4 years) |
| Corn–soy ration economics | +1.0% | North America core, LATAM, EU | Short term (≤ 2 years) |
| EU circular-feed transition | +0.8% | EU core, nearby trade corridors | Medium term (2–4 years) |
| Low-soy feed reformulation | +0.6% | China, East Asia, Southeast Asia | Long term (≥ 4 years) |
| Drying, pelleting and logistics | +0.4% | Export corridors, tropical markets | Medium term (2–4 years) |
Restraint Analysis
Low-Cost Feed Substitutes
Gluten feed competes in a least-cost ration pool rather than a protected ingredient category, so abundant corn, soybean meal, DDGS, wheat bran and local milling residues can erase its theoretical protein-and-fibre advantage within a single procurement cycle. USDA’s 2026/27 outlook placed U.S. corn at about $4.20/bushel and soybean meal near $300/short ton, with oilseed-meal supply described as ample; Purdue’s futures-based work similarly showed expected corn at $4.25–$4.50/bushel, soybean meal at $275–$325/ton, and a 2026 swine-feed cost index around 98.8, or 1.2% below 2025.
At the same time, U.S. DDGS output reached 1.82 million tons in June 2026 and 1.85 million tons in July, versus only 257,464 tons of dry corn gluten feed in June and 250,692 tons in July, giving ethanol co-products materially greater scale, distributor familiarity and contracting liquidity. Since gluten feed’s commercial value moves with the combined replacement value of grain and protein meal, cheaper conventional inputs narrow the discount a buyer requires to tolerate compositional variability, extra bins and handling; processors must then cut netbacks or absorb freight, compressing contribution margins and discouraging capacity dedicated to drying or pelleting.
The modeled -1.4 percentage-point CAGR effect is therefore the largest restraint in 2026–2028, with the greatest downside in the U.S., Brazil and EU feed belts where formulation software can rapidly rebalance recipes and multiple substitute streams are available.
Restraint Impact Analysis
| Restraint | (~) % Impact on CAGR Forecast | Geographic Relevance | Impact Timeline |
|---|---|---|---|
| Low-cost feed substitutes | -1.4% | North America, LATAM, EU | Short term (≤ 2 years) |
| Limited monogastric use | -1.1% | APAC, EU, North America | Long term (≥ 4 years) |
| Wet-product logistics | -1.0% | Global; inland corridors | Medium term (2–4 years) |
| Milling-linked supply swings | -0.8% | U.S., EU, China | Short term (≤ 2 years) |
| Quality and toxin risk | -0.8% | Global; warm-humid regions | Medium term (2–4 years) |
| Weak cattle-feed growth | -0.6% | EU core, North Asia | Medium term (2–4 years) |
Opportunity Analysis
Guaranteed-Spec Feed Contracts
The white space is not greater output of conventional gluten feed—already embedded in the baseline—but conversion of a variable commodity into a guaranteed-nutrient service sold through multi-year contracts: processors can install inline near-infrared spectroscopy, publish batch-level protein, moisture, fat, fibre and starch values, and connect those results to customers’ least-cost formulation engines, thereby pricing on digestible nutrient delivery rather than tonnage.
NIR can measure several feed parameters within seconds or minutes without sample preparation, versus the multiple laboratory methods normally required, and continuous monitoring enables formulation adjustments before off-spec material reaches the customer. The commercial gap is credible because a historical assessment of 14 separate 6-tonne wet-CGF loads found variable protein and mineral levels, while modern process NIR can monitor moisture, protein, starch and oil directly in production.
An execution case covering just 25% of the 5.31 million short tons of U.S. dry-plus-wet gluten feed produced in 2025 would place about 1.33 million tons under specification-backed contracts; at an analyst-assumed 3–5% quality/service premium, plus fewer claims and formulation safety margins, the model supports +1.0 percentage point of CAGR upside.
Opportunity Impact Analysis
| Opportunity | (~) % Potential CAGR Upside | Geographic Relevance | Execution Window |
|---|---|---|---|
| Guaranteed-spec feed contracts | +1.0% | North America, EU, China | Short term (≤ 2 years) |
| Fermented monogastric grades | +0.9% | China, Southeast Asia, EU | Medium term (2–4 years) |
| Preserved wet-feed hubs | +0.8% | India, North America, LATAM | Short term (≤ 2 years) |
| India dairy–starch clusters | +0.7% | India core, South Asia | Medium term (2–4 years) |
| Carbon-certified co-products | +0.5% | EU core, North America | Medium term (2–4 years) |
| Premium pet-fibre formats | +0.3% | North America, EU, East Asia | Long term (≥ 4 years) |
Challenges Analysis
Nutrient-Spec Variability
Gluten feed remains commercially saleable, but processors must continuously manage variability caused by corn origin, storage age, fibre-to-steep-liquor ratio, germ residues, drying intensity and moisture: reference data for dried corn gluten feed show crude protein averaging 21.6% of dry matter but ranging from 16.1% to 28.2% across 539 observations, dry matter ranging from 79.5% to 96.3% across 551 samples, calcium from 0.2 to 5.8 g/kg DM across 854 observations, and phosphorus from 5.1 to 16.4 g/kg DM across 944 observations.
That dispersion does not stop transactions, but it forces feed mills to discount book values, widen formulation safety margins and re-test incoming lots; even a 2-percentage-point protein miss on a nominal 21% specification represents nearly 9.5% less protein per tonne, while a lot at 82% instead of 90% dry matter delivers about 8.9% less dry nutrient mass per invoiced tonne.
The corporate requirement is an integrated quality architecture—inline NIR at dryers and load-out, wet-chemistry verification for minerals, statistical process control by raw-corn lot, dynamic steep-liquor dosing, moisture-adjusted billing and digital certificates of analysis—because NIR can quantify moisture, protein, fat, fibre, ash and starch within seconds without sample preparation. The modeled -0.9-point CAGR friction reflects slower customer qualification, inventory segregation, claims and conservative inclusion rates rather than a hard demand barrier; normalization requires two to four years of calibration libraries, harmonized specifications and closed-loop process control across plants.
Challenges Impact Analysis
| Challenge | (~) % CAGR Friction | Geographic Relevance | Mitigation Horizon |
|---|---|---|---|
| Nutrient-spec variability | -0.9% | Global processing hubs | Medium term (2–4 years) |
| Climate-toxin volatility | -0.8% | EU south, U.S., LATAM | Long term (≥ 4 years) |
| Energy-carbon trade-off | -0.8% | EU core, export plants | Long term (≥ 4 years) |
| Traceability data burden | -0.6% | EU regulatory hubs | Medium term (2–4 years) |
| Freight-workforce imbalance | -0.5% | North America, EU corridors | Medium term (2–4 years) |
| Co-product flow mismatch | -0.5% | U.S., EU, China | Medium term (2–4 years) |
Geopolitical Impact Analysis
War-Driven Black Sea Disruptions Raise Gluten Feed Supply and Cost Risks
The continuing Russia–Ukraine war is influencing the Gluten Feed Market through grain availability, freight costs, energy expenses, and uncertainty around Black Sea exports. Corn and wheat are key raw materials for gluten feed, so disruption to regional grain movements can quickly affect processors, feed manufacturers, and livestock producers. USDA reported in January 2026 that Ukraine’s projected 2025/26 coarse-grain exports were expected to rise 18% from the previous trade year, although logistics remained constrained by the military conflict with Russia. This shows that supply may recover while transport risk remains high.
FAO reported in September 2026 that uncertainty around Black Sea export flows continued as shipping conditions, logistics risks, and limited alternative-route capacity affected grain movement. FAO also reduced its forecast for global coarse-grain ending stocks by 13.5 million tonnes, or 3.4%. In August 2026, U.S. Gulf maize export prices were 20.7% higher than a year earlier. For gluten feed producers, these conditions can raise corn procurement, drying, energy, insurance, and transport costs. At the same time, buyers may diversify sourcing toward stable grain-processing regions, creating opportunities for local gluten feed suppliers with reliable raw-material access and shorter distribution routes.
Regional Insights
North America Leads the Gluten Feed Market, While Asia Pacific Shows Strong Growth Potential
North America held a dominant market position in 2025, capturing more than a 32.60% share and reaching USD 1.51 billion. The United States remained the core contributor because of its large corn crop, wet-milling capacity, and cattle industry. USDA data shows U.S. corn production at 425.3 million tonnes for 2025/26. As of July 2026, the country had 94.2 million cattle and calves, including 13.2 million cattle on feed. Canada also strengthened the regional livestock base, with cattle inventories reaching 12.1 million head in July 2026. These conditions support consistent demand for fibre- and protein-rich gluten feed.
North America remained the leading regional market for gluten feed in 2025, supported by a mature corn-processing industry, large livestock populations, and established feed distribution networks. The region benefits from strong wet-milling activity in the United States and steady corn availability in Canada, giving feed manufacturers reliable access to gluten feed for cattle and other livestock. In 2026, USDA reported that corn accounted for more than 95% of U.S. feed-grain production and use, while feed demand represented about 40% of domestic corn use. Canada produced 14.9 million tonnes of corn for grain in 2025, supporting additional regional feed supply.
Asia Pacific is positioned as the fastest-growing regional segment as expanding livestock production and feed demand increase the need for cost-efficient cereal co-products. China remains a major influence on regional feed consumption. In July 2026, USDA projected China’s 2026/27 corn production at 306 million tonnes, while corn imports were forecast at 6 million tonnes. FAO also reported that global coarse-grain use is expected to keep expanding in 2026/27, supported by strong feed demand and sustained barley use in China.
Key Regions and Countries Insights
- North America
- US
- Canada
- Europe
- Germany
- France
- The UK
- Spain
- Italy
- Rest of Europe
- Asia Pacific
- China
- Japan
- South Korea
- India
- Australia
- Rest of APAC
- Latin America
- Brazil
- Mexico
- Rest of Latin America
- Middle East & Africa
- GCC
- South Africa
- Rest of MEA
Key Players Analysis
Archer Daniels Midland Company (ADM) holds a strong position in gluten feed through its large corn-processing and animal-nutrition operations. In 2025, ADM generated USD 80.27 billion in revenue and processed 18.53 million metric tons of corn. Its Carbohydrate Solutions business produced USD 10.74 billion in revenue. ADM also produces about 3 million metric tons of feed annually through more than 50 plants worldwide. Its wet-milling network supplies corn gluten feed, corn gluten meal, germ meal, and related feed ingredients.
Cargill, Incorporated remains an important participant in gluten feed through its grain processing, starch-derived ingredients, and animal-nutrition businesses. In fiscal 2025, Cargill recorded USD 154 billion in revenue and employed more than 155,000 people. The company operated in 70 countries and delivered products to 125 markets. Its feed portfolio includes corn gluten feed, corn gluten meal, wheat feed, and moist feed products. This broad sourcing and distribution network supports reliable supply to livestock producers and compound-feed manufacturers across major regions.
Bunge Global SA strengthens its position in gluten feed through integrated grain origination, corn milling, merchandising, and animal-feed ingredients. In 2025, Bunge recorded USD 70.33 billion in net sales, while its Grain Merchandising and Milling segment generated USD 18.13 billion. Segment volumes reached 67.17 million metric tons. Bunge also completed its Viterra acquisition in July 2025, expanding its global grain network. Its corn gluten feed typically contains 19% protein and can be supplied as meal or pellets for ruminant diets.
Top Key Players Outlook
- Archer Daniels Midland Company (ADM)
- Cargill, Incorporated
- Bunge Global SA
- Ingredion Incorporated
- Roquette Frères
- Tereos Group
- AGRANA Beteiligungs-AG
- Tate & Lyle PLC
- Grain Processing Corporation
- Global Bio-Chem Technology Group Company Limited
- COFCO Corporation
- Zhucheng Xingmao Corn Developing Co., Ltd.
- Green Plains Inc.
- Gulshan Polyols Limited
- The Scoular Company
Recent Developments
- In June 2026, Ingredion announced a recommended all-cash acquisition of Tate & Lyle valued at approximately GBP 3.7 billion, equivalent to about USD 5.0 billion, significantly expanding its global ingredient platform. Product development also continued in July 2026, when the company presented new clean-label, protein, fibre and sugar-reduction solutions at IFT FIRST.
- In July 2026, Roquette signed a 3-year partnership with Vivescia and Siplec E.Leclerc to create a low-carbon French ethanol value chain using wheat from a program covering 650 farmers and more than 600,000 tonnes of grain.
Report Scope
| Report Features | Description |
|---|---|
| Market Value (2025) | USD 4.6 Bn |
| Forecast Revenue (2035) | USD 8.3 Bn |
| CAGR (2026-2035) | 6.0% |
| Base Year for Estimation | 2025 |
| Historic Period | 2020-2024 |
| Forecast Period | 2026-2035 |
| Report Coverage | Revenue Forecast, Market Dynamics, Competitive Landscape, Recent Developments |
| Segments Covered | By Source (Corn, Wheat, Barley, Rye, Others), By Form (Dry, Wet), By Livestock (Cattle, Poultry, Swine, Aquaculture, Equine, Pet Animals, Others) |
| Regional Analysis | North America – US, Canada; Europe – Germany, France, The UK, Spain, Italy, Rest of Europe; Asia Pacific – China, Japan, South Korea, India, Australia, Singapore, Rest of APAC; Latin America – Brazil, Mexico, Rest of Latin America; Middle East & Africa – GCC, South Africa, Rest of MEA |
| Competitive Landscape | Archer Daniels Midland Company (ADM), Cargill, Incorporated, Bunge Global SA, Ingredion Incorporated, Roquette Frères, Tereos Group, AGRANA Beteiligungs-AG, Tate & Lyle PLC, Grain Processing Corporation, Global Bio-Chem Technology Group Company Limited, COFCO Corporation, Zhucheng Xingmao Corn Developing Co., Ltd., Green Plains Inc., Gulshan Polyols Limited, The Scoular Company |
| Customization Scope | Customization for segments, region/country-level will be provided. Moreover, additional customization can be done based on the requirements. |
| Purchase Options | We have three licenses to opt for: Single User License, Multi-User License (Up to 5 Users), Corporate Use License (Unlimited User and Printable PDF) |





































