One Stop Shop For Reports One Stop Shop For Reports
  • All Reports
  • All Sectors
    • Chemicals & Materials
      • Advanced Materials
      • Bulk Chemicals
      • Coatings | Paints and Additives
      • Composites
      • Renewable | Speciality chemicals
    • Consumer Goods
      • Baby Products
      • Consumer Electronics
      • Consumer Packaging
      • Cosmetics & Personal Care
      • Homecare & Decor
      • Luxury & premium products
    • Energy and Power
      • Energy Efficiency and Conservation
      • Green | Renewable Energy
      • Non Renewable | Conventional Energy
      • Power Equipment and Devices
    • Life Science
      • Biotechnology
      • Diagnostics
      • Healthcare
      • Healthcare IT
      • Medical Devices & Supplies
      • Pharmaceuticals
    • Food and Beverage
      • Agriculture & Agri Products
      • Beverages
      • Food Ingredients
      • Food Services and Hospitality
      • Nutraceutical | Wellness Food
      • Processed & Frozen Foods
    • Automotive and Transportation
      • Automotive components
      • Automotive Logistics
      • Automotive systems and accessories
    • Information and Communications Technology
      • E Commerce and Outsourcing
      • Entertainment & Media
      • High Tech | Enterprise & Consumer IT
      • Information & Network Security
      • Mobility | Telecom & Wireless
      • Software and Services
    • Semiconductor and Electronics
      • Semiconductor Materials and Components
      • Display Technology
      • Electronics System and Components
      • Emerging technologies
      • Security and Surveillance
      • Sensors and Controls
    • Building and Construction
      • Construction Materials
      • HVAC
      • Residential Construction and Improvement
      • Roads & Highways
    • Manufacturing
      • Manufacturing Services
      • Heavy Manufacturing
      • Packaging
      • Engineering | Equipment and Machinery
  • Who Trust Us
  • [email protected]
  • +1 718 874 1545 (International)
  • +91 78878 22626 (Asia)

More Results

One Stop Shop For Reports One Stop Shop For Reports
  • All Reports
  • All Sectors
    • Chemicals & Materials
      • Advanced Materials
      • Bulk Chemicals
      • Coatings | Paints and Additives
      • Composites
      • Renewable | Speciality chemicals
    • Consumer Goods
      • Baby Products
      • Consumer Electronics
      • Consumer Packaging
      • Cosmetics & Personal Care
      • Homecare & Decor
      • Luxury & premium products
    • Energy and Power
      • Energy Efficiency and Conservation
      • Green | Renewable Energy
      • Non Renewable | Conventional Energy
      • Power Equipment and Devices
    • Life Science
      • Biotechnology
      • Diagnostics
      • Healthcare
      • Healthcare IT
      • Medical Devices & Supplies
      • Pharmaceuticals
    • Food and Beverage
      • Agriculture & Agri Products
      • Beverages
      • Food Ingredients
      • Food Services and Hospitality
      • Nutraceutical | Wellness Food
      • Processed & Frozen Foods
    • Automotive and Transportation
      • Automotive components
      • Automotive Logistics
      • Automotive systems and accessories
    • Information and Communications Technology
      • E Commerce and Outsourcing
      • Entertainment & Media
      • High Tech | Enterprise & Consumer IT
      • Information & Network Security
      • Mobility | Telecom & Wireless
      • Software and Services
    • Semiconductor and Electronics
      • Semiconductor Materials and Components
      • Display Technology
      • Electronics System and Components
      • Emerging technologies
      • Security and Surveillance
      • Sensors and Controls
    • Building and Construction
      • Construction Materials
      • HVAC
      • Residential Construction and Improvement
      • Roads & Highways
    • Manufacturing
      • Manufacturing Services
      • Heavy Manufacturing
      • Packaging
      • Engineering | Equipment and Machinery
  • Who Trust Us
Home ➤ Chemicals & Materials ➤ Elevators and Escalators Market
Elevators and Escalators Market
Published date: Sep 2026 • Formats:
[email protected] +1 718 874 1545
Request Sample Schedule a Call
Table of Contents
  • Report Overview
  • Key Takeaways
  • By Product Type
  • By Elevator Type
  • By Service Type
  • By Elevator Technology
  • By End Use
  • Key Market Segments
  • Driver Analysis
  • Restraint Analysis
  • Opportunity Analysis
  • Challenges Analysis
  • Geopolitical Impact Analysis
  • Regional Analysis
  • Key Players Analysis
  • Key Development
  • Report Scope
  • Home ➤ Chemicals & Materials ➤ Elevators and Escalators Market

Elevators and Escalators Market Size, Share And Report Analysis By Product Type (Elevators, Escalators, Moving Walkways), By Elevator Type (Passenger Elevators, Freight Elevators, Hospital Elevators, Home Elevators), By Service Type (New Installation, Maintenance and Repair, Modernization), By Elevator Technology (Traction, Machine Room-Less, Hydraulic), By End Use (Residential, Commercial, Industrial, Infrastructure), By Region and Companies   Industry Segment Outlook, Market Assessment, Competition Scenario, Trends and Forecast 2026 2035

  • Published date: Sep 2026
  • Report ID: 193403
  • Number of Pages: 371
  • Format:
Fact Checked
Elevators and Escalators Market https://market.us/report/global-elevators-and-escalators-market/
Cite this Research
  • Overview
  • Table of Contents
  • Segmentation
  • currency-icon
    Revenue, 2025 (US$B)
    118 Bn
    growth-icon
    Forecast, 2035 (US$B)
    216.2 Bn
    chart-icon
    CAGR, 2025 - 2035
    6.3%
    globe-icon
    Leading Region
    Asia Pacific

    Quick Navigation

    • Report Overview
    • Key Takeaways
    • By Product Type
    • By Elevator Type
    • By Service Type
    • By Elevator Technology
    • By End Use
    • Key Market Segments
    • Driver Analysis
    • Restraint Analysis
    • Opportunity Analysis
    • Challenges Analysis
    • Geopolitical Impact Analysis
    • Regional Analysis
    • Key Players Analysis
    • Key Development
    • Report Scope

    Report Overview

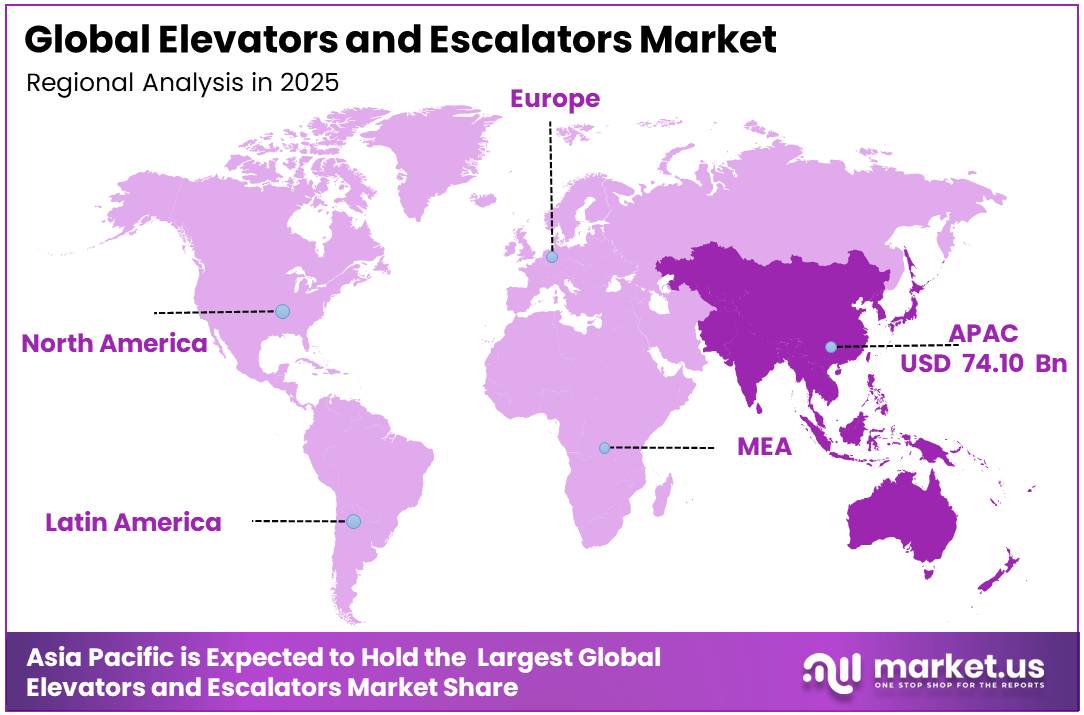
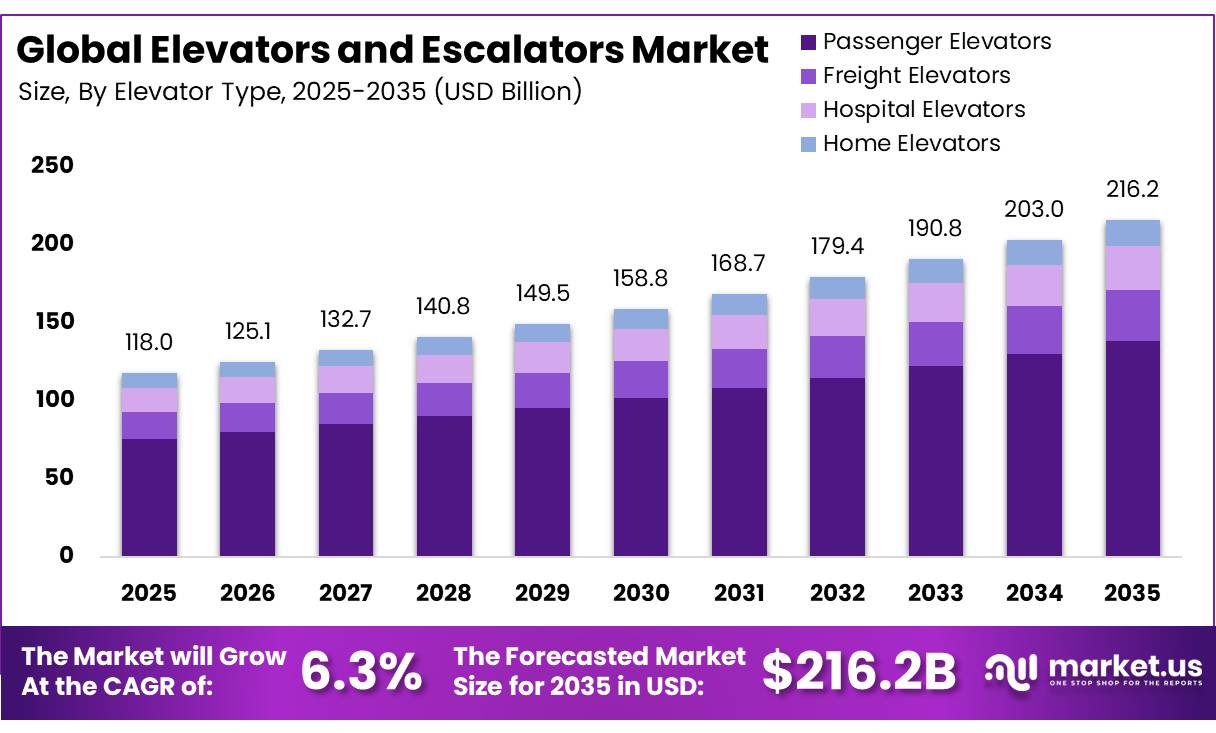
    In 2025, the Elevators and Escalators Market was valued at USD 118 Billion, and between 2026 and 2035, this market is estimated to register a CAGR of 6.3%, reaching about USD 216.2 Billion by 2035. Asia Pacific held a dominant market position, capturing more than a 62.80% share, holding USD 74.10 Billion in revenue.

    The global elevators and escalators market comprises vertical and inclined transportation systems installed across residential, commercial, and industrial buildings to move people and goods between floors.

    • According to the National Elevator Industry, Inc. (NEII), the trade association representing the building transportation industry in North America, over 1 million elevators currently operate across the United States and Canada, underscoring the scale of installed infrastructure that manufacturers and service providers support continent wide.
    Elevators and Escalators Market

    The industrial scenario is supported by a specialized service workforce. The U.S. Bureau of Labor Statistics (BLS) reports 24,200 elevator and escalator installers and repairers were employed nationally in 2024, earning a median annual wage of 106,580 US dollars. NEII further states that its member companies directly employ more than 25,000 people in the United States and collectively represent 85% of total hours worked within the industry, reflecting a concentrated manufacturing and servicing base.

    Growth opportunities are driven by urbanization, high rise construction, and modernization of aging installed units. NEII projects that by 2050, the number of daily elevator and escalator riders is expected to triple compared to current levels, signaling long term demand for new installations and upgrades. Supporting this outlook, the BLS projects 5% employment growth for installers and repairers between 2024 and 2034, adding approximately 1,200 net new jobs, faster than the average for all occupations.

    Government initiatives continue to shape market requirements, particularly accessibility. The U.S. Access Board, the federal agency responsible for accessibility guidelines, mandates under Section 206.2.3 of the Americans with Disabilities Act (ADA) Standards that at least one accessible route, typically an elevator, connect each story of multi-story buildings. Elevators used to meet this requirement must comply with the American Society of Mechanical Engineers (ASME) A17.1 safety code, reinforcing safety driven regulatory demand for compliant equipment in new construction.

    Key Takeaways

    • The Global Elevators and Escalators Market was valued at USD 118.0 billion in 2025.
    • The global market is projected to grow at a CAGR of 3% and is estimated to reach USD 216.2 billion by 2035.
    • On the basis of product type, Elevators dominated the market, constituting 0% of the total market share.
    • Based on the elevator type, Passenger Elevators dominated the market, accounting for 1% of the total market share.
    • Based on the service type, New Installation dominated the market, accounting for 0% of the total market share.
    • Based on the elevator technology, Traction dominated the market, accounting for 0% of the total market share.
    • Based on the end use, Residential dominated the market, accounting for 3% of the total market share.
    • In 2025, Asia Pacific was the most dominant region in the elevators and escalators market, accounting for 8% of the global market.

    By Product Type

    Elevators dominate with 75.00% share due to their essential role across residential, commercial, and high-rise infrastructure projects.

    In 2025, Elevators held a dominant market position, capturing more than a 75.00% share of the Elevators and Escalators Market. Their leading position was supported by strong demand from residential buildings, commercial complexes, hospitals, offices, and mixed-use developments where safe and efficient vertical transportation is essential. The continued construction of high-rise buildings and urban infrastructure projects increased the need for passenger and service elevators across both developed and developing economies.

    Escalators represented the growing segment of the market. Demand continued to increase as airports, metro stations, shopping malls, railway terminals, and other public facilities expanded and upgraded pedestrian movement systems. Growing investments in transportation infrastructure and commercial developments during 2025 encouraged wider installation of escalators to improve passenger flow and accessibility.

    By Elevator Type

    Passenger Elevators dominate with 64.1% share due to their widespread use in residential and commercial buildings.

    In 2025, Passenger Elevators held a dominant market position, capturing more than a 64.1% share of the Elevators and Escalators Market by elevator type. Their leadership was driven by extensive installation across residential apartments, office buildings, hotels, hospitals, educational institutions, and mixed-use developments where safe and efficient movement of people is a basic requirement. The continued construction of high-rise buildings and the modernization of existing structures during 2025 further supported demand for passenger elevators.

    Freight Elevators emerged as the growing segment of the market. Growth was supported by increasing demand from warehouses, manufacturing facilities, distribution centers, logistics hubs, and industrial buildings where heavy materials and equipment need to be transported safely between floors. The expansion of industrial infrastructure and storage facilities, along with rising investments in automated material handling during 2025, encouraged greater adoption of freight elevators. Their ability to handle large loads while improving operational efficiency continued to support steady growth across industrial and commercial applications.

    By Service Type

    New Installation dominates with 45.00% share as expanding building construction continues to drive elevator demand.

    In 2025, New Installation held a dominant market position, capturing more than a 45.00% share of the Elevators and Escalators Market by service type. Its leading position was supported by continued construction of residential towers, commercial buildings, hospitals, transportation hubs, and other infrastructure projects that required new vertical transportation systems.

    Maintenance and Repair represented the growing segment of the market. Growth was supported by the expanding installed base of elevators and escalators that require regular inspections, preventive servicing, component replacement, and safety testing throughout their operating life. Building owners and facility managers increasingly prioritized equipment reliability, regulatory compliance, and reduced downtime, leading to higher demand for maintenance contracts and repair services.

    By Elevator Technology

    Traction technology dominates with 70.00% share due to its strong performance in mid- and high-rise buildings.

    In 2025, Traction held a dominant market position, capturing more than a 70.00% share of the Elevators and Escalators Market by elevator technology. Its leading position was supported by its extensive use in residential towers, commercial offices, hotels, hospitals, and other multi-story buildings where reliable vertical transportation is essential. Traction elevators are widely preferred because they provide smooth operation, higher travel speeds, and better energy efficiency for buildings with greater travel heights.

    Machine Room-Less technology emerged as the growing segment of the market. Growth was supported by increasing demand for space-efficient building designs that reduce construction complexity while maintaining high operational performance. Building owners and developers increasingly adopted machine room-less systems because they optimize available building space and support modern energy-saving requirements.

    By End Use

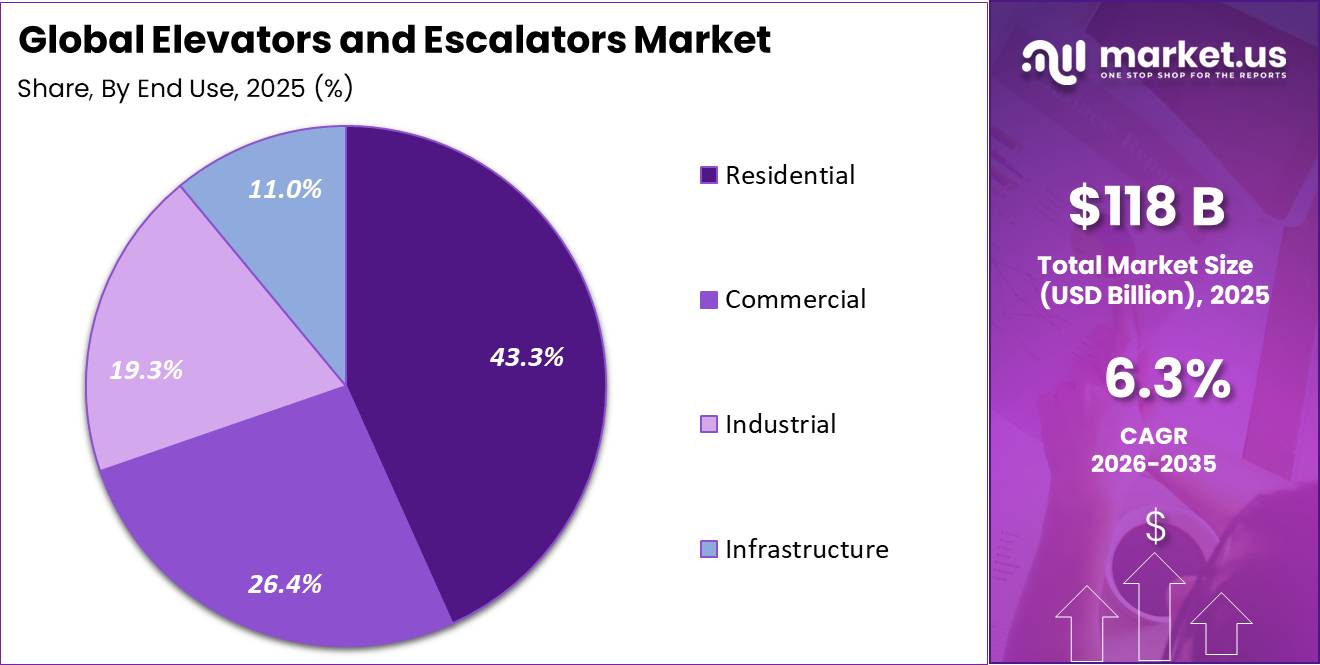
    Residential dominates with 43.3% share as rising multi-story housing projects continue to support elevator installations.

    In 2025, Residential held a dominant market position, capturing more than a 43.3% share of the Elevators and Escalators Market by end use. Its leading position was driven by the continued construction of apartment buildings, high-rise residential towers, and mixed-use housing developments that require reliable vertical transportation systems. Growing urban populations and increasing demand for modern housing encouraged the installation of elevators designed to improve accessibility, convenience, and safety for residents. During 2025, developers also focused on integrating energy-efficient and smart elevator technologies into new residential projects to meet evolving building standards.

    Commercial represented the growing segment of the market. Growth was supported by rising investments in office buildings, shopping centers, hotels, hospitals, airports, and other commercial facilities that depend on efficient movement of people. The expansion of modern business infrastructure and increasing renovation of existing commercial properties encouraged the installation and upgrading of advanced elevator and escalator systems. The growing emphasis on passenger comfort, accessibility, and smart building integration during 2025 continued to strengthen demand for commercial vertical transportation solutions.
    Elevators and Escalators Market Share

    Key Market Segments

    By Product Type

    • Elevators
    • Escalators
    • Moving Walkways

    By Elevator Type

    • Passenger Elevators
    • Freight Elevators
    • Hospital Elevators
    • Home Elevators

    By Service Type

    • New Installation
    • Maintenance and Repair
    • Modernization

    By Elevator Technology

    • Traction
    • Machine Room-Less
    • Hydraulic

    By End Use

    • Residential
    • Commercial
    • Industrial
    • Infrastructure

    Driver Analysis

    Urban High-Rise Densification

    India is likewise expanding vertical construction beyond its largest metros: PMAY-Urban and PMAY-Urban 2.0 had sanctioned 122.50 lakh houses, and 7,555 of 8,067 Smart Cities Mission projects worth ₹1,51,361 crore had been completed as of May 2025, supporting a large installed base across urban housing, civic buildings, and commercial clusters.

    The unit-economics impact is material because a low-rise four-to-six-storey building may require one 6–8 passenger lift, whereas a 20–40-storey residential or commercial tower can require three to eight elevators, destination-control systems, fire lifts, service lifts, and sometimes escalators or moving walks in podium retail zones; elevator content can therefore rise from roughly 0.2–0.5 units per 1,000 square metres in low-rise stock to 1.0–2.5 units per 1,000 square metres in high-density developments.

    OEMs benefit not only from equipment revenue but from 20–30 year maintenance relationships, spare parts, modernization potential after 15–25 years, and digital-service upgrades that convert a one-time installation into recurring revenue. This densification-led equipment and service multiplier is estimated to add approximately +1.8 percentage points to the market’s baseline CAGR through 2028–2030, particularly in China, India, ASEAN, the GCC, and selected African urban corridors.

    Drivers Impact Analysis

    Driver (~) % Impact on CAGR Geographic Relevance Impact Timeline
    Urban High-Rise Densification +1.8 pp China, India, ASEAN, GCC, Africa Medium term (2–4 years)
    Transit and Airport Expansion +1.5 pp India, China, ASEAN, GCC, North America Medium term (2–4 years)
    Aging Fleet Modernization +1.6 pp Europe, North America, Japan, Korea Long term (≥ 4 years)
    Safety and Accessibility Upgrades +1.2 pp EU, North America, India, Japan Medium term (2–4 years)
    Smart Predictive Service Models +1.1 pp North America, EU, China, Korea Short term (≤ 2 years)
    Energy-Efficient Lift Adoption +0.9 pp EU, North America, Japan, urban APAC Medium term (2–4 years)

    Restraint Analysis

    High Construction Financing Costs

    Construction industry analysis in 2026 continues to identify borrowing costs as a direct drag on both residential and commercial project viability, noting that higher rates reduce access to affordable credit, delay buyer and tenant commitments, lengthen sales cycles, and weaken the financial case for new starts.

    For a mid-rise residential project requiring four to eight elevators, a 200–300 basis-point increase in project financing cost can raise annual interest expense by several hundred thousand dollars on a USD 20–50 million development, making a USD 250,000–800,000 vertical-transport package an immediate value-engineering target; developers may reduce the number of cars, defer a second tower, select lower-speed systems, eliminate panoramic or destination-control features, or shift from escalators to stairs in low-footfall areas.

    OEMs experience lower order conversion, higher bid-to-order ratios, longer tender validity periods, and greater working-capital risk because a 6–12 month equipment quotation can be renegotiated after project financing changes; this restraint is estimated to reduce the 2026 baseline CAGR by approximately -1.8 percentage points over the short term.

    Restraint Impact Analysis

    Restraint (~) % Impact on CAGR Forecast Geographic Relevance Impact Timeline
    High Construction Financing Costs -1.8 pp North America, EU, China, Australia Short term (≤ 2 years)
    Metals and Components Inflation -1.5 pp North America, EU, global import markets Short term (≤ 2 years)
    Tariff and Trade Exposure -1.1 pp U.S., China, EU–Asia corridors Medium term (2–4 years)
    Extended Equipment Lead Times -1.2 pp North America, EU, GCC, APAC Short term (≤ 2 years)
    Safety-Compliance Cost Burden -0.9 pp North America, EU, Japan, India Medium term (2–4 years)
    Modernization CapEx Resistance -1.3 pp Europe, North America, Japan, Korea Long term (≥ 4 years)

    Opportunity Analysis

    Predictive Uptime Subscriptions

    This is an opportunity rather than a baseline market driver because a large share of the global installed base still operates under calendar-based servicing, where technicians perform 12–24 scheduled visits per year irrespective of real component condition and building owners pay mainly for labor coverage rather than measurable uptime or data services.

    Predictive maintenance can track 20–50 operational parameters, including motor temperature, door open-close cycles, brake behavior, car leveling, ride quality, power draw, controller fault codes, vibration signatures, and emergency-rescue events; this enables suppliers to shift from reactive breakdown calls to intervention before failure.

    The addressable economics are attractive: a connected gateway costing an estimated USD 400–1,500 per unit, plus installation and controller integration, can support recurring fees of USD 10–60 per lift per month, while premium uptime plans for hospitals, hotels, commercial towers, residential portfolios, airports, and rail stations can command 15–35% higher annual contract value than basic maintenance.

    If condition-based service reduces unplanned call-outs by 15–40%, improves technician first-time-fix rates by 10–25%, and lowers parts-expediting cost by 10–20%, customers gain lower disruption while providers increase labor utilization and recurring gross margin by approximately 300–700 basis points.

    Opportunity Impact Analysis

    Opportunity (~) % Potential CAGR Geographic Relevance Execution Window
    Predictive Uptime Subscriptions +1.5 pp North America, EU, Japan, Korea, China Short term (≤ 2 years)
    Modernization-as-a-Service Finance +1.7 pp Europe, North America, Japan, Korea Medium term (2–4 years)
    Aging-in-Place Home Lifts +1.3 pp Japan, EU, North America, China Long term (≥ 4 years)
    Data-Center Vertical Transport +1.1 pp North America, EU, GCC, Singapore, India Medium term (2–4 years)
    Transit Availability Contracts +1.0 pp India, ASEAN, GCC, Europe, North America Medium term (2–4 years)
    Independent-Service Roll-Ups +0.9 pp North America, EU, India, ASEAN, LATAM Medium term (2–4 years)

    Challenges Analysis

    Certified Technician Scarcity

    U.S. Bureau of Labor Statistics projections indicate that employment of elevator and escalator installers and repairers will rise 5% from 2024 to 2034 above the all-occupation average—while industry leadership has publicly stated that recruiting enough mechanics remains difficult even with an approximately 45,000-person technician workforce at one major OEM.

    The productivity penalty is substantial: a newly hired technician generally requires 18–36 months of structured apprenticeship, safety training, supervised field exposure, and code familiarization before independently handling complex modernization or high-rise troubleshooting, while advanced controller, destination-dispatch, escalator, and transit-equipment expertise can require a further 12–24 months.

    A typical mechanic can maintain roughly 80–180 standard passenger elevators annually depending on travel density, maintenance scope, and call-out frequency, but only 25–60 high-utilization escalators or critical transit units, so a 10% labor-capacity shortfall can force 5–15% longer preventive-maintenance cycles, increase overtime by 10–25%, and delay new-equipment commissioning by 2–8 weeks.

    OEMs must respond through regional training academies, digitally guided work instructions, remote expert support, apprenticeship partnerships, predictive diagnostics, and technician route optimization, yet workforce replenishment remains slow due to licensing requirements and safety-critical work; the talent gap therefore imposes an estimated -1.3 percentage-point friction drag on the market’s maximum CAGR across North America, Europe, Japan, South Korea, and fast-urbanizing APAC through the long term.

    Challenges Impact Analysis

    Challenge (~) % CAGR Friction Geographic Relevance Mitigation Horizon
    Certified Technician Scarcity -1.3 pp North America, EU, Japan, Korea, APAC Long term (≥ 4 years)
    Connected-System Cybersecurity -0.9 pp North America, EU, China, Japan, Korea Medium term (2–4 years)
    Bespoke Project Integration -1.1 pp GCC, China, India, North America, EU Medium term (2–4 years)
    Electronic Component Volatility -0.8 pp Global; Asia–EU, Asia–U.S. corridors Short term (≤ 2 years)
    Aging Fleet Data Gaps -1.0 pp Europe, North America, Japan, Korea Long term (≥ 4 years)
    Multi-Brand Service Fragmentation -0.9 pp India, ASEAN, LATAM, Africa, Middle East Medium term (2–4 years)

    Geopolitical Impact Analysis

    Ongoing geopolitical conflicts are increasing supply chain costs and delaying elevator and escalator projects worldwide.

    The ongoing conflicts in Eastern Europe and the Middle East continue to influence the Elevators and Escalators Market by disrupting the supply of steel, aluminum, electrical components, and electronic control systems used in manufacturing. Higher freight costs, longer shipping routes, and increased insurance premiums have added pressure to project budgets and delivery schedules.

    In 2025, the Strait of Hormuz handled around 20 million barrels per day of crude oil and oil products, representing around 25% of global seaborne oil trade, making any disruption to this route significant for manufacturing industries that depend on stable energy prices and international logistics. The International Energy Agency (IEA) also notes that about 20% of global LNG trade moves through the same corridor, increasing energy cost uncertainty for manufacturers.

    During 2026, manufacturers of elevators and escalators continued to focus on supply chain diversification, regional sourcing, and inventory planning to reduce the impact of geopolitical uncertainty. Construction companies also adjusted procurement timelines to account for shipping delays and fluctuating material costs. According to UN Trade and Development (UNCTAD), the Strait of Hormuz carries around one quarter of global seaborne oil trade, and disruptions have affected maritime transport, global supply chains, and industrial production costs.

    Regional Analysis

    Regional Analysis: Elevators and Escalators Market.

    Asia Pacific stands as the dominating region in the global elevators and escalators market, accounting for a 62.80% share and a valuation of 74.10 billion US dollars, figures supplied directly by the client and used as given without independent verification. This leadership position is underpinned by the scale of regional construction activity, particularly in China.

    • According to the International Trade Administration (ITA), an agency of the U.S. Department of Commerce, China remains the world’s largest construction market, valued at approximately 4.82 trillion US dollars in 2025, sustaining continued demand for vertical transportation equipment across residential, commercial, and infrastructure projects throughout the region.

    Regional demand is further reinforced by rapid urbanization across Asia Pacific economies. The ITA reports that China’s urbanization rate reached 67% in 2024, a level that concentrates population growth in dense, high rise urban centers where elevators and escalators are essential building infrastructure.

    Even as China’s real estate investment declined 10.7% between January and May 2025 year on year, the ITA notes that demand has remained comparatively stable in Tier 1 cities such as Beijing and Shanghai, sustaining new installation, replacement, and modernization activity.

    Elevators and Escalators Market Regional Analysis

    Key Regions and Countries Covered

    • North America
      • The US
      • Canada
    • Europe
      • Germany
      • France
      • The UK
      • Spain
      • Italy
      • Russia & CIS
      • Rest of Europe
    • APAC
      • China
      • Japan
      • South Korea
      • India
      • ASEAN
      • Rest of APAC
    • Latin America
      • Brazil
      • Mexico
      • Rest of Latin America
    • Middle East & Africa
      • GCC
      • South Africa
      • Rest of MEA

    Key Players Analysis

    Elevator and escalator manufacturers focus on strengthening technological innovation, manufacturing efficiency, and service capabilities to maintain a competitive position in the global market. A major priority is the development of energy-efficient systems, smart destination control technologies, regenerative drives, touchless operation, and predictive maintenance platforms that improve passenger safety, operational reliability, and building performance.

    Companies continue to invest in automated manufacturing facilities and digital engineering processes to enhance product quality and shorten production timelines. They also expand modernization services for aging elevator infrastructure, allowing building owners to upgrade existing systems instead of replacing them entirely.

    Leading companies including Otis Worldwide Corporation, Schindler Holding AG, KONE Corporation, TK Elevator GmbH, Mitsubishi Electric Corporation, Hitachi Ltd., Hyundai Elevator Co., Ltd., Fujitec Co., Ltd., Toshiba Elevator and Building Systems Corporation, Canny Elevator Co., Ltd., Sicher Elevator Co., Ltd., SJEC Corporation, Kleemann Hellas S.A., Orona S. Coop., and Johnson Lifts Private Limited continue expanding their market presence through manufacturing capacity upgrades, regional production facilities, and stronger service networks.

    These companies emphasize long-term maintenance contracts, digital monitoring platforms, and rapid response capabilities to build lasting customer relationships. Strategic partnerships with construction firms, real estate developers, and infrastructure contractors further support project pipelines across residential, commercial, industrial, and public infrastructure sectors.

    The Major Players in The Industry

    • Otis Worldwide Corporation
    • Schindler Holding AG
    • KONE Corporation
    • TK Elevator GmbH
    • Mitsubishi Electric Corporation
    • Hitachi Ltd.
    • Hyundai Elevator Co., Ltd.
    • Fujitec Co., Ltd.
    • Toshiba Elevator and Building Systems Corporation
    • Canny Elevator Co., Ltd.
    • Sicher Elevator Co., Ltd.
    • SJEC Corporation
    • Kleemann Hellas S.A.
    • Orona S. Coop.
    • Johnson Lifts Private Limited

    Key Development

    • In April 2026, KONE Corporation agreed to combine with TK Elevator GmbH (TKE) in a cash and share transaction led by a consortium of Advent and Cinven. The deal values TKE at EUR 29.4 billion, including a EUR 5 billion cash payment and up to 270 million newly issued KONE class B shares, creating a combined global leader in the elevator and escalator industry.
    • In April 2026, Otis Worldwide Corporation closed a deal to acquire a majority stake in WeMaintain, a technology enabled elevator and escalator service company founded in 2017 with more than 350 employees across Asia and Europe, strengthening Otis’ digital and AI based service capabilities.
    • In November 2025, Mitsubishi Electric Corporation completed the acquisition of AG MELCO Elevator Co. L.L.C. in Dubai, making it a wholly owned subsidiary and extending a partnership spanning over 50 years since the company’s 1975 founding.

    Report Scope

    Report Features Description
    Market Value (2025) USD 118 Bn
    Forecast Revenue (2035) USD 216.2 Bn
    CAGR (2026 2035) 6.3%
    Base Year for Estimation 2025
    Historic Period 2020-2024
    Forecast Period 2026-2035
    Report Coverage Revenue Forecast, Market Dynamics, Competitive Landscape, Recent Developments
    Segments Covered By Product Type (Elevators, Escalators, Moving Walkways), By Elevator Type (Passenger Elevators, Freight Elevators, Hospital Elevators, Home Elevators), By Service Type (New Installation, Maintenance and Repair, Modernization), By Elevator Technology (Traction, Machine Room-Less, Hydraulic), By End Use (Residential, Commercial, Industrial, Infrastructure)
    Regional Analysis North America    The US & Canada; Europe    Germany, France, The UK, Spain, Italy, Russia & CIS, Rest of Europe; APAC  China, Japan, South Korea, India, ASEAN & Rest of APAC; Latin America  Brazil, Mexico & Rest of Latin America; Middle East & Africa  GCC, South Africa, & Rest of MEA
    Competitive Landscape Otis Worldwide Corporation, Schindler Holding AG, KONE Corporation, TK Elevator GmbH, Mitsubishi Electric Corporation, Hitachi Ltd., Hyundai Elevator Co., Ltd., Fujitec Co., Ltd., Toshiba Elevator and Building Systems Corporation, Canny Elevator Co., Ltd., Sicher Elevator Co., Ltd., SJEC Corporation, Kleemann Hellas S.A., Orona S. Coop., and Johnson Lifts Private Limited.
    Customization Scope Customization for segments, region/country level will be provided. Moreover, additional customization can be done based on the requirements.
    Purchase Options We have three licenses to opt for: Single User License, Multi User License (Up to 5 Users), Corporate Use License (Unlimited Users and Printable PDF)


    keyboard_arrow_up
  • Segments Sub-segments
    By Product Type
    • Elevators
    • Escalators
    • Moving Walkway
    By Elevator Type
    • Passenger Elevators
    • Freight Elevators
    • Hospital Elevators
    • Home Elevators
    By Service Type
    • New Installation
    • Maintenance and Repair
    • Modernization
    By Elevator Technology
    • Traction
    • Machine Room-Less
    • Hydraulic
    By End Use
    • Residential
    • Commercial
    • Industrial
    • Infrastructure
     
    North America Europe Asia Pacific Latin America Middle East & Africa
    • US
    • Canada
    • Germany
    • France
    • The UK
    • Spain
    • Italy
    • Rest of Europe
    • China
    • Japan
    • South Korea
    • India
    • Australia
    • Rest of APAC
    • Brazil
    • Mexico
    • Rest of Latin America
    • GCC
    • South Africa
    • Rest of MEA
Elevators and Escalators Market
Published date: Sep 2026
add_shopping_cartBuy Now get_appDownload Sample

Related Reports

  • Battery Passport Market
  • Food Fortifying Agents Market
  • Heat Meter Market
  • Binders and Scaffolders for Meat And Meat Substitutes Market
  • Coal Bed Methane Market
  • Distribution Automation Market
  • Vector Control Market
  • Grain Silos and Storage System Market
  • Low Intensity Sweeteners Market
  • Induction Heating Market
Elevators and Escalators Market
  • 193403
  • Sep 2026
    • ★★★★★
      ★★★★★
Buy Now
Trusted by more than 17382 organizations globally
  • Client Logo
  • Client Logo
  • Client Logo
  • Client Logo
  • Client Logo
  • Client Logo
  • Client Logo
  • Client Logo
  • Client Logo
  • Client Logo
  • Client Logo
  • Client Logo
  • Client Logo
  • Client Logo
  • Client Logo
  • Client Logo

Our Clients

philips
pentair
suez
ecowater
ergobaby
fabricato
genomatica
lenzing
lilly
siemens
honeywell
valspar
pactiv
petsure
schweitzer-online
sappi
pfizer
unilabs
lonza
BD
mckinsey
hilti
✖
Request a Sample Report
We'll get back to you as quickly as possible
CAPTCHA Code

✖
Request a Sample Report
We'll get back to you as quickly as possible
CAPTCHA Code

  • location_on420 Lexington Avenue, Suite 300 New York City, NY 10170,
    United States
  • phone+1 718 874 1545 (International)
  • phone+91 78878 22626 (Asia)
  • email[email protected]
  • Facebook Logo
  • Twitter Logo
  • LinkedIn Logo
Find Help
  • Contact Us
  • How to Order
Legal
  • Privacy Policy
  • Refund Policy
  • Frequently Asked Questions
  • Terms and Conditions
Explore

  • About Us
  • Our Clients
  • Media Mentions
  • Infographics
  • Statistics and Facts
  • Research Methodology
  • Why Choose Us?
Secured Payment Options

© 2026 Market.Us. All Rights Reserved.