


Report Overview
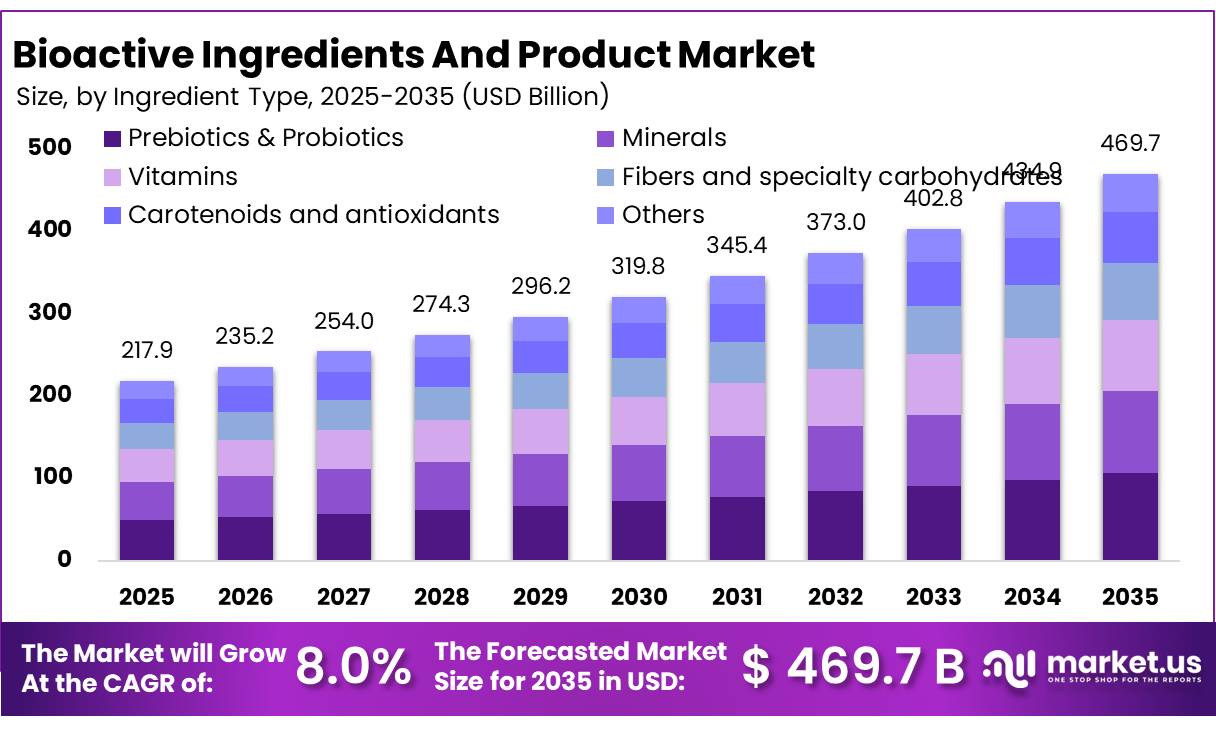
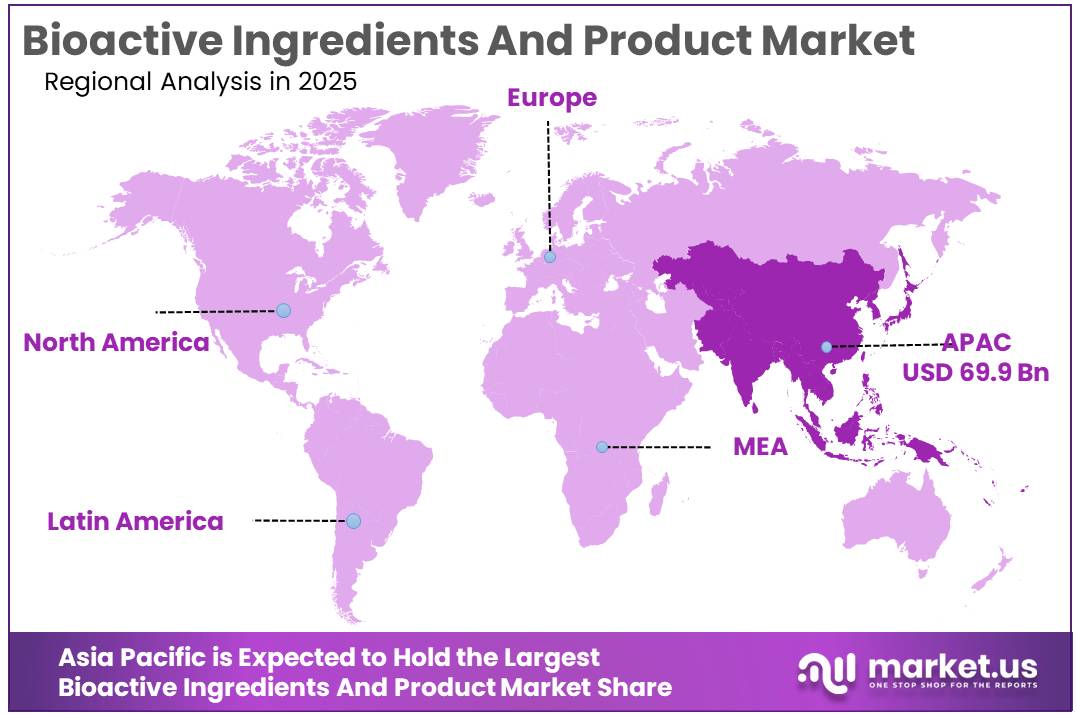
The Global Bioactive Ingredients And Product Market size is expected to be worth around USD 469.7 Billion by 2035, from USD 217.9 Billion in 2025, growing at a CAGR of 8.0% during the forecast period from 2026 to 2035. In 2025, Asia Pacific held a dominant market position, capturing more than a 32.00% share, holding USD 69.9 Billion revenue.
Bioactive ingredients are compounds that can influence biological processes in the human body and are used in functional foods, dietary supplements, beverages, personal care products, and pharmaceutical applications. Common examples include polyphenols, carotenoids, omega-3 fatty acids, probiotics, prebiotics, plant extracts, peptides, and selected vitamins and minerals.
Food and ingredient companies are investing in extraction, fermentation, encapsulation, and formulation technologies to improve ingredient stability and make active compounds easier to incorporate into everyday products. The U.S. National Institutes of Health explains that dietary supplement ingredients can include vitamins, minerals, herbs, amino acids, and metabolites. Supplements are available in forms such as tablets, capsules, powders, and liquids, giving ingredient suppliers several routes to market.
Scientific validation and regulatory compliance are important factors in commercial development. In May 2025, the U.S. Food and Drug Administration and the National Institutes of Health announced a joint Nutrition Regulatory Science Program to strengthen nutrition research and support evidence-based food policy. This initiative provides relevant context for manufacturers seeking stronger scientific support for ingredients and nutrition-related product claims.
- European regulation also influences product development and marketing. The European Food Safety Authority evaluates scientific evidence for health claims used on food labels and in advertising. As of 2023, more than 2,300 health-claim applications had been evaluated by EFSA, while more than 70% of evaluated claims had been rejected due to insufficient scientific evidence. This highlights the importance of reliable research, clear product specifications, and evidence-backed claims for bioactive ingredient suppliers.
Future growth opportunities include plant-derived bioactives, microbiome-focused ingredients, personalised nutrition, improved delivery systems, and upcycled compounds recovered from food-processing by-products. Encapsulation can help protect sensitive ingredients from heat, oxygen, light, or moisture, while fermentation may offer more controlled production of selected compounds. However, companies must manage raw-material variability, extraction costs, ingredient stability, and differences in regulatory requirements across markets.
Key Takeaways
- Bioactive Ingredients And Product Market size is expected to be worth around USD 469.7 Billion by 2035, from USD 217.9 Billion in 2025, growing at a CAGR of 8.0%.
- Prebiotics & Probiotics held a dominant market position, capturing more than a 22.00% share.
- Plant-based held a dominant market position, capturing more than a 48.00% share.
- Powder held a dominant market position, capturing more than a 45.00% share.
- Gut and digestive health held a dominant market position, capturing more than a 31.00% share.
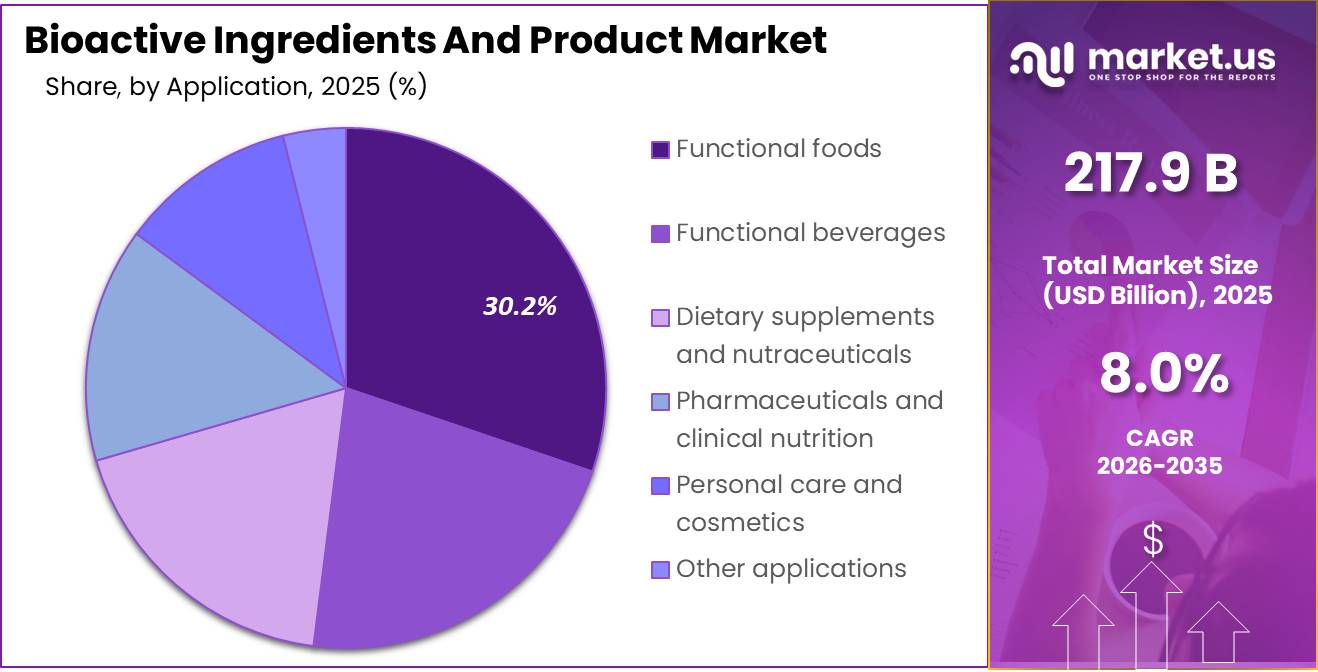
- Functional foods held a dominant market position, capturing more than a 30.00% share.
- Asia Pacific held a dominant position in the Bioactive Ingredients and Products Market, accounting for 32.00% of the market, valued at USD 69.9 billion.
By Ingredient Type Analysis
Prebiotics and Probiotics Lead the Bioactive Ingredients and Products Market with a 22.00% Share
In 2025, “Prebiotics & Probiotics” held a dominant market position, capturing more than a 22.00% share. The segment benefits from growing interest in digestive health and ingredients that support the gut microbiome. Prebiotics, such as inulin and fructooligosaccharides, provide fuel for beneficial gut microorganisms, while probiotics are live microorganisms that may offer health benefits when consumed in adequate amounts.
- These ingredients are used in dietary supplements, fermented foods, functional beverages, and selected fortified food products. The U.S. National Institutes of Health notes that many probiotic supplements contain 1 billion to 10 billion colony-forming units (CFU) per dose, although higher counts do not automatically mean better results. This supports the importance of strain selection, product quality, and scientific evidence in formulation.
Minerals are important bioactive ingredients used in dietary supplements, fortified foods, beverages, and specialised nutrition products. Calcium, magnesium, iron, zinc, and selenium support different body functions, including bone health, oxygen transport, muscle activity, and normal immune function. Manufacturers use mineral ingredients to address nutritional needs and develop products for specific consumer groups, while considering absorption, stability, taste, and permitted health claims.
By Source Analysis
Plant-Based Sources Lead the Bioactive Ingredients and Products Market with a 48.00% Share
In 2025, “Plant-based” held a dominant market position, capturing more than a 48.00% share. Plant-based bioactive ingredients are obtained from fruits, vegetables, herbs, spices, seeds, grains, and other botanical sources. They include polyphenols, carotenoids, plant sterols, flavonoids, and selected natural extracts used in functional foods, dietary supplements, beverages, and personal care products. Demand is supported by interest in plant-derived formulations and the wider use of botanical ingredients in products designed for specific nutritional needs.
Animal-based bioactive ingredients are obtained from sources such as fish, dairy, eggs, and other animal-derived materials. Common examples include omega-3 fatty acids from fish oil, collagen peptides, whey proteins, and bioactive milk peptides. These ingredients are used in dietary supplements, functional foods, sports nutrition, and specialised health products. Their use depends on factors such as purity, absorption, stability, sourcing, and consumer dietary preferences.
By Form Analysis
Powder Forms Lead the Bioactive Ingredients and Products Market with a 45.00% Share
In 2025, “Powder” held a dominant market position, capturing more than a 45.00% share. Powder-based bioactive ingredients are widely used in dietary supplements, fortified foods, functional beverages, and nutritional formulations because they are convenient to measure, blend, package, and transport. Ingredients such as plant extracts, mineral compounds, protein peptides, and probiotic preparations can be supplied in powder form to support different product formulations. Depending on the ingredient, drying and encapsulation methods can also help improve storage stability and simplify handling.
Liquid bioactive ingredients are used in functional beverages, liquid dietary supplements, syrups, emulsions, and selected personal care products. They can be suitable for ingredients that dissolve or disperse well in liquids and for formulations designed for easy consumption or precise dosing. Liquid formats also allow manufacturers to combine several active ingredients in one product, although stability, taste, solubility, and microbial control require careful management.
The U.S. National Institutes of Health notes that dietary supplements are available in different forms, including liquids, alongside tablets, capsules, and powders. This supports the relevance of liquid delivery formats across the wider supplement industry but does not establish the liquid segment’s market share.
By Functionality Analysis
Gut and Digestive Health Leads the Bioactive Ingredients and Products Market with a 31.00% Share
In 2025, “Gut and digestive health” held a dominant market position, capturing more than a 31.00% share. This segment benefits from growing interest in ingredients that support digestion and a balanced gut microbiome. Prebiotics, probiotics, dietary fibres, and selected bioactive compounds are used in supplements, fortified foods, and functional beverages designed for digestive wellness. Manufacturers are developing formulations that suit different consumer needs while focusing on ingredient stability, product quality, and scientific evidence.
The segment’s relevance is supported by research into the relationship between gut microorganisms and human health. The U.S. National Institutes of Health explains that probiotics are live microorganisms that may provide health benefits when consumed in adequate amounts. The 31.00% share is based on the supplied market data and is not independently verified by a government source.
Liquid formulations are used to deliver bioactive ingredients in functional beverages, liquid supplements, syrups, and other products designed for convenient consumption. They can combine selected ingredients in a ready-to-use format, although manufacturers must manage taste, solubility, microbial stability, and shelf life.
Liquid delivery can be useful for consumers who have difficulty swallowing tablets or capsules, while formulation choices depend on the ingredient’s properties and intended use. According to the U.S. National Institutes of Health, dietary supplements are available in several forms, including liquids, powders, capsules, and tablets. This supports the relevance of liquid formats in the broader supplement industry, but it does not establish a market share for liquid functionality within bioactive ingredients.
By Application Analysis
Functional Foods Lead the Bioactive Ingredients and Products Market with a 30.00% Share
In 2025, “Functional foods” held a dominant market position, capturing more than a 30.00% share. The segment benefits from the use of bioactive ingredients in everyday food products designed to provide benefits beyond basic nutrition. These ingredients include dietary fibres, probiotics, plant extracts, vitamins, minerals, and omega-3 fatty acids, depending on the product’s intended purpose.
Food manufacturers incorporate them into fortified cereals, dairy products, nutrition bars, and other packaged foods to meet consumer interest in digestive health, general wellness, and balanced nutrition. Product development focuses on ingredient stability, taste, safety, and evidence supporting any health claims.
Functional beverages include drinks formulated with ingredients such as probiotics, plant extracts, vitamins, minerals, and other bioactive compounds. These products provide manufacturers with a convenient format for delivering selected ingredients in ready-to-drink beverages, fortified waters, and nutrition drinks. Demand is supported by interest in convenient nutrition and alternatives to traditional supplement formats. However, manufacturers must manage ingredient solubility, flavour, shelf stability, and processing conditions to maintain product quality.
According to the U.S. Centers for Disease Control and Prevention, adults should generally limit added sugars to less than 10% of daily calories, equivalent to 50 grams per day on a 2,000-calorie diet. This government guidance provides useful context for beverage formulation, particularly for products marketed around wellness. It does not directly measure functional beverage consumption or bioactive ingredient sales.
Key Market Segments
By Ingredient Type
- Prebiotics & Probiotics
- Minerals
- Vitamins
- Fibers and specialty carbohydrates
- Carotenoids and antioxidants
- Other ingredients
By Source
- Plant-based
- Animal-based
- Microbial-based
By Form
- Powder
- Liquid
- Capsules and tablets
- Microencapsulated
- Other forms
By Functionality
- Gut and digestive health
- Immune health
- Cardiovascular health
- Cognitive health
- Other functionalities
By Application
- Functional foods
- Functional beverages
- Dietary supplements and nutraceuticals
- Pharmaceuticals and clinical nutrition
- Personal care and cosmetics
- Other applications
Driver Analysis
Protein And Fiber Demand
Protein and fiber demand is the largest near-term driver because it expands ingredient pull across conventional food, sports nutrition, medical nutrition, weight-management products, and healthy-aging formats, allowing suppliers to sell concentrated proteins, amino-acid blends, prebiotic fibers, resistant starches, beta-glucans, and satiety-oriented systems rather than low-value commodity ingredients.
The 2025-2030 Dietary Guidelines for Americans prioritize protein foods at every meal, specify a 1.2-1.6 gram-per-kilogram daily protein target, recommend 2-4 daily whole-grain servings, and describe high-fiber foods and fermented foods as supportive of a diverse microbiome; the guidelines also encourage lower consumption of highly processed foods, added sugars, and refined carbohydrates.
For an original 100-million-unit annual beverage or snack platform, raising protein from 10 grams to 20 grams per unit requires 1,000 additional tonnes of protein isolate or concentrate each year, while adding 5 grams of soluble fiber consumes another 500 tonnes; at an incremental bioactive-system price of USD 4-12 per kg, this creates USD 6-18 million of ingredient revenue before flavor masking, dispersion, stability, and clinical-substantiation services.
Suppliers able to deliver 85-90% protein purity, low off-notes, dispersibility in 15-30 seconds, and 12-month stability can command 20-50% premiums over basic plant flour, moving customer contracts from spot commodity purchase to application-specific formulation agreements. This ingredient shift supports approximately +2.1 percentage points of short-term CAGR across North America, Europe, APAC, and GCC markets.
Drivers Impact Analysis
| Driver | (~) % Impact on CAGR Forecast | Geographic Relevance | Impact Timeline |
|---|---|---|---|
| Protein And Fiber Demand | +2.1% | North America, EU, APAC, GCC | Short term (≤ 2 years) |
| Healthy-Aging Formulations | +1.8% | Japan, EU, North America, China | Medium term (2-4 years) |
| Microbiome Ingredient Adoption | +1.6% | North America, EU, Japan, Korea, China | Medium term (2-4 years) |
| Precision Fermentation Scale-Up | +1.5% | North America, EU, Israel, Singapore, APAC | Long term (≥ 4 years) |
| Clinical-Grade Product Claims | +1.3% | North America, EU, Japan, Australia | Medium term (2-4 years) |
| Food And Supplement Convergence | +1.1% | North America, EU, India, ASEAN, GCC | Short term (≤ 2 years) |
Restraint Analysis
Claim-Approval Bottlenecks
Claim-approval bottlenecks restrict market conversion because bioactive suppliers may possess promising mechanistic, preclinical, or small-scale human evidence but cannot freely translate it into explicit disease-risk, microbiome, cognitive, immune, or metabolic claims without meeting jurisdiction-specific standards of scientific substantiation, wording, dosage, labeling, and target-population disclosure. EU Regulation (EC) No 1924/2006 requires nutrition and health claims to be clear, accurate, and grounded in scientific evidence, while EFSA evaluates scientific substantiation and the EU Register distinguishes authorized from non-authorized claims and their conditions of use.
An original clinical substantiation program for a new digestive-health or cognition claim can require 150-300 participants, two treatment arms, 12-24 weeks, 3-6 clinical sites, and USD 1.0-3.5 million in direct study cost; after protocol design, ethics review, recruitment, laboratory analysis, statistical work, dossier writing, and regulatory review, the commercial launch can shift by 24-48 months. For an ingredient developer with a USD 10 million annual sales objective, a two-year claim delay can defer USD 20 million of revenue opportunity while patent life continues to erode, reducing the net present value of R&D and forcing reliance on less differentiated structure-function messaging.
Suppliers consequently narrow portfolios toward already authorized claims, generic vitamins and minerals, or vague wellness positioning, which weakens price realization and compresses a potential USD 15-40 per kg clinical premium to USD 3-10 per kg for less substantiated actives. This produces an estimated -1.8 percentage-point medium-term CAGR restraint in Europe, the UK, Australia, and Japan.
Restraint Impact Analysis
| Restraint | (~) % Impact on CAGR Forecast | Geographic Relevance | Impact Timeline |
|---|---|---|---|
| Claim-Approval Bottlenecks | -1.8% | EU, UK, Australia, Japan | Medium term (2-4 years) |
| Novel-Food Authorization Costs | -1.5% | EU, UK, Singapore, APAC imports | Medium term (2-4 years) |
| Raw-Material Supply Volatility | -1.3% | Global, botanical-origin corridors | Short term (≤ 2 years) |
| Clinical Evidence Cost Burden | -1.2% | North America, EU, Japan, Australia | Long term (≥ 4 years) |
| Bioavailability Formulation Costs | -1.0% | Global premium-product markets | Medium term (2-4 years) |
| Quality And Adulteration Risk | -0.9% | North America, EU, India, China, ASEAN | Long term (≥ 4 years) |
Opportunity Analysis
Precision-Nutrition Platforms
Precision-nutrition platforms are an untapped monetization layer rather than a current baseline driver because most bioactive ingredients are still sold as population-wide, fixed-dose inputs, while integrating biomarker, dietary, microbiome, wearable, genetic, and adherence data can convert them into recurring personalized protocols, subscription packs, and algorithm-led replenishment programs. NIH’s Nutrition for Precision Health initiative is explicitly developing AI-based algorithms to predict individual responses to foods and dietary patterns by examining interactions among diet, genes, proteins, microbiome, metabolism, and contextual factors, validating the scientific infrastructure needed for individualized nutrition beyond generic wellness segmentation.
An original platform enrolling 100,000 consumers at USD 120-250 per year for a digital assessment, recommendation engine, and 3-6 bioactive-product bundles creates USD 12-25 million annual gross revenue; if 35% convert to a monthly USD 40-80 replenishment plan, recurring product revenue can reach USD 16.8-33.6 million annually before partner-brand revenue sharing. A supplier can raise lifetime value from an estimated USD 25-60 per one-off supplement purchase to USD 350-900 over 24 months, reduce paid-customer-acquisition cost by 20-35% through tailored retention triggers, and use consented real-world data to identify high-response cohorts for formal clinical trials.
This is future upside, not a current driver, because scalable execution requires validated algorithms, data-governance controls, clinician or dietitian partnerships, cybersecurity, reimbursement experimentation, and caution against unsubstantiated individualized medical claims; successful implementation can add approximately +2.2 percentage points to CAGR across North America, Europe, Japan, Korea, and GCC markets.
Opportunity Impact Analysis
| Opportunity | (~) % Potential CAGR Upside | Geographic Relevance | Execution Window |
|---|---|---|---|
| Precision-Nutrition Platforms | +2.2% | North America, EU, Japan, Korea, GCC | Medium term (2-4 years) |
| Evidence-as-a-Service | +1.9% | North America, EU, Japan, Australia | Short term (≤ 2 years) |
| Fermentation Capacity Partnerships | +1.7% | North America, EU, Singapore, Israel, APAC | Long term (≥ 4 years) |
| Medical-Nutrition Adjacent Entry | +1.5% | North America, EU, Japan, China, GCC | Medium term (2-4 years) |
| Upcycled Bioactive Ingredients | +1.2% | EU, North America, Brazil, India, ASEAN | Medium term (2-4 years) |
| Regional Formulation Roll-Ups | +1.0% | India, ASEAN, LatAm, Africa, GCC | Long term (≥ 4 years) |
Challenges Analysis
Evidence Translation Gap
The evidence-translation gap persists because positive in-vitro findings, animal models, biomarker shifts, and small exploratory trials do not automatically establish a reproducible consumer-relevant benefit at a defined dose, in a defined population, and in a finished food or supplement format; suppliers therefore face a conversion problem from biological promise to commercially usable substantiation. EU health-claim rules require scientific evidence and EFSA scrutiny, while the EU Register distinguishes permitted and non-authorized claims, forcing companies to link a specific constituent, dose, target population, endpoint, and wording rather than extrapolate generic science into broad benefit claims.
An original 12-week pilot with 60 participants may cost USD 250,000-600,000 and detect directional improvement, but a launch-grade 16-24-week randomized trial with 180-300 participants, placebo control, pre-specified primary endpoint, and 15% attrition allowance can require USD 1.5-4.0 million; if only 60% of pilot effects replicate at the larger scale, developers must either write off the study, revise dose, or finance a further 12-18 months of research.
The margin consequence is material: without substantiation, a botanical may sell at USD 8-15 per kg as a generic wellness input, whereas an evidence-backed standardized ingredient can command USD 25-60 per kg, but the evidence investment is difficult to amortize unless annual volume exceeds 100-300 tonnes or multiple brand customers share the platform. Adaptive studies, precompetitive biomarker consortia, master protocols, and standardized endpoints can reduce wasted trials, yet biological heterogeneity and claim-law differences sustain an estimated -1.5 percentage-point long-term CAGR friction across North America, Europe, Japan, and Australia.
Challenges Impact Analysis
| Challenge | (~) % CAGR Friction Drag | Geographic Relevance | Mitigation Horizon |
|---|---|---|---|
| Evidence Translation Gap | -1.5% | North America, EU, Japan, Australia | Long term (≥ 4 years) |
| Biological Batch Variability | -1.3% | Global, botanical and marine corridors | Long term (≥ 4 years) |
| Fermentation Scale-Up Risk | -1.2% | North America, EU, Singapore, Israel, APAC | Medium term (2-4 years) |
| Stability And Delivery Limits | -1.0% | Global functional-food markets | Medium term (2-4 years) |
| Quality-System Fragmentation | -0.9% | India, China, ASEAN, LatAm, global imports | Long term (≥ 4 years) |
| Regulatory Data Interoperability | -0.7% | EU, US, UK, Japan, Australia | Medium term (2-4 years) |
Geopolitical Impact Analysis
Impact of Ongoing Wars on the Bioactive Ingredients and Products Market
Ongoing conflicts in the Middle East and the Russia-Ukraine region are creating uncertainty for the bioactive ingredients and products market by disrupting shipping routes, increasing energy costs, and affecting the supply of agricultural raw materials. Manufacturers sourcing plant extracts, vegetable oils, marine ingredients, and fermentation inputs may face longer delivery times, higher freight charges, and greater difficulty maintaining stable production costs. Higher energy prices can also increase expenses for extraction, drying, purification, and temperature-controlled storage.
On 30 March 2026, the United Nations Conference on Trade and Development reported that shipping transits through the Strait of Hormuz had fallen by more than 95%, disrupting energy and fertilizer flows and increasing transport and production costs.
These disruptions may affect ingredient suppliers that depend on international sourcing and specialised processing facilities. Companies could respond by diversifying suppliers, holding additional inventory, and developing alternative raw-material sources. However, higher inventory and logistics costs may reduce profit margins, particularly for smaller manufacturers. The impact will vary by ingredient, as plant-based extracts, probiotics, omega-3 oils, and mineral compounds have different sourcing and storage requirements.
Regional Insights
Dominating Region: Asia Pacific
Asia Pacific held a dominant position in the Bioactive Ingredients and Products Market, accounting for 32.00% of the market, valued at USD 69.9 billion, according to the supplied market data. Regional demand is supported by increasing interest in preventive healthcare, functional foods, dietary supplements, probiotics, plant extracts, vitamins, minerals, and omega-3 ingredients.
Japan’s ageing population and established functional food sector support demand for ingredients associated with healthy ageing and digestive health, while China and South Korea provide opportunities for manufacturers developing functional nutrition products. South Korea’s regulatory framework also supports product development through approved functional ingredients. As of June 2025, the country recognised 28 approved nutrients, 69 functional ingredients, and 444 individually approved functional ingredients, according to the
Asia Pacific also presents substantial growth opportunities as manufacturers expand functional ingredient applications across food, beverages, dietary supplements, and specialised nutrition products. Growing consumer interest in convenient nutrition and plant-derived ingredients is encouraging investment in extraction, fermentation, formulation, and ingredient stability. South Korea had more than 37,000 registered health supplement products by mid-2024, reflecting an established product ecosystem and broad consumer access.
Regulatory requirements for approved ingredients and substantiated health claims remain important considerations for market participants. Japan offers opportunities in products targeting healthy ageing, while China supports demand through its large consumer base and expanding functional food industry. Growth will depend on scientific validation, product safety, transparent labelling, affordable formulations, and compliance with national regulations. Asia Pacific’s continued product innovation and diverse consumer demand position it as an important region for future market expansion.
Key Regions and Countries Insights
- North America
- US
- Canada
- Europe
- Germany
- France
- The UK
- Spain
- Italy
- Rest of Europe
- Asia Pacific
- China
- Japan
- South Korea
- India
- Australia
- Rest of APAC
- Latin America
- Brazil
- Mexico
- Rest of Latin America
- Middle East & Africa
- GCC
- South Africa
- Rest of MEA
Key Players Analysis
BASF SE is a major chemical and ingredient supplier serving the nutrition, health, food, feed, and pharmaceutical industries. Its Nutrition & Care segment recorded €6.509 billion in sales in 2025, including €1.744 billion from Nutrition & Health. The segment invested €662 million in capital expenditure and acquisitions during the year. BASF supplies vitamins, carotenoids, and other specialised ingredients used in nutritional and health-related applications. Its ingredient business benefits from global production capabilities and technical expertise, although sales were affected by lower nutrition volumes.
Archer Daniels Midland Company (ADM) supplies bioactive and nutritional ingredients for food, beverages, dietary supplements, and animal nutrition. Its portfolio includes plant-based proteins, botanical extracts, natural flavours and colours, probiotics, prebiotics, postbiotics, enzymes, and soluble fibre. In 2025, ADM generated USD 80.269 billion in total revenue, while its Nutrition segment recorded USD 7.512 billion, comprising USD 4.187 billion in Human Nutrition and USD 3.325 billion in Animal Nutrition. This broad portfolio supports ADM’s position in functional nutrition and specialised ingredient development.
Cargill, Incorporated is a global food and agricultural company supplying ingredients for food manufacturing, nutrition, and industrial applications. In fiscal year 2025, the company reported USD 154 billion in revenue, employed more than 155,000 people, and operated across 70 countries, serving 125 markets. Its ingredient capabilities include plant-based solutions, specialty food ingredients, and nature-based sweeteners used in product formulation and reformulation. Cargill’s agricultural sourcing network and research capabilities support ingredient innovation, supply-chain access, and the development of products aligned with changing consumer nutrition preferences.
Top Key Players Outlook
- BASF SE
- Archer Daniels Midland Company
- Cargill, Incorporated
- dsm-firmenich AG
- International Flavors & Fragrances Inc.
- Kerry Group plc
- Ingredion Incorporated
- Novonesis A/S
- Glanbia plc
- Ajinomoto Co., Inc.
- Sabinsa Corporation
- Arla Foods Ingredients Group P/S
- Royal FrieslandCampina N.V.
- Croda International plc
- Kemin Industries, Inc.
Recent Developments
- In February 2026, dsm-firmenich reported €9.034 billion in sales from continuing operations for 2025 and confirmed a €500 million share-buyback programme. The company also agreed to sell its Animal Nutrition & Health business to CVC Capital Partners for an enterprise value of approximately €2.2 billion, including a potential €500 million earn-out, while retaining a 20% equity stake.
- In February 2026, Kerry reported annual revenue of €6.758 billion, EBITDA of €1.208 billion, and research and development expenditure of €314 million for 2025.
Report Scope
| Report Features | Description |
|---|---|
| Market Value (2025) | USD 217.9 Bn |
| Forecast Revenue (2035) | USD 469.7 Bn |
| CAGR (2026-2035) | 8.0% |
| Base Year for Estimation | 2025 |
| Historic Period | 2020-2024 |
| Forecast Period | 2026-2035 |
| Report Coverage | Revenue Forecast, Market Dynamics, Competitive Landscape, Recent Developments |
| Segments Covered | By Ingredient Type (Prebiotics & Probiotics, Minerals, Vitamins, Fibers and specialty carbohydrates, Carotenoids and antioxidants, Other ingredients), By Source (Plant-based, Animal-based, Microbial-based), By Form (Powder, Liquid, Capsules and tablets, Microencapsulated, Other forms), By Functionality (Gut and digestive health, Immune health, Cardiovascular health, Cognitive health, Other functionalities), By Application (Functional foods, Functional beverages, Dietary supplements and nutraceuticals, Pharmaceuticals and clinical nutrition, Personal care and cosmetics, Other applications) |
| Regional Analysis | North America – US, Canada; Europe – Germany, France, The UK, Spain, Italy, Rest of Europe; Asia Pacific – China, Japan, South Korea, India, Australia, Singapore, Rest of APAC; Latin America – Brazil, Mexico, Rest of Latin America; Middle East & Africa – GCC, South Africa, Rest of MEA |
| Competitive Landscape | BASF SE, Archer Daniels Midland Company, Cargill, Incorporated, dsm-firmenich AG, International Flavors & Fragrances Inc., Kerry Group plc, Ingredion Incorporated, Novonesis A/S, Glanbia plc, Ajinomoto Co., Inc., Sabinsa Corporation, Arla Foods Ingredients Group P/S, Royal FrieslandCampina N.V., Croda International plc, Kemin Industries, Inc. |
| Customization Scope | Customization for segments, region/country-level will be provided. Moreover, additional customization can be done based on the requirements. |
| Purchase Options | We have three licenses to opt for: Single User License, Multi-User License (Up to 5 Users), Corporate Use License (Unlimited User and Printable PDF) |





































