


Report Overview
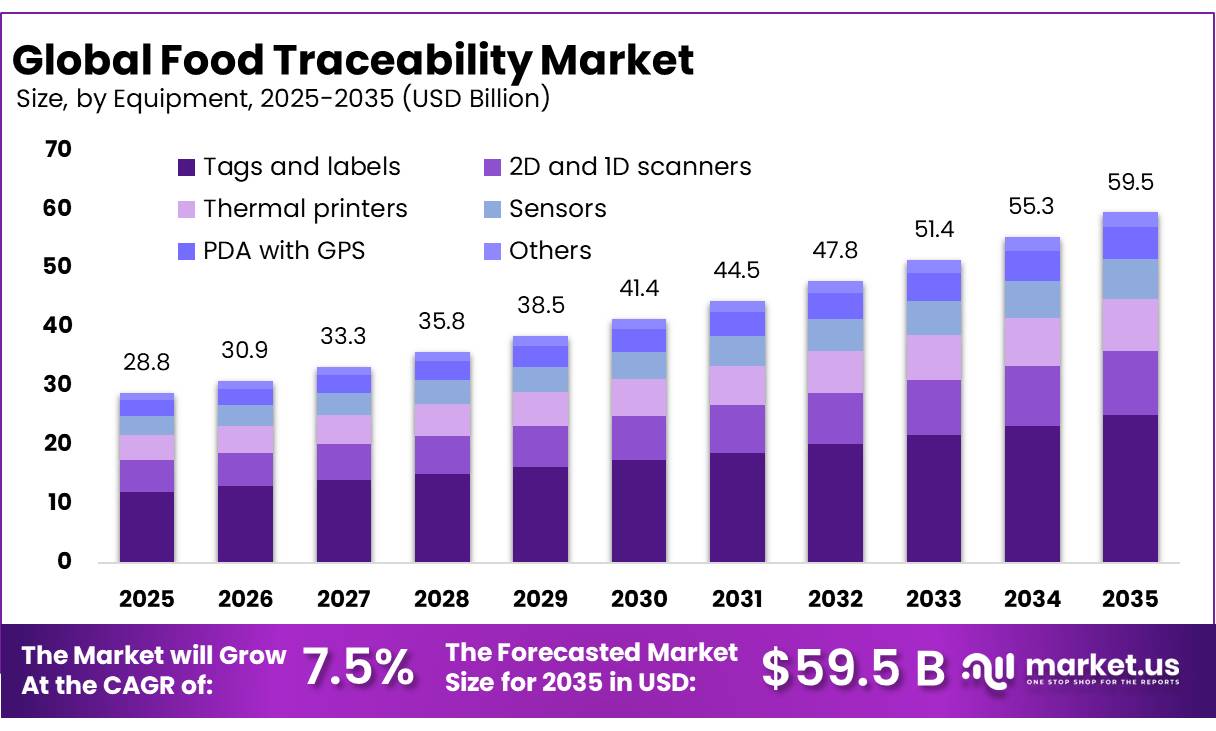
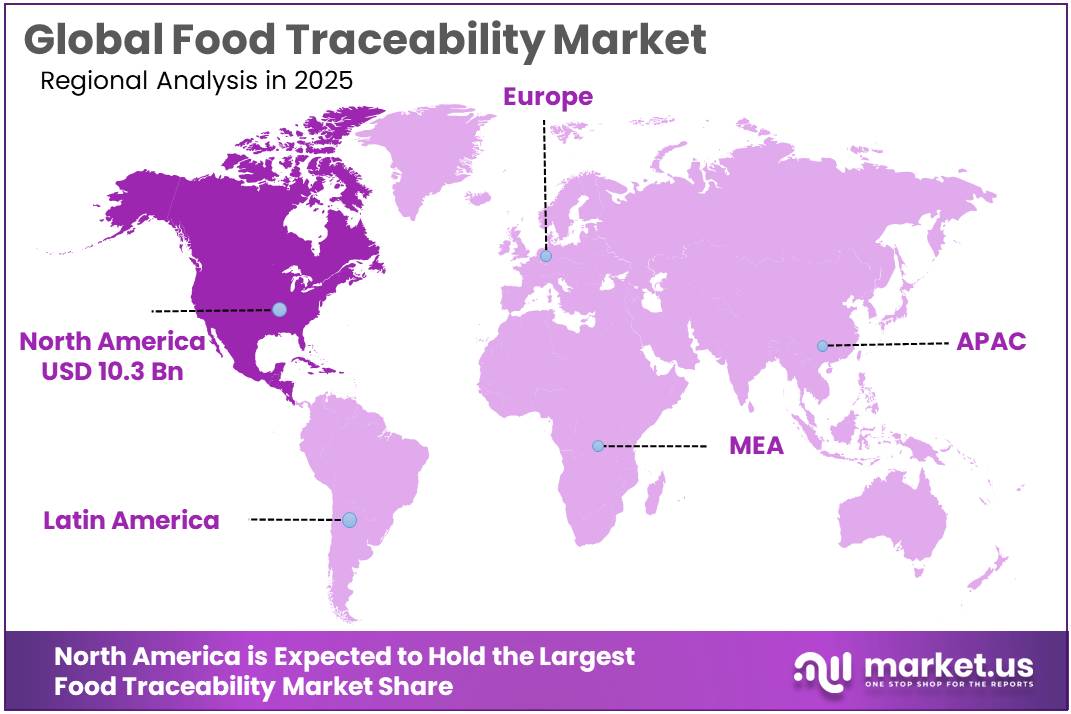
The Global Food Traceability Market size is expected to be worth around USD 59.5 Billion by 2035, from USD 28.8 Billion in 2025, growing at a CAGR of 7.5% during the forecast period from 2026 to 2035. In 2025, North America held a dominant market position, capturing more than a 35.90% share, holding USD 10.3 Billion revenue.
Food traceability has become an important part of modern food safety management because it allows manufacturers, processors, distributors, retailers, and regulators to follow food products and ingredients through different stages of the supply chain. A traceability system normally records information related to production location, batch or lot number, processing activity, transportation, storage, and product movement. The need for stronger traceability is increasing as international food supply chains become longer and more complex.
- The World Health Organization estimates that nearly 600 million people become ill from contaminated food every year, while more than 420,000 deaths are linked to unsafe food globally.
The industrial environment is increasingly moving from paper-based records toward digital platforms, standardized identifiers, sensors, QR codes, cloud databases, and interoperable supply-chain systems. GS1’s EPCIS 2.0 standard, for example, supports digital traceability information covering product locations, shipment movements, certification details, temperature-controlled transportation, and even measured concentrations of chemicals and microorganisms. These capabilities are becoming important for meat, seafood, dairy products, fresh produce, processed foods, and temperature-sensitive ingredients where rapid identification of contamination sources can significantly improve recall management.
- Government regulation remains one of the strongest factors supporting adoption. In the United States, the FDA’s Food Traceability Rule requires businesses handling foods on the Food Traceability List to maintain specified Key Data Elements (KDEs) linked with Critical Tracking Events (CTEs). Covered companies must also be capable of supplying required traceability information to the FDA within 24 hours when requested. Although the original compliance date was January 20, 2026, enforcement has been directed not to begin before July 20, 2028, giving food companies additional time to develop interoperable systems across their supply chains.
Europe also maintains extensive traceability requirements. Under EU General Food Law, food businesses must generally identify their immediate supplier and immediate customer, commonly described as the “one step back, one step forward” principle. Additional requirements apply to specific categories such as foods of animal origin and sprouts. The scale of food-safety monitoring demonstrates the importance of these systems: the European Commission’s 2025 Alert and Cooperation Network recorded 5,344 RASFF notifications, including 1,057 notifications involving fruits and vegetables.
Economic pressure is another major driver. Updated USDA Economic Research Service estimates place the annual cost of foodborne illness in the United States at approximately US$74.7 billion, based on 2023 dollars. About 47.8 million cases were represented in the estimates, while illnesses associated with 31 major foodborne pathogens generated approximately US$44.7 billion in economic costs. These figures strengthen the business case for faster source identification, targeted recalls, improved supplier verification, and real-time product monitoring.
Future growth opportunities are expected to emerge from integration of IoT sensors, cloud platforms, digital product identities, standardized data exchange, and automated recall systems. Traceability can also support waste reduction by providing better visibility into expiry dates, storage conditions, inventories, and supply-chain losses. FAO estimates that about 13.3% of food was lost globally between post-harvest and retail stages in 2023, compared with 13.0% in 2015.
Key Takeaways
- Food Traceability Market size is expected to be worth around USD 59.5 Billion by 2035, from USD 28.8 Billion in 2025, growing at a CAGR of 7.5%.
- Barcode held a dominant market position, capturing more than a 44.80% share.
- Tags and labels held a dominant market position, capturing more than a 42.00% share.
- Software held a dominant market position, capturing more than a 49.60% share.
- livestock held a dominant market position, capturing more than a 34.00% share.
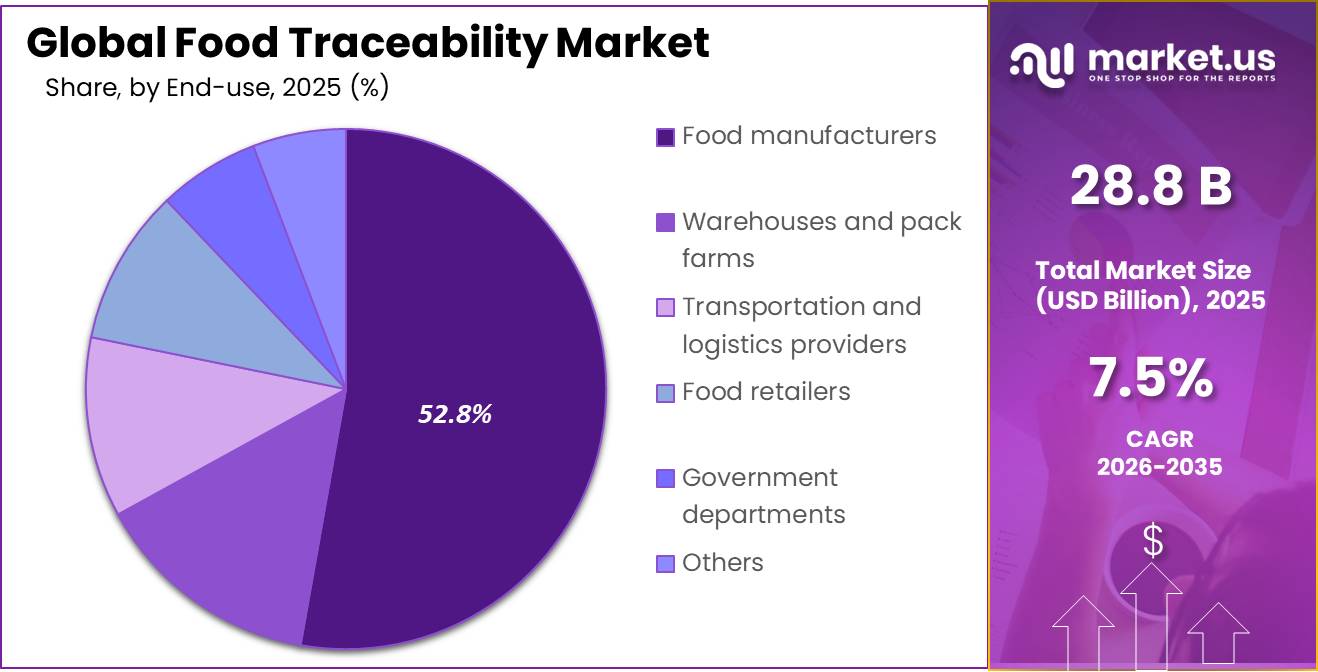
- Food manufacturers held a dominant market position, capturing more than a 52.80% share.
- North America held a dominant market position, capturing more than a 35.90% share and reaching USD 10.3 billion.
By Technology Analysis
Barcode Dominates Food Traceability Technology with 44.80% Share
In 2025, Barcode held a dominant market position, capturing more than a 44.80% share in the Food Traceability Market by technology. Barcode systems remained widely preferred because they provide a simple and practical way to connect food products with batch, lot, shipment, and production records across the supply chain. The technology is commonly used on packaged foods, cartons, pallets, invoices, and shipping documents, allowing processors, distributors, retailers, and regulators to identify products quickly during routine tracking or recall activity.
Regulatory requirements are strengthening the importance of machine-readable identification and lot-level records. The U.S. Food and Drug Administration requires companies handling foods covered by the Food Traceability Rule to maintain Key Data Elements linked with Critical Tracking Events, including information such as the traceability lot code, product description, shipment date, quantity, and receiving or shipping locations.
RFID/RTLS is developing as an important technology within food traceability as food companies seek greater visibility of products moving through processing plants, cold-storage facilities, distribution centers, and transportation networks. Unlike traditional manual scanning, RFID can support automatic identification of tagged products, while real-time location systems can help businesses understand where specific pallets, containers, or food lots are located within the supply chain.
By Equipment Analysis
Tags and Labels Dominate Food Traceability Equipment with 42.00% Share
In 2025, “Tags and labels” held a dominant market position, capturing more than a 42.00% share of the Food Traceability Market by equipment. Their strong position is supported by the widespread use of printed labels, barcodes, QR codes, and lot identifiers across packaged foods, cartons, cases, and logistics units. Tags and labels provide a practical way to connect physical food products with production, shipment, and traceability records throughout processing and distribution. The U.S. FDA explains that a Traceability Lot Code can be communicated through documentation or embedded in a QR code placed on food packaging or a related document, helping receivers maintain the required traceability information.
2D and 1D scanners are becoming increasingly important in the Food Traceability Market as processors, warehouses, distributors, and retailers move toward faster digital capture of product and lot information. These scanners allow workers to read barcodes and QR codes from packaging, labels, cases, and shipment documents and connect that information with electronic traceability records. Their role is particularly useful when food passes through several receiving, processing, and shipping points where accurate identification must be maintained. In 2026, the FDA reported that its food-traceability readiness exercises tested whether participating companies could locate requested records and submit an electronic sortable spreadsheet within 24 hours.
By Component Analysis
Software Leads Food Traceability Components with 49.60% Share
In 2025, “Software” held a dominant market position, capturing more than a 49.60% share in the Food Traceability Market by component. Software remained central to traceability operations because it allows food manufacturers, processors, distributors, and retailers to connect product identification with receiving, transformation, shipping, and inventory records. Modern platforms can organize traceability lot codes, supplier details, shipment information, and critical tracking events within one digital environment.
Hardware plays an important supporting role in food traceability by capturing and transferring product information from physical operations into digital systems. This component includes barcode readers, RFID readers, printers, handheld terminals, sensors, servers, and related devices used across processing plants, warehouses, distribution centers, and retail locations.
In 2026, FDA traceability-readiness exercises conducted between March 9 and April 1 tested whether food companies could locate relevant product records and provide them electronically within 24 hours. This operating requirement highlights the importance of reliable scanning and data-capture equipment at receiving, production, storage, and shipping points. Hardware therefore supports faster lot identification, accurate record entry, inventory visibility, and rapid retrieval of information when regulators or businesses investigate a food-safety event.
By Application Analysis
Meat and Livestock Leads Food Traceability Applications with 34.00% Share
In 2025, “livestock” held a dominant market position, capturing more than a 34.00% share in the Food Traceability Market by application. Meat and livestock operations require strong identification systems because animals and meat products move through farms, transport networks, processing facilities, and distribution channels before reaching customers.
USDA states that animal disease traceability helps identify where diseased or at-risk animals are, where they have been, and when they were present at a location. In 2026, USDA continued supporting electronic identification and offered RFID identification tags for eligible livestock programs, while first-time participants in its sheep and goat identification program could receive up to 100 plastic flock ID tags without charge. These initiatives support better animal identification, faster disease investigations, and improved movement records across livestock supply chains.
Fresh produce and seeds represent an important application area for food traceability as regulators place greater focus on rapid identification of contaminated products and their movement through farms, packing facilities, processors, and distribution networks. In 2026, the U.S. FDA Food Traceability List included fresh cucumbers, herbs, leafy greens, melons, peppers, sprouts, tomatoes, tropical tree fruits, fresh-cut fruits, and fresh-cut vegetables.
The list also specifically covers fresh sprouts produced from grains, nuts, and seeds, making traceability particularly relevant for seed-to-sprout supply chains. FDA developed the list using 7 risk criteria, including outbreak frequency, illness severity, contamination likelihood, pathogen growth potential, manufacturing contamination risk, consumption, and illness cost. These requirements support stronger lot identification, farm records, shipment tracking, and rapid traceback across fresh-produce supply chains.
By End User Analysis
Food Manufacturers Lead Food Traceability End Users with 52.80% Share
In 2025, “Food manufacturers” held a dominant market position, capturing more than a 52.80% share in the Food Traceability Market by end user. Food manufacturers remain major users of traceability systems because they must connect raw materials, processing activities, lot codes, packaging, and shipment records across production operations.
In 2026, the U.S. FDA continued implementing its Food Traceability Rule, which applies to companies that manufacture, process, pack, or hold foods included on the Food Traceability List. Covered firms must maintain Key Data Elements linked to Critical Tracking Events and provide required information to the FDA within 24 hours when requested. This regulatory structure encourages manufacturers to use digital records, lot-level tracking, scanning systems, and traceability software to identify affected products faster and support more targeted recalls.
Warehouses and pack farms form an important end-user group because food traceability depends heavily on accurate records when products are packed, received, stored, and shipped. In 2026, FDA guidance continued to require covered supply-chain participants to maintain information for activities such as initial packing, receiving, shipping, and transformation.
Key Market Segments
By Technology
- Barcode
- RFID/RTLS
- Global Positioning System
- Infrared
- Biometrics
- Near-field communication
- Blockchain
By Equipment
- 2D and 1D scanners
- Tags and labels
- Thermal printers
- Sensors
- PDA with GPS
- Others
By Component
- Hardware
- Software
- Services
By Application
- Meat and livestock
- Fresh produce and seeds
- Dairy products
- Beverages
- Fisheries
- Grains and cereals
- Others
By End User
- Food manufacturers
- Warehouses and pack farms
- Transportation and logistics providers
- Food retailers
- Government departments
- Others
Driver Analysis
FSMA 204 Preparation Cycle
The U.S. Food Traceability Rule preparation cycle is a major 2026–2028 demand catalyst because it requires businesses handling foods on the Food Traceability List—including finfish, crustaceans, molluscan shellfish, leafy greens, fresh-cut produce, soft cheeses, nut butters, and some ready-to-eat foods—to capture standardized Key Data Elements at Critical Tracking Events and provide sortable electronic records to FDA within 24 hours of a request. FDA’s original compliance date was 20 January 2026, but Congress directed the agency not to enforce the rule before 20 July 2028, creating a roughly 30-month implementation runway rather than removing the underlying requirement.
The extension changes purchasing behavior: instead of rushed point deployments, manufacturers, processors, distributors, co-packers, restaurants, importers, and retailers can fund ERP integration, GS1 identifiers, mobile receiving, supplier portals, transformation-event capture, master-data cleansing, cold-chain data, and digital recall workflows; a mid-sized processor moving 10,000–50,000 lots yearly may need to capture 15–40 data fields per lot across receiving, transformation, shipping, and return events, creating 150,000–2 million annual traceability records.
A typical implementation can require USD 100,000–1.5 million for software, systems integration, labeling equipment, scanners, supplier onboarding, and training, plus USD 0.02–0.15 per case in recurring SaaS, data exchange, and support costs; however, digitization can reduce manual record-retrieval time from days to minutes and constrain recalls to specific lots instead of entire shifts or distribution weeks.
The business model is shifting from barcode hardware sales to multi-year compliance SaaS, implementation services, supplier-network subscriptions, audit evidence, and managed data operations, with vendors able to cross-sell recall simulation, quality management, temperature monitoring, and ESG reporting. Because U.S. requirements influence Canadian, Mexican, Asian, European, and Latin American exporters serving American buyers, FSMA 204 preparation is estimated to add +2.1 percentage points to food-traceability CAGR through 2026–2028.
Drivers Impact Analysis
| Driver | (~) % Impact on CAGR Forecast | Geographic Relevance | Impact Timeline |
|---|---|---|---|
| FSMA 204 preparation cycle | +2.1 pp | U.S. core, Canada, export suppliers | Short term (≤ 2 years) |
| EU seafood digital controls | +1.7 pp | EU, Norway, UK, export Asia, Africa, LATAM | Short term (≤ 2 years) |
| Recall-response automation | +1.5 pp | North America, EU, Japan, developed APAC | Medium term (2–4 years) |
| Retailer supplier-data mandates | +1.3 pp | North America, EU, China, GCC, APAC retail | Short term (≤ 2 years) |
| Connected cold-chain sensing | +1.2 pp | Global food trade corridors, MENA, ASEAN, LATAM | Medium term (2–4 years) |
| Sustainability-claim verification | +1.0 pp | EU, North America, Japan, South Korea, Australia | Long term (≥ 4 years) |
Restraint Analysis
Fragmented Supplier Digitization
Under the EU fisheries rules effective 10 January 2026, all operators handling covered fishery and aquaculture products must record batch-level traceability information digitally and make it available to downstream operators and competent authorities; required information includes a lot identifier, species, production method, origin area, condition, net weight, supplier, and recipient.
The cost asymmetry is severe: a global retailer or processor may spread a USD 1–5 million platform programme across 10–100 million cases, but a small farm, vessel, importer, packhouse, or distributor may face USD 5,000–50,000 for scanners, labels, connectivity, process mapping, training, data cleanup, and subscriptions—often more than its annual technology budget. A network with 5,000 suppliers and a 20% non-digital participation rate leaves 1,000 weak links, forcing manual exception processing, delayed onboarding, incomplete transformation records, and lower buyer confidence; even if 95% of transactions are digital, the remaining 5% can account for 20–40% of compliance exceptions because they cluster in remote, seasonal, and fragmented supply chains.
This shifts vendors toward costly assisted onboarding, offline-mobile tools, managed data capture, subsidized entry tiers, and retailer-funded networks, reducing near-term SaaS margins and elongating sales cycles by 6–18 months. Food traceability adoption therefore remains strongest among branded processors and organized retail, while smallholder and informal networks retain partial visibility. Fragmented digitization is estimated to deduct -2.0 percentage points from market CAGR through 2028 across global SMEs, export-oriented Asia, Africa, Latin America, and decentralized agricultural supply chains.
Restraint Impact Analysis
| Restraint | (\~) % Impact on CAGR Forecast | Geographic Relevance | Impact Timeline |
|---|---|---|---|
| Fragmented supplier digitization | -2.0 pp | Global SMEs, export Asia, Africa, LATAM | Medium term (2–4 years) |
| Integration-cost burden | -1.6 pp | North America, EU, APAC manufacturing hubs | Short term (≤ 2 years) |
| Regulatory timing uncertainty | -1.4 pp | U.S. core, Canada, export suppliers | Short term (≤ 2 years) |
| Data-interoperability gaps | -1.2 pp | Cross-border corridors, EU, U.S., APAC | Medium term (2–4 years) |
| Cybersecurity liability exposure | -1.0 pp | North America, EU, global brand networks | Medium term (2–4 years) |
| Low-value food exclusions | -0.8 pp | U.S. farms, informal markets, emerging economies | Long term (≥ 4 years) |
Opportunity Analysis
Traceability-as-a-Service
Traceability-as-a-service is a future monetization opportunity—not a current regulatory driver—because most food businesses still purchase fragmented software modules, labels, scanners, or compliance projects, whereas a managed platform can sell a recurring outcome: verified lot genealogy, supplier onboarding, critical-event capture, electronic records, recall readiness, audit evidence, and 24-hour regulatory response. FDA’s Food Traceability Rule requires covered firms to retain records generally for 2 years and, when requested, provide required information and an electronic sortable spreadsheet within 24 hours; FDA will not enforce the rule before 20 July 2028, creating a defined window to standardize managed-service offerings before customers face enforcement pressure.
A 20-site food manufacturer moving 10,000–100,000 lots yearly can spend USD 0.3–2.0 million on a conventional multi-system implementation, while a managed subscription priced at USD 3,000–25,000 per site monthly plus USD 0.01–0.05 per traceability event reduces upfront capital, bundles support, and creates a 3–5-year recurring contract; at 50–100 enterprise customers, annual recurring revenue can reach USD 10–50 million with gross margins potentially 15–25 percentage points above custom integration services.
The value creation is generated by converting a one-off compliance capex into operating expenditure, centralizing master-data maintenance, lowering client implementation time from an estimated 9–18 months to 3–6 months through pre-built connectors, and reducing customer procurement events by 50–75%. Vendors can layer in supplier help desks, digital mock recalls, document retention, compliance certificates, data-quality remediation, and 24/7 outbreak support, thereby increasing revenue per customer 25–60% beyond basic SaaS.
Opportunity Impact Analysis
| Opportunity | (\~) % Potential CAGR Upside | Geographic Relevance | Execution Window |
|---|---|---|---|
| Traceability-as-a-service | +2.0 pp | North America, EU, developed APAC | Short term (≤ 2 years) |
| Recall-risk intelligence | +1.7 pp | U.S., EU, Japan, South Korea, Australia | Medium term (2–4 years) |
| SME supplier-network hubs | +1.5 pp | Export Asia, Africa, LATAM, India, ASEAN | Short term (≤ 2 years) |
| Cold-chain claims platforms | +1.3 pp | Global trade lanes, MENA, ASEAN, LATAM | Medium term (2–4 years) |
| ESG proof-data monetization | +1.2 pp | EU, North America, Japan, Australia | Long term (≥ 4 years) |
| Traceability software roll-ups | +1.0 pp | North America, EU, India, ASEAN, LATAM | Medium term (2–4 years) |
Challenges Analysis
Multi-Tier Data Capture
FDA’s traceability architecture depends on Key Data Elements connected to Critical Tracking Events and provides an electronic sortable spreadsheet template organized around those event types, demonstrating that end-to-end visibility is a data-collection process rather than a single product label.
A branded food company with 1,000 tier-one suppliers may ultimately depend on 5,000–20,000 farms, ingredient sources, logistics providers, and processors; if only 90% transmit structured events, the remaining 10% can generate most exception handling because they cluster in seasonal, remote, mixed-lot, and informal supply chains. A 20,000-lot monthly operation with a 3% incomplete-event rate creates 600 unresolved records, and resolving each in 15–45 minutes at USD 20–50 per loaded labour hour adds roughly USD 3,000–22,500 monthly before delayed shipments, manual certificates, audit findings, or recall exposure.
Providers and anchor buyers need offline-first mobile tools, QR or barcode kits, SMS-capable workflows, assisted supplier onboarding, cooperative licenses, minimum viable data schemas, training in local languages, and financial incentives tied to faster payment, premium contracts, or reduced inspections. This multi-tier participation deficit is estimated to impose a -1.4-percentage-point long-term CAGR friction across global food chains, export Asia, Africa, Latin America, India, and fragmented agricultural supply networks.
Challenges Impact Analysis
| Challenge | (\~) % CAGR Friction Drag | Geographic Relevance | Mitigation Horizon |
|---|---|---|---|
| Multi-tier data capture | -1.4 pp | Global food chains, export Asia, LATAM, Africa | Long term (≥ 4 years) |
| Master-data normalization | -1.2 pp | North America, EU, APAC trade corridors | Medium term (2–4 years) |
| Transformation-event reconciliation | -1.1 pp | Processing hubs, EU, U.S., China, ASEAN | Medium term (2–4 years) |
| Cybersecurity supply-chain exposure | -1.0 pp | North America, EU, developed APAC | Long term (≥ 4 years) |
| Sensor-data quality drift | -0.9 pp | Cold-chain corridors, MENA, LATAM, ASEAN | Medium term (2–4 years) |
| Regulatory schema volatility | -0.8 pp | U.S., EU, Canada, global exporters | Medium term (2–4 years) |
Geopolitical Impact Analysis
Ongoing Wars Increase the Need for Stronger Food Traceability
The ongoing Russia-Ukraine war and conflict-related disruption around major shipping routes are increasing the importance of food traceability across global supply chains. Food products are being redirected through alternative ports, road corridors, rail networks, and storage locations, creating more handover points where origin, batch, shipment, and supplier information must remain accurate. In July 2026, the European Commission reported that about 20% of Ukraine’s grain, oilseed, and related-product exports moved through EU-Ukraine Solidarity Lanes, while about 80% moved through the Black Sea. Since May 2022, these alternative routes have handled around 103 million tonnes of Ukrainian agricultural products.
Such rerouting raises demand for digital records, barcode and RFID identification, and interoperable traceability systems that can follow food across borders. War-related energy and fertilizer disruptions also add pressure. UNCTAD reported in 2026 that shipping transits through the Strait of Hormuz fell by more than 95% during conflict-related disruption, affecting transport and agricultural input flows. For food manufacturers and distributors, stronger traceability helps verify product origin, manage supplier changes, support customs checks, and improve recall response when normal trade routes are disrupted.
Regional Insights
North America Leads Food Traceability with 35.90% Share, While Asia Pacific Expands Through Stronger Safety Controls
In 2025, North America held a dominant market position, capturing more than a 35.90% share and reaching USD 10.3 billion in the Food Traceability Market. The region benefits from advanced food-processing infrastructure, widespread barcode and digital record systems, and strong regulatory oversight in the United States and Canada. The U.S. FDA Food Traceability Rule requires covered businesses to maintain Key Data Elements connected with Critical Tracking Events and provide requested records within 24 hours.
Its original compliance date was January 20, 2026, while enforcement has been deferred until July 20, 2028. Canada also strengthens regional adoption through the Safe Food for Canadians Regulations. CFIA requires applicable companies to trace products one step backward and one step forward, maintain records for 2 years, and provide requested traceability documents within 24 hours.
Asia Pacific is developing as a fast-growing regional market as governments strengthen food identification, recall preparedness, and supply-chain recordkeeping. Australia and New Zealand provide a clear example of this shift. Food Standards Australia New Zealand requires manufacturers, wholesalers, and food importers to maintain recall systems and recommends traceability records covering suppliers, customers, transaction dates, batch or lot identifiers, and product quantities.
Updated horticulture requirements also require producers and processors of berries, leafy vegetables, and melons to maintain systems identifying where produce was received from and where it was supplied. Growing cross-border food trade, expanding processing capacity, and increasing use of QR codes, RFID, cloud platforms, and digital product records are supporting wider traceability adoption across the region.
Key Regions and Countries Insights
- North America
- US
- Canada
- Europe
- Germany
- France
- The UK
- Spain
- Italy
- Rest of Europe
- Asia Pacific
- China
- Japan
- South Korea
- India
- Australia
- Rest of APAC
- Latin America
- Brazil
- Mexico
- Rest of Latin America
- Middle East & Africa
- GCC
- South Africa
- Rest of MEA
Key Players Analysis
IBM Corporation maintains a strong role in food traceability through IBM Food Trust, a SaaS platform built on blockchain technology that allows growers, processors, distributors, manufacturers, and retailers to share trusted supply-chain data. IBM reported USD 67.5 billion in revenue during 2025, while software represented about 45% of total revenue. Its Food Trust solution has supported traceability for around 4 million olive-oil bottles annually in a Deoleo implementation spanning 3 markets, demonstrating practical use of blockchain-based product identification and provenance tracking.
Honeywell International Inc. supports food traceability through barcode scanners, mobile computers, automation software, and data-capture systems used across manufacturing, warehousing, and distribution. The company generated USD 37.442 billion in revenue during 2025. In March 2025, Honeywell partnered with Corvus Robotics to integrate SwiftDecoder barcode software into autonomous inventory drones for case- and pallet-level tracking. Its Productivity Solutions and Services business, which included barcode scanners and mobile computers, generated more than USD 1 billion in 2024, highlighting its scale in identification technologies.
Zebra Technologies Corporation is an important food-traceability technology provider through barcode scanning, RFID readers, mobile computing, thermal printing, and machine-vision systems. In 2025, Zebra generated about USD 5.4 billion in revenue and invested USD 593 million, or roughly 11% of sales, in research and development. The company operates with around 10,700 employees across 57 countries and more than 10,000 channel partners in about 179 countries, supporting large-scale deployment of identification, inventory visibility, and traceability technologies across food processing and logistics networks.
Top Key Players Outlook
- IBM Corporation
- Honeywell International Inc.
- Zebra Technologies Corporation
- SGS SA
- OPTEL Group
- Cognex Corporation
- Oracle Corporation
- Avery Dennison Corporation
- C.H. Robinson Worldwide, Inc.
- Antares Vision Group / rfxcel
- Trustwell / FoodLogiQ
- TE-FOOD International GmbH
- Trace One
- Bio-Rad Laboratories, Inc.
- Intertek Group plc
Recent Developments
- Oracle’s blockchain platform also supports FDA food-traceability requirements by recording Key Data Elements across Critical Tracking Events. The company generated USD 67.4 billion in FY2026 revenue, including USD 34.0 billion from cloud services, while its broader expansion program raised USD 43 billion in debt and USD 5 billion in equity during FY2026.
- In September 2026, Cognex agreed to acquire RealSense for about USD 500 million, adding advanced 3D vision and robotic perception capabilities; RealSense was expected to generate USD 80–90 million in 2026 revenue.
Report Scope
| Report Features | Description |
|---|---|
| Market Value (2025) | USD 28.8 Bn |
| Forecast Revenue (2035) | USD 59.5 Bn |
| CAGR (2026-2035) | 7.5% |
| Base Year for Estimation | 2025 |
| Historic Period | 2020-2024 |
| Forecast Period | 2026-2035 |
| Report Coverage | Revenue Forecast, Market Dynamics, Competitive Landscape, Recent Developments |
| Segments Covered | By Technology (Barcode, RFID/RTLS, Global Positioning System, Infrared, Biometrics, Near-field communication, Blockchain), By Equipment (2D and 1D scanners, Tags and labels, Thermal printers, Sensors, PDA with GPS, Others), By Component (Hardware, Software, Services), By Application (Meat and livestock, Fresh produce and seeds, Dairy products, Beverages, Fisheries, Grains and cereals, Others), By End User (Food manufacturers, Warehouses and pack farms, Transportation and logistics providers, Food retailers, Government departments, Others) |
| Regional Analysis | North America – US, Canada; Europe – Germany, France, The UK, Spain, Italy, Rest of Europe; Asia Pacific – China, Japan, South Korea, India, Australia, Singapore, Rest of APAC; Latin America – Brazil, Mexico, Rest of Latin America; Middle East & Africa – GCC, South Africa, Rest of MEA |
| Competitive Landscape | IBM Corporation, Honeywell International Inc., Zebra Technologies Corporation, SGS SA, OPTEL Group, Cognex Corporation, Oracle Corporation, Avery Dennison Corporation, C.H. Robinson Worldwide, Inc., Antares Vision Group / rfxcel, Trustwell / FoodLogiQ, TE-FOOD International GmbH, Trace One, Bio-Rad Laboratories, Inc., Intertek Group plc |
| Customization Scope | Customization for segments, region/country-level will be provided. Moreover, additional customization can be done based on the requirements. |
| Purchase Options | We have three licenses to opt for: Single User License, Multi-User License (Up to 5 Users), Corporate Use License (Unlimited User and Printable PDF) |





































