


Report Overview
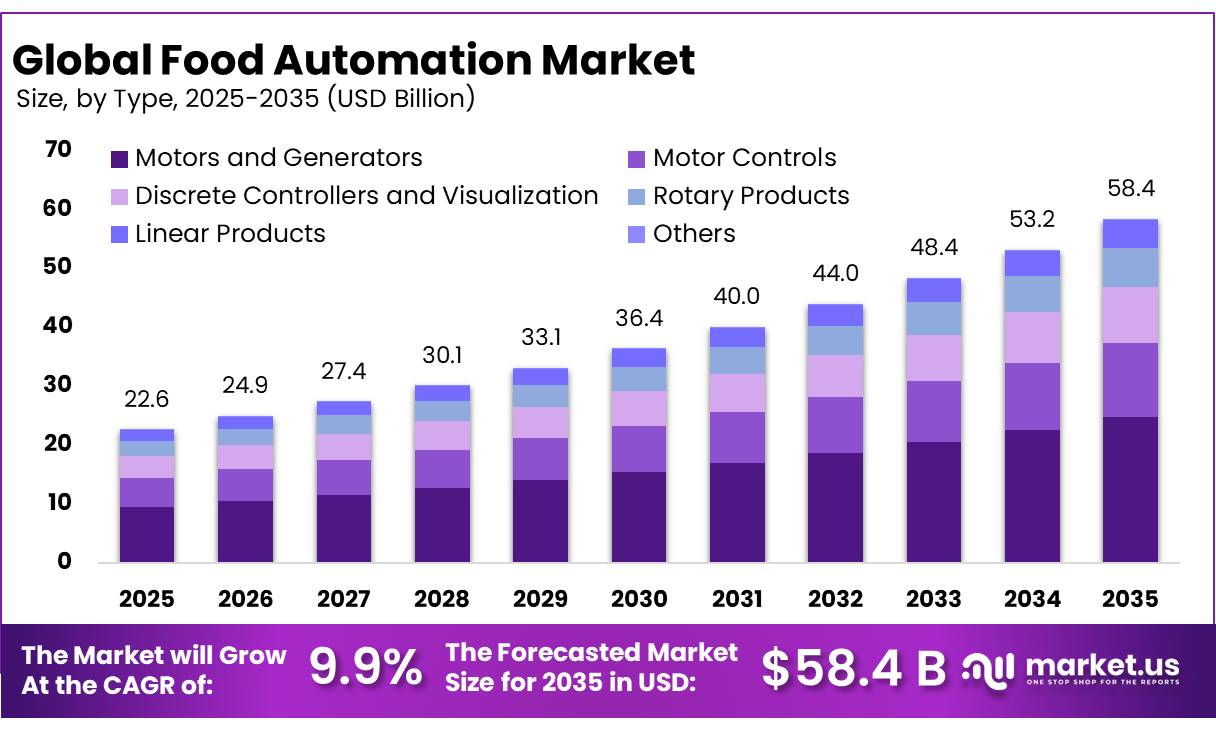
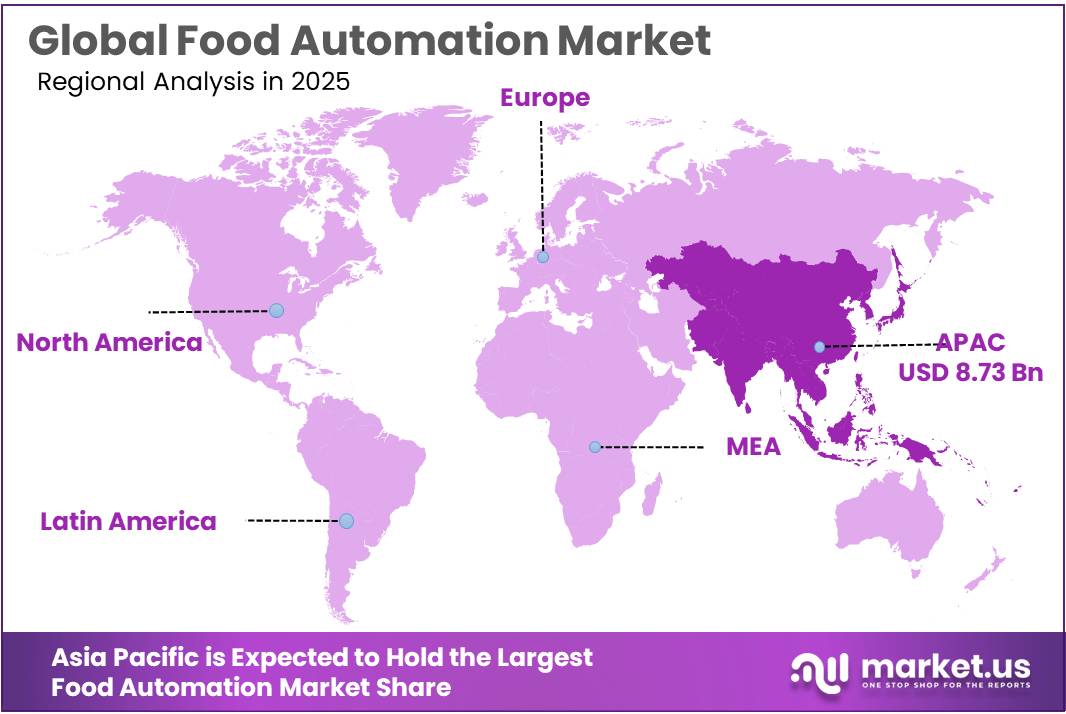
The Global Food Automation Market size is expected to be worth around USD 58.4 Billion by 2035, from USD 22.6 Billion in 2025, growing at a CAGR of 9.9% during the forecast period from 2026 to 2035. In 2025, Asia Pacific held a dominant market position, capturing more than a 38.64% share, holding USD 8.73 Billion revenue.
The Food Automation industry is becoming an important part of modern food manufacturing as processors use robots, sensors, machine vision, automated packaging, digital traceability, and artificial intelligence to improve production speed and food safety. Automation is increasingly used in processing, sorting, filling, palletizing, inspection, and warehouse operations.
- The International Federation of Robotics (IFR) reported in 2026 that U.S. industrial robot installations reached 38,000 units in 2025, an increase of 11% from the previous year. Food-industry robot adoption alone increased by 30%, reaching around 3,000 installations.
The industrial environment also provides a large base for automation investment. According to FoodDrinkEurope, the EU food and drink industry generated around EUR 1.5 trillion in turnover and EUR 300 billion in value added in its 2026 industry assessment. The sector employed approximately 4.8 million people and included around 310,000 enterprises, of which 99% were SMEs. This large and fragmented manufacturing base creates opportunities for scalable automation systems that can be introduced gradually across processing lines, packaging facilities, and distribution operations.
- Robotics is one of the strongest drivers of food automation. IFR’s World Robotics 2025 report recorded 542,076 industrial robots installed globally in 2024, while the worldwide operational robot stock reached approximately 4.664 million units, up 9% year over year. Food and beverage manufacturing accounted for about 4% of global industrial robot installations. These figures show that automation is moving beyond automotive and electronics into industries where repetitive handling, hygiene, labor availability, and production consistency are major concerns.
Food safety and traceability requirements are creating another strong automation driver. The U.S. FDA Food Traceability Rule requires covered businesses handling listed foods to maintain Key Data Elements linked to Critical Tracking Events and, when requested, provide relevant information to FDA within 24 hours. Enforcement is currently directed not to begin before July 20, 2028. These requirements encourage investment in automated identification, barcode systems, digital production records, warehouse tracking, and connected quality-control systems.
Future growth opportunities are expected around AI-based inspection, collaborative robots, autonomous material movement, predictive maintenance, smart packaging lines, and digitally connected factories. A 2025 European Commission Joint Research Centre assessment identified labor shortages, regulatory requirements, food quality, and production efficiency as major reasons for adopting robotics and AI across food processing, packaging, distribution, and service operations.
Key Takeaways
- Food Automation Market size is expected to be worth around USD 58.4 Billion by 2035, from USD 22.6 Billion in 2025, growing at a CAGR of 9.9%.
- Motor Controls held a dominant market position, capturing more than a 33.20% share.
- Fully Automatic held a dominant market position, capturing more than a 61.20% share.
- Processing held a dominant market position, capturing more than a 28.40% share.
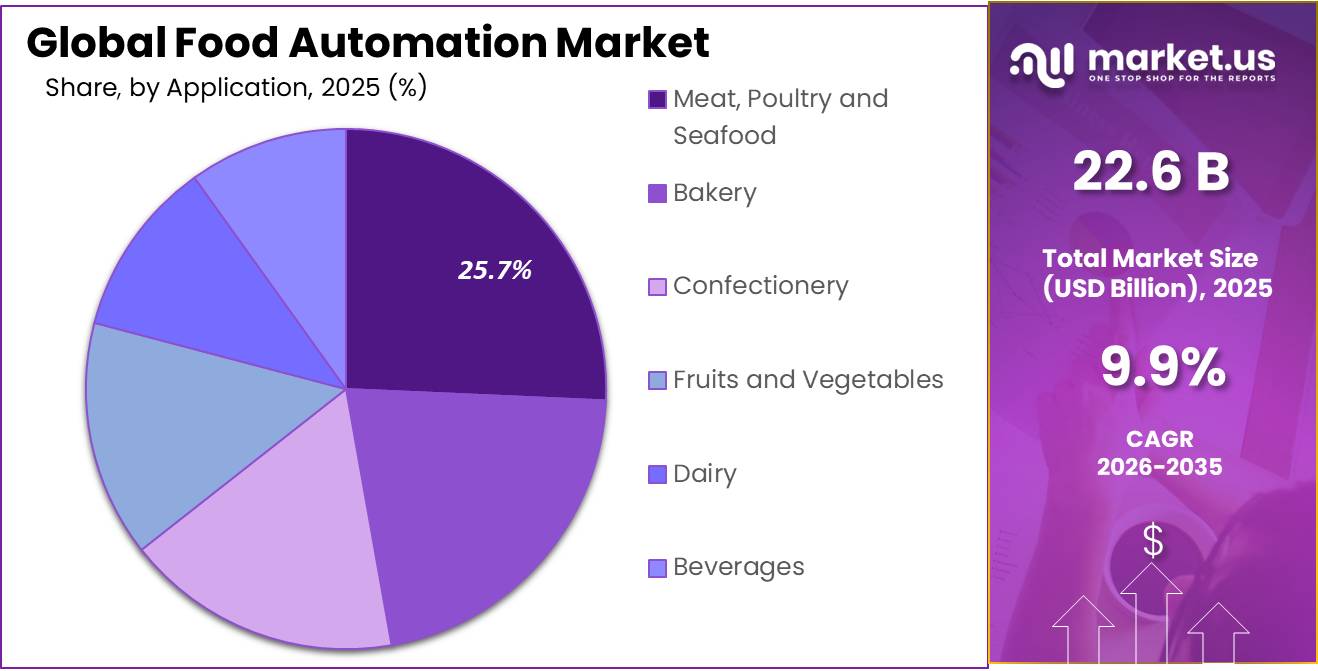
- Poultry and Seafood held a dominant market position, capturing more than a 25.00% share.
- Asia Pacific held a dominant market position in 2025, capturing more than a 38.64% share and reaching USD 8.73 billion.
By Type Analysis
Motor Controls Lead the Food Automation Market with 33.20% Share as Processors Focus on Precise and Energy-Efficient Operations
In 2025, Motor Controls held a dominant market position, capturing more than a 33.20% share of the Food Automation Market by type. Motor controls are widely used across conveyors, mixers, pumps, compressors, refrigeration systems, filling lines, and packaging equipment because they allow processors to regulate speed, torque, and energy use according to production requirements. Variable-frequency drives are particularly valuable in automated plants where processing loads change throughout the day.
- The U.S. Department of Energy reports that electric motors used in pumps, conveyors, compressors, fans, mixers, grinders, and other processing equipment account for about 54% of electricity consumption in U.S. manufacturing. Better motor controls can therefore offer meaningful efficiency improvements across automated food plants.
Motors and Generators remain an important segment of the Food Automation Market because electric motors provide the mechanical power required by conveyors, pumps, mixers, grinders, compressors, refrigeration equipment, and automated packaging lines. Food plants depend on these systems for continuous processing, controlled material movement, temperature management, and high-speed production, making reliable motor systems essential to overall automation performance.
Government data demonstrates the scale of motor use across manufacturing facilities. The U.S. Department of Energy states that electric motors represent the single largest end use of electricity in the United States, while motor-driven machine systems account for about 54% of industrial electricity consumption in manufacturing. This reflects the central role of motors in automated processing and handling operations.
By Operation Analysis
Fully Automatic Systems Lead the Food Automation Market with 61.20% Share as Processors Push for Higher Throughput and Consistency
In 2025, Fully Automatic held a dominant market position, capturing more than a 61.20% share of the Food Automation Market by operation. Fully automatic systems are increasingly used for processing, filling, sorting, inspection, packaging, palletizing, and material handling because they reduce manual intervention and support consistent production. Their value is especially strong in high-volume food plants where hygiene, repeatability, and operating speed are critical.
Automation adoption is also visible in robotics data. The International Federation of Robotics reported that U.S. industrial robot installations reached about 38,000 units in 2025, up 11% year over year. Food-industry robot adoption increased by 30%, reaching around 3,000 installations during the year. This rise shows how food processors are moving toward more automated production environments.
Semi-Automatic systems remain an important part of the Food Automation Market because they combine machine assistance with human control. These systems are widely suited to smaller plants, specialty food producers, batch-processing operations, and facilities that need flexibility across different product formats. Semi-automatic equipment can support filling, cutting, mixing, sealing, inspection, and packaging while allowing operators to manage product changes and quality checks directly.
The segment benefits from continued industrial automation growth without requiring plants to shift immediately to fully automated production. IFR reported that 542,000 industrial robots were installed worldwide in 2024, while the total operational stock reached 4.664 million units, up 9% from the previous year. The same report noted that Asia accounted for 74% of new installations, Europe for 16%, and the Americas for 9%, showing that automation is spreading across manufacturing regions at different speeds.
By Function Analysis
Processing Leads the Food Automation Market with 28.40% Share as Food Plants Increase Automated Production
In 2025, Processing held a dominant market position, capturing more than a 28.40% share of the Food Automation Market by function. Processing automation is widely used in mixing, cutting, grinding, cooking, conveying, sorting, and quality-control operations because food manufacturers need consistent output, hygiene, and higher production speed. Automated processing also helps plants control repetitive tasks while reducing variability between batches.
The scale of food manufacturing supports continued automation investment. According to the USDA Economic Research Service, food and beverage manufacturing accounted for 16.8% of total U.S. manufacturing sales and 15.4% of manufacturing employment in its latest industry assessment. Food processors depend heavily on machinery, energy, labor, and technical systems, creating a broad operating base for automated processing equipment.
Packaging and Repackaging represent an important function within the Food Automation Market because packaged foods require accurate filling, sealing, labeling, coding, inspection, case packing, and palletizing. Automation helps processors maintain package consistency while handling larger production volumes and reducing manual contact with food products. It is also becoming more closely connected with digital traceability and product identification systems.
Regulatory requirements are reinforcing this trend. In February 2026, the U.S. FDA confirmed that businesses covered by the Food Traceability Rule must maintain additional records for foods that are manufactured, processed, packed, or held. The rule covers Critical Tracking Events such as initial packing, shipping, receiving, and transforming, increasing the importance of automated coding, labeling, scanning, and data-capture systems.
By Application Analysis
Poultry and Seafood Lead the Food Automation Market with 25.00% Share as High-Volume Processing Requires Speed and Hygiene
In 2025, Poultry and Seafood held a dominant market position, capturing more than a 25.00% share of the Food Automation Market by application. Automation is widely used across cutting, deboning, portioning, sorting, weighing, inspection, packaging, and cold-chain handling because these products require fast processing and strict hygiene control. Automated systems also help processors maintain consistent output while reducing direct product handling.
The scale of poultry production creates a strong operating base for automation. According to the USDA Economic Research Service, total U.S. poultry-sector sales reached USD 81.7 billion in 2025, up from USD 70.3 billion in 2024. Broilers alone generated USD 44.6 billion, while turkey production was valued at USD 5.6 billion. These high production values support investment in automated processing, conveying, inspection, packaging, and palletizing equipment across large food plants.
Dairy remains an important application segment of the Food Automation Market because milk and dairy products require continuous handling, pasteurization, separation, filling, cleaning, inspection, refrigeration, and packaging. Automated systems help processors maintain temperature control, product consistency, sanitation, and throughput across high-volume production lines.
USDA reported that U.S. milk production exceeded 231 billion pounds in 2025, while the national dairy herd reached about 9.49 million cows. Average milk output reached roughly 24,391 pounds per cow, and total milk production increased 2.8% from the previous year.
Key Market Segments
By Type
- Motors and Generators
- Motor Controls
- Discrete Controllers and Visualization
- Rotary Products
- Linear Products
- Others
By Operation
- Semi-Automatic
- Fully Automatic
By Function
- Processing
- Packaging and Repackaging
- Palletizing
- Sorting and Grading
- Picking and Placing
- Others
By Application
- Dairy
- Bakery
- Confectionery
- Fruits and Vegetables
- Meat, Poultry and Seafood
- Beverages
Driver Analysis
Labor scarcity and wage inflation in food plants
Persistent staffing gaps in production, packing, sanitation, and maintenance are forcing processors to replace manual tasks with conveyors, pick-and-place robots, automated palletizing, and smart packaging lines, and the economics are increasingly favorable where turnover is high and labor costs are rising faster than output gains.
In practice, automation can remove 2 to 4 operators per line, cut repetitive-task dependence by 20% to 40%, and reduce line-stop losses that often exceed 3% to 5% of weekly throughput in labor-constrained plants. The effect is strongest in North America, Western Europe, Japan, and South Korea, where chronic workforce shortages and higher average hourly wages push payback periods toward 18 to 36 months for mid-scale deployments.
Drivers Impact Analysis
| Driver | (\~) % Impact on CAGR Forecast | Geographic Relevance | Impact Timeline |
|---|---|---|---|
| Labor scarcity and wage inflation in food plants | +2.4% | North America core, EU manufacturing belts, Japan, South Korea | Short term (≤ 2 years) |
| Food safety compliance and traceability requirements | +2.0% | EU, North America core, APAC export corridors | Short term (≤ 2 years) |
| Shift to flexible, small-batch production | +1.8% | North America core, EU, APAC urban demand centers | Medium term (2-4 years) |
| Rising adoption of AI vision and machine learning | +1.6% | North America core, EU, China, India | Medium term (2-4 years) |
| Energy efficiency and OEE optimization pressure | +1.4% | EU, North America core, GCC, APAC industrial hubs | Short term (≤ 2 years) |
| E-commerce and ready-to-eat processing expansion | +1.7% | North America core, EU, China, Southeast Asia | Medium term (2-4 years) |
Restraint Analysis
High Initial CapEx and Weak ROI
The principal commercial restraint is the mismatch between the large, front-loaded cost of food-grade automation and the uneven cash-generation profile of processors, particularly small and medium enterprises operating low-margin bakery, dairy, meat, frozen-food, fresh-produce, and contract-manufacturing lines. A single integrated robotic cell comprising hygienic articulated or delta robots, vision inspection, conveyors, guarding, end-effectors, PLC/servo controls, washdown-rated enclosures, installation, validation, and line commissioning can require approximately USD 0.5–2.5 million, while full greenfield high-speed packaging or protein-processing automation programs can absorb USD 10–50 million before working-capital effects.
The equipment invoice often represents only 55–70% of project cost: systems integration, utility upgrades, floor reinforcement, sanitation redesign, cybersecurity hardening, recipe migration, production trials, and operator training can add a further 30–45%, materially extending a nominal three-year equipment payback toward five to seven years. This is especially problematic where annual plant EBITDA margins remain in the mid-single to low-double digits and food manufacturers must concurrently fund refrigeration, traceability, reformulation, packaging conversion, sustainability compliance, and capacity expansion.
Although nearly half of capital spending reported by food-and-beverage manufacturers has been directed toward automation-oriented projects, this concentration itself creates capital-rationing risk: enterprises favor high-certainty replacements and defer broader, networked deployments when savings depend on difficult-to-measure yield improvements, lower giveaway, reduced recalls, or labor avoidance rather than direct headcount elimination. The resulting outcome is a bifurcated market in which multinational processors finance multi-line digital factories, while mid-tier processors buy standalone checkweighers, metal detectors, vision systems, and semi-automatic modules, reducing system-level addressable revenue and exerting an estimated 2.1-percentage-point drag on the unconstrained 2026–2030 growth trajectory.
Restraint Impact Analysis
| Restraint | (\~) % Impact on CAGR Forecast | Geographic Relevance | Impact Timeline |
|---|---|---|---|
| High initial CapEx and weak ROI | -2.1 pp | APAC emerging, LATAM, MEA, SME-heavy EU | Medium term (2–4 years) |
| Tariffs and component-cost inflation | -1.4 pp | North America, EU, China-linked APAC | Short term (≤ 2 years) |
| Legacy-plant integration complexity | -1.8 pp | North America core, Western Europe, Japan | Medium term (2–4 years) |
| Food-grade skills shortage | -1.3 pp | North America, EU, Japan, Australia | Medium term (2–4 years) |
| Hygiene validation and compliance friction | -1.0 pp | EU, North America, Japan, China | Long term (≥ 4 years) |
| Cybersecurity and data-interoperability risk | -0.9 pp | North America, EU, advanced APAC | Long term (≥ 4 years) |
Opportunity Analysis
Traceability-as-a-Service Platforms
The U.S. FDA Food Traceability Rule originally set a January 20, 2026 compliance date, but the statutory enforcement timeline was extended to July 20, 2028, creating a roughly 22-month commercialization window for vendors to position compliance systems as operating infrastructure rather than a last-minute software purchase.
The monetization potential is substantial: instead of realizing a one-time USD 100,000–500,000 systems-integration sale, automation suppliers can package RFID/QR capture, machine vision, batch genealogy, temperature logging, supplier onboarding, cloud storage, recall workflow, and reporting into annual subscriptions of roughly USD 25,000–250,000 per plant, with enterprise network contracts reaching USD 1–5 million over five years.
For processors handling high-risk fresh produce, seafood, dairy, ready-to-eat foods, and imported ingredients, automated capture of critical tracking events can reduce manual reconciliation labor by an estimated 40–70%, compress mock-recall investigation from days to hours, and convert traceability from an audit cost into a lower-loss and lower-insurance-risk proposition.
The strategic upside resides in vendor-controlled recurring revenue, cross-selling into quality and manufacturing-execution software, and higher customer switching costs once supplier data and historical lot genealogy are embedded, supporting a modeled 2.0-percentage-point CAGR upside across North America, the EU, Japan, and Australia if providers execute before compliance urgency accelerates in 2027–2028.
Opportunity Impact Analysis
| Opportunity | (\~) % Potential CAGR Upside | Geographic Relevance | Execution Window |
|---|---|---|---|
| Traceability-as-a-service platforms | +2.0 pp | North America core, EU, Japan, Australia | Short term (≤ 2 years) |
| Robotics for fresh and variable foods | +1.8 pp | North America, EU, China, Japan, APAC emerging | Medium term (2–4 years) |
| Automation-as-a-service financing | +1.6 pp | North America, EU, India, Brazil, Southeast Asia | Short term (≤ 2 years) |
| Brownfield digital-twin retrofits | +1.5 pp | North America core, Western Europe, Japan | Medium term (2–4 years) |
| SME modular automation roll-up | +1.4 pp | India, Southeast Asia, LATAM, Eastern Europe | Medium term (2–4 years) |
| Waste-to-value autonomous lines | +1.2 pp | EU, North America, China, Gulf markets | Long term (≥ 4 years) |
Challenges Analysis
Controls Talent Pipeline Gap
The food automation market’s most persistent operating challenge is the mismatch between the expanding installed base of robots, machine vision, PLCs, motion controls, industrial networks, and AI-enabled quality systems and the limited supply of technicians capable of commissioning, maintaining, validating, programming, and optimizing these assets in food-grade environments. This is not an immediate restraint because projects continue to be funded and equipment continues to ship; however, the shortage reduces realized system utilization, extends project ramp-up, increases service dependence, and delays follow-on orders after installation.
U.S. manufacturing alone could require 3.8 million additional workers by 2033, with as many as 1.9 million roles potentially unfilled, while demand for simulation- and software-linked capabilities has risen by roughly 75% over five years, creating direct competition between food processors and higher-paying sectors such as pharmaceuticals, semiconductors, logistics, aerospace, and general industrial automation. In food manufacturing, the workforce challenge is amplified by shift work, cold-room operations, washdown exposure, seasonal production cycles, and an aging maintenance base; one 2026 industry assessment identifies an average skilled-maintenance-technician age of 56, while another indicates that technical roles can remain open for more than 180 days and that some plants operate with 30–40% fewer technicians than historical staffing norms.
The operational penalty appears in longer mean-time-to-repair, reduced preventive-maintenance compliance, deferred software updates, higher integrator labor charges, and lower OEE during early deployment, with reported repair times rising from approximately 49 minutes to 81 minutes in skills-constrained maintenance environments. Suppliers must therefore convert training from a post-sale add-on into a core product layer through remote support, standardized programming libraries, low-code HMI workflows, simulation-led commissioning, certified local service partners, and six- to twelve-month plant-specific upskilling programs; without this shift, the market can grow in equipment value while underperforming in realized productivity, sustaining an estimated 1.4-percentage-point long-term CAGR friction drag.
Challenges Impact Analysis
| Challenge | (\~) % CAGR Friction Drag | Geographic Relevance | Mitigation Horizon |
|---|---|---|---|
| Controls talent pipeline gap | -1.4 pp | North America, EU, Japan, Australia | Long term (≥ 4 years) |
| Multi-tier component volatility | -1.1 pp | North America, EU, China-linked APAC | Medium term (2–4 years) |
| Variable-product robotic handling | -1.3 pp | North America, EU, China, Japan | Long term (≥ 4 years) |
| Fragmented plant-data architecture | -1.2 pp | North America core, Western Europe, Japan | Medium term (2–4 years) |
| OT cyber-resilience burden | -0.9 pp | North America, EU regulatory hubs, advanced APAC | Long term (≥ 4 years) |
| Validation-heavy scaling cycles | -0.8 pp | EU, North America, Japan, China | Medium term (2–4 years) |
Geopolitical Impact Analysis
The ongoing Russia–Ukraine war and the 2026 Middle East conflict are affecting the Food Automation Market through higher energy costs, disrupted logistics, raw-material uncertainty, and pressure on food processors to maintain stable production. Automated processing, packaging, inspection, and material-handling systems can reduce labor dependence and improve efficiency, but rising electricity, transport, and equipment costs can delay new automation investments.
The European Commission reported that EU energy inflation was expected to rise above 11% in the second quarter of 2026 and remain above 10% for the rest of 2026. Agriculture, distribution, and transport were identified among the first sectors affected. Higher energy prices directly increase operating costs for automated food plants using refrigeration, motors, conveyors, pumps, and high-speed packaging systems.
Regional Insights
Asia Pacific at 35.60% and USD 10.46 billion exactly.
Asia Pacific held a dominant market position in 2025, capturing more than a 38.64% share and reaching USD 8.73 billion. The region benefits from strong manufacturing capacity and extensive investment in factory automation. IFR reported that China installed 354,000 industrial robots in 2025, an increase of 20%, accounting for 59% of worldwide installations. Japan added 36,219 robots, while South Korea installed approximately 30,000 units. These large automation bases support wider deployment of robotic handling, processing, packaging, palletizing, and inspection technologies within food manufacturing facilities across the region.
The Food Automation Market shows strong regional development as processors invest in robotics, digital control, automated packaging, inspection, and material-handling systems. Asia Pacific remains the dominant regional market, supported by its large manufacturing base and rapid adoption of industrial automation. North America is developing as the fastest-growing regional segment, driven by rising robot installations, labor-saving technologies, and modernization of food plants. Globally, automation is becoming more important as manufacturers seek higher output, better product consistency, lower manual handling, and improved food safety. The International Federation of Robotics reported more than 600,000 industrial robot installations worldwide in 2025.
North America is emerging as the fastest-growing regional segment, supported by accelerating automation investment in food production. In the United States, industrial robot installations increased 11% in 2025 to 38,000 units. More importantly for food automation, robot installations within the U.S. food industry increased 30%, reaching approximately 3,000 units during the year. U.S. manufacturing also recorded a robot density of 307 industrial robots per 10,000 employees, showing an established automation infrastructure. These conditions are encouraging food processors to expand robotic packaging, material handling, inspection, palletizing, and flexible processing systems as they address labor availability, production efficiency, sanitation, and growing requirements for consistent high-volume food manufacturing.
Key Regions and Countries Insights
- North America
- US
- Canada
- Europe
- Germany
- France
- The UK
- Spain
- Italy
- Rest of Europe
- Asia Pacific
- China
- Japan
- South Korea
- India
- Australia
- Rest of APAC
- Latin America
- Brazil
- Mexico
- Rest of Latin America
- Middle East & Africa
- GCC
- South Africa
- Rest of MEA
Key Players Analysis
Deere & Company remains a major supplier of tractors, harvesters, precision agriculture systems, and connected farm machinery that can support dealer-led rental and leasing activity. In fiscal 2025, the company generated USD 45.68 billion in net sales and revenues and USD 5.03 billion in net income. Its Production & Precision Agriculture business recorded USD 4.74 billion in fourth-quarter sales, supported by large tractors, combines, planting equipment, and advanced farm technologies used across commercial farming operations.
CNH Industrial strengthens the Farm Equipment Rental Market through its Case IH, New Holland, and STEYR agricultural equipment portfolios. In 2025, the company reported USD 18.10 billion in consolidated revenues, while agricultural net sales reached USD 12.39 billion. Agriculture adjusted EBIT stood at USD 772 million, with a 6.2% adjusted EBIT margin. Its broad tractor, combine, hay, forage, and precision farming portfolio gives dealers and equipment-service providers a strong base for rental and flexible machinery-access programs.
AGCO Corporation serves the agricultural machinery sector through brands including Fendt, Massey Ferguson, PTx, and Valtra, supporting rental demand across tractors and precision equipment. In 2025, AGCO generated USD 10.08 billion in net sales and invested USD 487.7 million in research and development. The company also reported USD 740 million in free cash flow and operated through about 2,800 independent dealers and distributors across 140 countries, giving it broad access to machinery users and service networks.
Top Key Players Outlook
- ABB Ltd.
- Siemens AG
- Rockwell Automation, Inc.
- Schneider Electric SE
- Honeywell International Inc.
- Emerson Electric Co.
- Yaskawa Electric Corporation
- FANUC Corporation
- Mitsubishi Electric Corporation
- OMRON Corporation
- Krones AG
- GEA Group AG
- Tetra Pak International S.A.
- JBT Marel Corporation
- Syntegon Technology GmbH
Recent Developments
- In June 2026, Mahindra crossed cumulative production of 7 million tractors, showing the scale available to support dealers and equipment-access businesses. Mahindra also sold 526,403 tractors in FY2026, up 24.0%, while management planned 7 new product launches and 12 feature upgrades for FY2027, strengthening its future position across mechanization and rental-oriented equipment demand.
- In February 2026, CLAAS KGaA mbH production of the new AXION 9 CMATIC began at Le Mans, where CLAAS has invested more than EUR 80 million since 2003 and produced over 200,000 tractors. The company also expanded its CLAAS connect platform in July 2026 with a new Machine Sharing function for contractors and farmers, helping mixed fleets exchange machine data and track equipment more efficiently.
Report Scope
| Report Features | Description |
|---|---|
| Market Value (2025) | USD 22.6 Bn |
| Forecast Revenue (2035) | USD 58.4 Bn |
| CAGR (2026-2035) | 9.9% |
| Base Year for Estimation | 2025 |
| Historic Period | 2020-2024 |
| Forecast Period | 2026-2035 |
| Report Coverage | Revenue Forecast, Market Dynamics, Competitive Landscape, Recent Developments |
| Segments Covered | By Type (Motors and Generators, Motor Controls, Discrete Controllers and Visualization, Rotary Products, Linear Products, Others), By Operation (Semi-Automatic, Fully Automatic), By Function (Processing, Packaging and Repackaging, Palletizing, Sorting and Grading, Picking and Placing, Others), By Application (Dairy, Bakery, Confectionery, Fruits and Vegetables, Meat, Poultry and Seafood) |
| Regional Analysis | North America – US, Canada; Europe – Germany, France, The UK, Spain, Italy, Rest of Europe; Asia Pacific – China, Japan, South Korea, India, Australia, Singapore, Rest of APAC; Latin America – Brazil, Mexico, Rest of Latin America; Middle East & Africa – GCC, South Africa, Rest of MEA |
| Competitive Landscape | ABB Ltd., Siemens AG, Rockwell Automation, Inc., Schneider Electric SE, Honeywell International Inc., Emerson Electric Co., Yaskawa Electric Corporation, FANUC Corporation, Mitsubishi Electric Corporation, OMRON Corporation, Krones AG, GEA Group AG, Tetra Pak International S.A., JBT Marel Corporation, Syntegon Technology GmbH |
| Customization Scope | Customization for segments, region/country-level will be provided. Moreover, additional customization can be done based on the requirements. |
| Purchase Options | We have three licenses to opt for: Single User License, Multi-User License (Up to 5 Users), Corporate Use License (Unlimited User and Printable PDF) |





































