


Report Overview
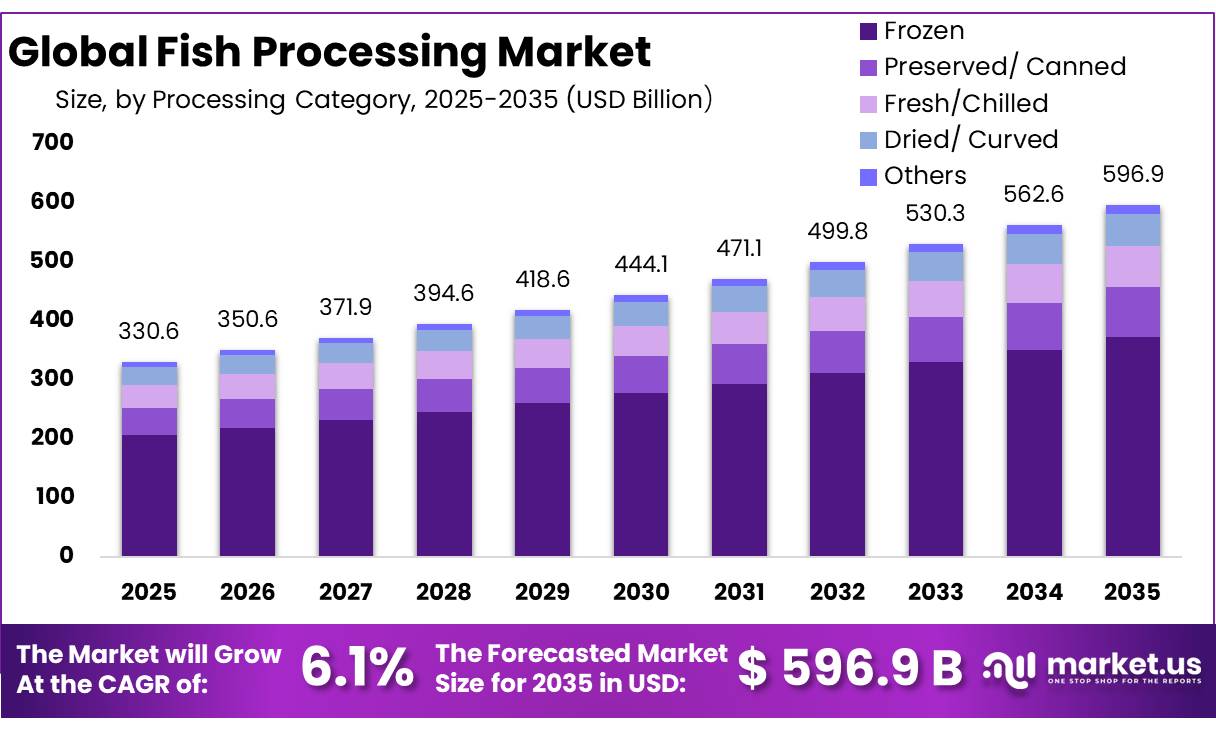
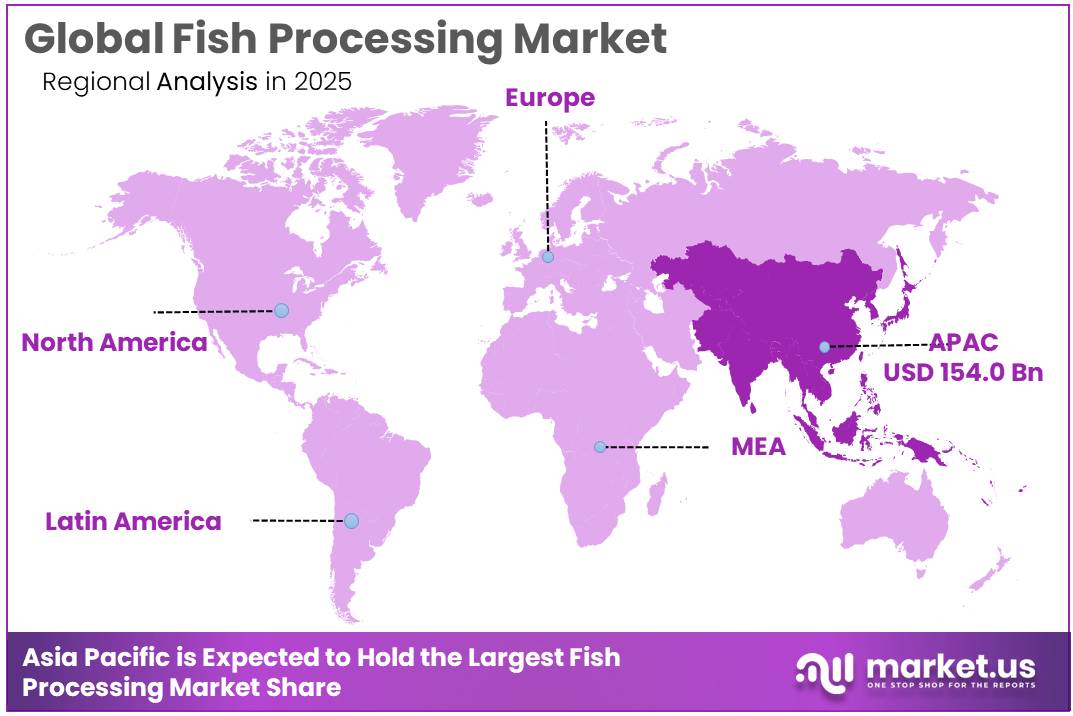
The Global Fish Processing Market size is expected to be worth around USD 596.9 Billion by 2035, from USD 330.6 Billion in 2025, growing at a CAGR of 6.1% during the forecast period from 2026 to 2035. In 2025, Asia Pacific held a dominant market position, capturing more than a 46.58% share, holding USD 154.0 Billion revenue.
The fish processing industry forms an important part of the global seafood value chain, converting fresh fish and other aquatic animals into frozen products, fillets, canned seafood, smoked products, surimi, fishmeal, fish oil, and other value-added foods. The supply base remains substantial. According to FAO, global fisheries and aquaculture production reached about 199 million tonnes in 2025, supported mainly by continued aquaculture expansion.
The industry’s operating environment is increasingly influenced by the shift from wild capture fisheries toward aquaculture. OECD-FAO projects total fisheries and aquaculture production to rise from approximately 194 million tonnes in the 2023-2025 base period to 216 million tonnes by 2035, representing growth of about 11%. Aquaculture alone is expected to reach 121 million tonnes by 2035, accounting for approximately 56% of global fisheries and aquaculture output.
Demand for processed seafood is also supported by rising food consumption. OECD-FAO expects global consumption of aquatic animal foods to increase by 12% over the coming decade and reach approximately 194 million tonnes by 2035. Average global consumption is projected to increase from 21.4 kg per person during 2023-2025 to around 21.9 kg by 2035.
Europe demonstrates the economic importance of downstream processing. European Commission data show that the EU fish-processing industry employed around 107,000 people in 2023. In 2024, approximately 3,390 companies were active in the sector and generated nearly €36 billion in net turnover. The industry’s value added reached about €6 billion in 2023, highlighting the commercial importance of converting raw seafood into higher-value consumer and industrial products.
Government programmes are also supporting modernization. The European Maritime, Fisheries and Aquaculture Fund has a €6.108 billion budget for 2021-2027, including €5.311 billion under shared management and €797 million under direct management. Its framework supports sustainable aquaculture as well as the processing, marketing, quality improvement, and value addition of fishery and aquaculture products, helping processors invest in more efficient and sustainable operations.
Future growth opportunities are likely to concentrate on waste reduction, by-product recovery, automation, energy-efficient refrigeration, traceability, and advanced packaging. FAO estimates that as much as 35% of global fisheries and aquaculture production can be lost or wasted across the value chain. Meanwhile, processing residues are expected to supply around 30% of global fishmeal production by 2035, compared with 25% in the current base period.
Key Takeaways
- Fish Processing Market size is expected to be worth around USD 596.9 Billion by 2035, from USD 330.6 Billion in 2025, growing at a CAGR of 6.1%.
- Frozen held a dominant market position, capturing more than a 62.40% share.
- Filleting held a dominant market position, capturing more than a 30.00% share of the Fish Processing Market.
- Fish held a dominant market position, capturing more than a 63.20% share.
- Food held a dominant market position, capturing more than an 83.00% share.
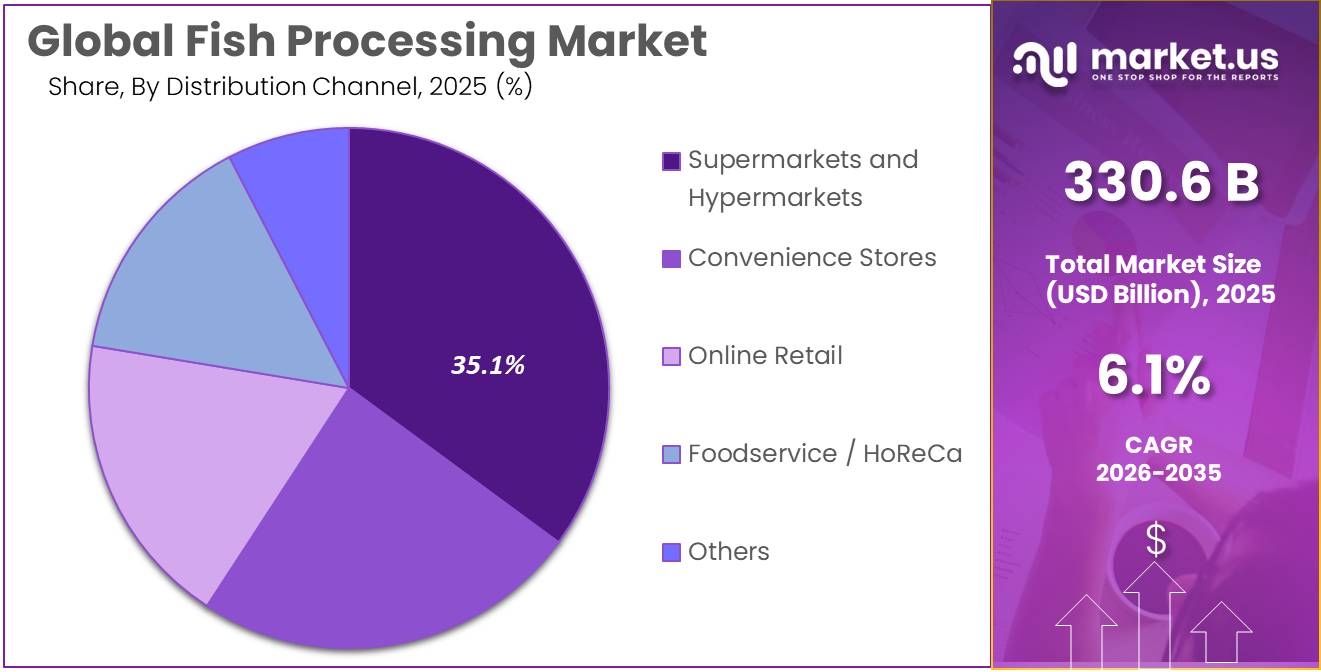
- Supermarkets and Hypermarkets held a dominant market position, capturing more than a 35.00% share.
- Asia Pacific held a dominant market position, capturing more than a 46.58% share and reaching approximately USD 154.00 billion.
By Processing Category Analysis
Frozen Fish Processing dominates with more than 62.40% share, supported by strong demand for longer shelf life and global seafood trade
In 2025, “Frozen” held a dominant market position, capturing more than a 62.40% share of the Fish Processing Market by processing category. Frozen processing remained widely used because it helps seafood producers maintain product quality, extend shelf life, reduce spoilage during transportation, and move fish efficiently through international cold-chain networks.
FAO’s 2026 seafood trade analysis confirms that frozen products continued to play an important role in international fish trade during 2025. For example, FAO reported strong international movement of frozen cod, Alaska pollock, tuna, and tilapia products, showing how freezing remains an essential preservation method for large-volume seafood distribution.
Preserved/Canned remained an important processing category in the Fish Processing Market during 2025, supported by demand for convenient, shelf-stable and ready-to-eat seafood products. Canning allows tuna and other fish products to be stored for longer periods without continuous freezing, making the format suitable for retail distribution, institutional food supply and international trade. FAO reported that global tuna trade reached 4.23 million tonnes in 2025, valued at USD 18.77 billion.
By Processing Technique Analysis
Filleting leads the Fish Processing Market with more than a 30.00% share, supported by rising demand for convenient and value-added fish products
In 2025, “Filleting” held a dominant market position, capturing more than a 30.00% share of the Fish Processing Market by processing technique. Filleting remained widely used because it converts whole fish into convenient, portion-ready products suitable for retail, foodservice, freezing, and further processing. Demand was particularly visible in whitefish and tilapia trade. According to FAO GLOBEFISH, U.S. frozen tilapia fillet imports reached 104,050 tonnes in 2025, increasing by 9.3% from the previous year. FAO also reported that frozen fillets represented 82.7% of Vietnamese pangasius imports across major international markets in 2025.
Slaughtering remained a fundamental processing technique in the Fish Processing Market during 2025, particularly across aquaculture-based processing facilities handling salmon, tilapia, pangasius, tuna, and other commercially important species. The technique represents an early processing stage before bleeding, gutting, filleting, freezing, and packaging. OECD-FAO data show that global fisheries and aquaculture production reached approximately 199 million tonnes in 2025, mainly supported by aquaculture growth.
Atlantic salmon production alone reached around 3.157 million tonnes in 2025, increasing by 12.1% from 2024. Higher farmed-fish production increases the volume of fish moving through controlled harvesting and slaughtering systems, encouraging processors to invest in automated stunning, bleeding, handling, hygiene, and welfare-focused equipment. Efficient slaughtering also supports product quality by reducing physical damage and preparing fish consistently for downstream processing operations.
By Species Analysis
Fish dominates the Fish Processing Market with more than a 63.20% share, supported by large processing volumes across salmon, cod, pollock, and tilapia
In 2025, “Fish” held a dominant market position, capturing more than a 63.20% share of the Fish Processing Market by species. The segment remained strong because fish species such as salmon, cod, pollock, tilapia, tuna, and pangasius are extensively processed into frozen products, fillets, portions, canned foods, and other value-added formats.
FAO reported that global Atlantic salmon production reached approximately 3.157 million tonnes in 2025, increasing by 12.1% from 2024. Norway alone exported 1,414,909 tonnes of salmon during the year. Large whitefish volumes also supported processing activity, as global frozen cod imports reached approximately 560,000 tonnes in 2025, while Russian Alaska pollock exports reached around 916,000 tonnes.
Crustaceans remained an important species category in the Fish Processing Market during 2025, led mainly by shrimp and prawns used in frozen, peeled, cooked, breaded, and ready-to-cook products. FAO reported that global shrimp trade during 2025 remained broadly balanced between supply and demand, while frozen shrimp continued to represent an important product in international seafood distribution. During 2025, Ecuador continued expanding shrimp production and exports, strengthening raw-material availability for processing facilities.
By Application Analysis
Food dominates the Fish Processing Market with more than an 83.00% share as seafood remains primarily directed toward human consumption
In 2025, “Food” held a dominant market position, capturing more than an 83.00% share of the Fish Processing Market by application. The segment remained the main application because most fisheries and aquaculture output is processed for direct human consumption through frozen products, fillets, canned seafood, smoked fish, and ready-to-cook products.
OECD-FAO reported that global fisheries and aquaculture production reached about 199 million tonnes in 2025. During the 2023–2025 base period, around 89% of total production was directed toward food use, showing the strong dependence of fish processing operations on consumer food demand. Global apparent consumption of aquatic animal foods averaged 21.4 kg per person during the same period. These volumes continue to support investment in freezing, filleting, portioning, packaging, preservation, and food-safety systems across major seafood-producing countries.
Animal Feed remained an important application of fish processing in 2025, particularly through the conversion of small pelagic fish, trimmings, offcuts, and other processing residues into fishmeal and fish oil. FAO reported that raw materials used for reduction into fishmeal and fish oil increased by about 14% in the first half of 2025 compared with the same period of 2024, supported by improved small-pelagic catches in Peru.
By Distribution Channel Analysis
Supermarkets and Hypermarkets dominate with more than a 35.00% share as consumers rely on organized retail for fresh, frozen, and packaged seafood
In 2025, “Supermarkets and Hypermarkets” held a dominant market position, capturing more than a 35.00% share of the Fish Processing Market by distribution channel. The segment remained important because large-format grocery stores provide refrigerated and frozen displays for fillets, whole fish, canned seafood, ready-to-cook products, and other processed fish items. U.S. Census Bureau data show that total U.S. retail and food-service sales reached USD 773.9 billion in August 2026, representing an increase of 6.0% compared with August 2025.
Convenience Stores remained a developing distribution channel for the Fish Processing Market in 2025, particularly for compact packaged seafood, canned fish, refrigerated snacks, sandwiches, and ready-to-eat products. Their value comes from easy access, extended trading hours, smaller package sizes, and demand for food that can be consumed with limited preparation.
In August 2026, overall U.S. retail and food-service sales were USD 773.9 billion, up 6.0% year over year, indicating continued consumer spending through physical retail channels. For fish processors, convenience outlets create an additional route for portion-controlled and shelf-stable seafood products outside traditional supermarkets.
Key Market Segments
By Processing Category
- Frozen
- Preserved/ Canned
- Fresh/Chilled
- Dried/ Curved
- Others
By Processing Technique
- Slaughtering
- Gutting
- Filleting
- Deboning
- Skinning
- Others
By Species
- Fish
- Crustaceans
- Mollusks
- Others
By Application
- Food
- Animal Feed
- Biomedical
- Pharmaceuticals
- Others
By Distribution Channel
- Supermarkets and Hypermarkets
- Convenience Stores
- Online Retail
- Foodservice / HoReCa
- Others
Driver Analysis
Aquaculture Raw-Material Scale
Aquaculture expansion is the largest processing-volume driver because farmed fish offers processors more predictable species mix, harvest scheduling, lot sizing, fat content, grading, and quality than seasonal wild catches, improving utilization of filleting lines, freezing tunnels, packaging equipment, cold stores, and labour. Global fisheries and aquaculture production reached 223.2 million tonnes in 2022, including 185.4 million tonnes of aquatic animals, while aquaculture supplied 94.4 million tonnes of aquatic animals—51% of the global total and, for the first time, more than capture fisheries.
FAO projects aquatic-animal production to rise 10% to about 205 million tonnes by 2032, creating an additional processing pool of roughly 18–19 million tonnes even before accounting for product conversion, trimming, secondary processing, and food-service packaging. The operating leverage is substantial: a plant running a 10,000-tonne annual salmon, tilapia, pangasius, shrimp, seabass, or carp line at 65% capacity processes 6,500 tonnes, whereas lift to 80% adds 1,500 tonnes without proportional increases in rent, cold-store depreciation, quality systems, or management labour; at a USD 0.40–1.50 per kilogram conversion margin, that can add USD 0.6–2.3 million in annual gross processing contribution.
Consistent aquaculture supply also enables contract processing, automated portioning, pre-set recipe production, retailer private-label agreements, and fixed-slot logistics, shifting processors from opportunistic catch buying to planned supply-chain manufacturing. China, Norway, Chile, India, Vietnam, Indonesia, Ecuador, Türkiye, and African aquaculture corridors benefit most because they combine expanding farms with export or urban consumption markets. The projected scale-up supports an estimated +2.2-percentage-point contribution to fish-processing CAGR through 2028–2030.
Drivers Impact Analysis
| Driver | (\~) % Impact on CAGR Forecast | Geographic Relevance | Impact Timeline |
|---|---|---|---|
| Aquaculture raw-material scale | +2.2 pp | China, Norway, Chile, India, ASEAN | Medium term (2–4 years) |
| Digital seafood traceability | +1.7 pp | EU, U.S., Japan, South Korea, export Asia | Short term (≤ 2 years) |
| Value-added convenience seafood | +1.5 pp | North America, EU, urban APAC, GCC | Short term (≤ 2 years) |
| Cold-chain capacity buildout | +1.3 pp | India, ASEAN, Africa, LATAM, MENA | Medium term (2–4 years) |
| By-product circularization | +1.1 pp | Norway, EU, Chile, China, Japan | Medium term (2–4 years) |
| Protein-security procurement | +0.9 pp | China, MENA, Africa, South Asia, island states | Long term (≥ 4 years) |
Restraint Analysis
Wild-Stock Supply Limits
Wild-stock supply limitations are the largest structural restraint because many processors remain dependent on variable capture fisheries for species such as cod, tuna, pollock, sardines, mackerel, squid, hake, shrimp, crab, and small pelagics, yet biological quotas, changing migration patterns, warming waters, marine heatwaves, fuel costs, and stock-rebuilding closures directly reduce raw-material availability and plant utilization.
FAO’s 2025 global stock assessment found that only 64.5% of assessed marine stocks are exploited within biologically sustainable levels and 35.5% are overfished, while overfishing has been rising by about 1% annually in recent years; by volume, 77.2% of landings come from biologically sustainable stocks, but this aggregate figure conceals acute shortages in high-value regional fisheries.
For a plant designed to process 20,000 tonnes annually, a 15% quota reduction or late-season closure removes 3,000 tonnes of input; with fixed cold-store, depreciation, sanitation, maintenance, management, and certification costs of USD 2–6 million, utilization falling from 80% to 60% can raise conversion cost per kilogram by 20–35% and turn a USD 0.30–0.80 per kilogram processing margin negative. Supply scarcity also raises dockside fish prices, narrows filleting spreads, reduces by-product volume, and pushes processors toward lower-yield species or imported frozen blocks whose quality and traceability may not match retailer specifications.
As aquaculture has already surpassed capture fisheries as a source of aquatic animals, processors unable to redesign procurement around farmed supply face a worsening cost disadvantage rather than a temporary volume decline. Wild-stock limits are therefore estimated to deduct -2.1 percentage points from fish-processing CAGR over the long term, particularly in the EU, Japan, China, North America, coastal Africa, and quota-constrained South American fisheries.
Restraint Impact Analysis
| Restraint | (\~) % Impact on CAGR Forecast | Geographic Relevance | Impact Timeline |
|---|---|---|---|
| Wild-stock supply limits | -2.1 pp | EU, Japan, China, North America, coastal Africa | Long term (≥ 4 years) |
| Cold-chain energy inflation | -1.6 pp | Europe, North America, Asia import hubs, MENA | Short term (≤ 2 years) |
| Traceability compliance costs | -1.4 pp | EU, export Asia, Africa, LATAM, North America | Short term (≤ 2 years) |
| Labour-intensive yield losses | -1.2 pp | Europe, North America, Japan, processing Asia | Medium term (2–4 years) |
| Food-safety recall exposure | -1.0 pp | Global export markets | Medium term (2–4 years) |
| Import access fragmentation | -0.9 pp | EU, U.S., China, UK, Japan, South Korea | Medium term (2–4 years) |
Opportunity Analysis
Seafood Processing-as-a-Service
Seafood processing-as-a-service is an untapped model because processors typically earn one-time conversion margins on filleting, freezing, packing, or canning, whereas retailers, meal-kit firms, e-commerce operators, food-service chains, institutional buyers, and aquaculture farms increasingly need an outsourced end-to-end operating layer covering harvest scheduling, raw-material intake, grading, portioning, recipe development, packaging, traceability, cold storage, fulfilment, and returns. This is not a current volume driver: aquaculture supply and convenience consumption support baseline demand, but the upside comes from securing 3–7-year contracted capacity, minimum-volume commitments, capacity reservation fees, quality service-level agreements, and digital order integration.
A processor with 10,000 tonnes of annual line capacity operating at 60% utilization can offer 2,000–3,000 tonnes to contracted customers without major new building investment; at an incremental processing and logistics contribution of USD 0.40–1.50 per kilogram, this creates USD 0.8–4.5 million of additional annual gross contribution, while a USD 0.03–0.10 per kilogram service, traceability, and fulfilment fee can add recurring higher-margin revenue. The market is structurally prepared for the model because aquaculture supplied 94.4 million tonnes of aquatic animals in 2022, or 51% of global aquatic-animal production, providing the predictable harvest volumes needed for contract manufacturing; FAO’s 2026 update indicates aquaculture animal production exceeded 100 million tonnes in 2024.
The platform shifts client acquisition from competing for spot fish volume to onboarding branded customers and farms once, then embedding electronic data interchange, specification libraries, packaging procurement, cold-chain scheduling, and quality reporting; this can lower recurring customer-acquisition costs by 20–40% and improve capacity visibility 6–12 months ahead. Success requires disciplined allergen controls, product-development teams, flexible lines, retailer-grade audit performance, and working-capital finance, but the service model can add approximately +1.9 percentage points to fish-processing CAGR across Europe, North America, Japan, South Korea, and export-oriented Asian supply chains within two years.
Opportunity Impact Analysis
| Opportunity | (\~) % Potential CAGR Upside | Geographic Relevance | Execution Window |
|---|---|---|---|
| Seafood processing-as-a-service | +1.9 pp | EU, North America, Japan, export Asia | Short term (≤ 2 years) |
| Aquaculture co-processing hubs | +1.7 pp | China, India, ASEAN, Chile, Norway, Africa | Medium term (2–4 years) |
| By-product biorefinery platforms | +1.5 pp | Norway, Chile, EU, Japan, China, island states | Medium term (2–4 years) |
| Precision portioning automation | +1.3 pp | North America, EU, Japan, South Korea, Australia | Medium term (2–4 years) |
| Traceability data monetization | +1.2 pp | EU, U.S., Japan, South Korea, export Asia | Short term (≤ 2 years) |
| Regional cold-chain roll-ups | +1.0 pp | India, ASEAN, Africa, LATAM, MENA | Medium term (2–4 years) |
Challenges Analysis
Biological Input Variability
Biological input variability is the industry’s largest continuous technical challenge because processors must handle different species, body shapes, bone structures, shell hardness, fat levels, temperatures, maturity, parasite exposure, harvest methods, and size distributions, preventing the standardized cycle times and tight tolerances achieved in automotive or packaged-goods manufacturing; sector research explicitly identifies biological variation as a reason seafood automation has advanced more slowly and confirms that skilled workers remain necessary for complex filleting, trimming, peeling, inspection, and quality control.
A line calibrated for 3–5 kg farmed salmon may sustain 90–95% equipment availability and tight portion weights, while a mixed wild-catch intake varying 20–40% in length or mass can require repeated resets, slower belt speeds, more manual trimming, and 2–6 percentage points lower edible yield; at a 20,000-tonne plant, each 1-point yield loss removes 200 tonnes of finished product, equivalent to USD 1.0–2.4 million of annual revenue at USD 5–12 per kg. Variability also destabilizes freezing load, brining, smoking uptake, cooking loss, package selection, labour scheduling, and by-product quality, while frequent species changeovers can consume 30–120 minutes of sanitation and setup per event; two daily changeovers over 250 operating days can eliminate 250–1,000 production hours.
Aquaculture reduces but does not eliminate the problem: global farmed aquatic-animal output surpassed 100 million tonnes in 2024, yet farms still vary by genetics, feed, disease history, harvest weight, and temperature, while wild fisheries remain indispensable to many product categories. Mitigation requires supplier grading standards, pre-harvest forecasting, 3D vision, adaptive cutting algorithms, modular tooling, recipe-controlled processing, digital-twin simulation, and contracts that price raw material by recoverable yield rather than gross weight; however, machine-learning models need thousands of labelled examples per species and size class and cannot economically cover every low-volume SKU. Biological variability therefore imposes an estimated -1.4-percentage-point long-term friction drag across global wild-catch processors and multi-species plants in China, Japan, Southeast Asia, Europe, Africa, and Latin America.
Challenges Impact Analysis
| Challenge | (\~) % CAGR Friction Drag | Geographic Relevance | Mitigation Horizon |
|---|---|---|---|
| Biological input variability | -1.4 pp | Global wild-catch hubs, mixed-species Asia | Long term (≥ 4 years) |
| Cold-chain continuity risk | -1.2 pp | ASEAN, Africa, South Asia, LATAM, islands | Long term (≥ 4 years) |
| Skilled labor transition | -1.0 pp | EU, North America, Japan, export Asia | Medium term (2–4 years) |
| Lot-data reconciliation | -0.9 pp | EU corridors, U.S., Japan, export markets | Medium term (2–4 years) |
| Yield and by-product control | -0.8 pp | Global filleting and shellfish clusters | Medium term (2–4 years) |
| Effluent-load management | -0.7 pp | Asia, LATAM, Africa, coastal EU | Long term (≥ 4 years) |
Geopolitical Impact Analysis
Ongoing Wars Raise Energy, Logistics, and Raw-Material Costs Across the Fish Processing Market
The current war environment is placing fresh pressure on the Fish Processing Market through higher fuel costs, disrupted shipping routes, expensive cold-chain operations, and uncertain raw-material availability. The Russia-Ukraine war has already increased energy, transport, feed, and refrigeration costs across the European fisheries and processing sector. In 2026, the Middle East conflict created another major risk as disruption around the Strait of Hormuz affected global energy and freight movements.
FAO reported that nearly 20% of global oil and gas passes through this route, while Brent crude prices increased by 13% within five days after disruption intensified in February 2026. Higher energy prices directly affect fishing vessels, freezing plants, cold storage, processing machinery, and refrigerated transport. Seafood logistics have also faced pressure, particularly for air-freighted products such as salmon.
FAO reported that Norwegian salmon export volumes through Oslo airport fell by around 50% in the days following the conflict escalation. For fish processors, these disruptions can increase operating costs, delay deliveries, and encourage greater use of frozen and shelf-stable products. The European Commission has also activated emergency fisheries support mechanisms to help processors and related businesses manage conflict-driven disruptions.
Regional Insights
Asia Pacific Leads the Fish Processing Market, While Africa Shows Strong Future Growth Potential
In 2025, Asia Pacific held a dominant market position, capturing more than a 46.58% share and reaching approximately USD 154.00 billion in the Fish Processing Market. Its leadership is supported by a very large fisheries and aquaculture supply base, established seafood-processing clusters, export infrastructure, and strong domestic consumption. FAO reported in June 2026 that Asia produced 179 million tonnes of aquatic animals and algae in 2024, representing 76% of global production. Around 130 million tonnes of this regional output came from aquaculture, providing processors with substantial raw-material availability for frozen fish, fillets, canned seafood, and other value-added products.
Fastest-Growing Regional Opportunity – Africa: Africa represents a strong emerging growth opportunity for fish processing as consumption and aquaculture expand. OECD-FAO projects African aquatic-food consumption to increase by 20% by 2035, almost twice the expected global growth rate. Aquaculture production across Africa is projected to rise by 37% over the outlook period, making it one of the fastest-expanding production regions. Rising population, increasing seafood demand, new aquaculture facilities, improved cold storage, and investment in local processing could support greater demand for freezing, filleting, preservation, and packaged fish products.
Key Regions and Countries Insights
- North America
- US
- Canada
- Europe
- Germany
- France
- The UK
- Spain
- Italy
- Rest of Europe
- Asia Pacific
- China
- Japan
- South Korea
- India
- Australia
- Rest of APAC
- Latin America
- Brazil
- Mexico
- Rest of Latin America
- Middle East & Africa
- GCC
- South Africa
- Rest of MEA
Key Players Analysis
Maruha Nichiro Corporation: Maruha Nichiro, renamed Umios Corporation in March 2026, maintains a strong position in seafood sourcing, processing, frozen foods, canned fish, and value-added products. In FY ended March 2025, its Processed Foods Business generated JPY 171.9 billion in net sales and JPY 12.7 billion in operating income. The company processes frozen foods, canned seafood, fish sausage, fish paste products, and ready-to-eat foods through production sites in Japan and overseas, strengthening its integrated seafood value chain.
Thai Union Group PCL: Thai Union remains a major global seafood processor with operations spanning ambient seafood, frozen products, chilled seafood, pet care, and value-added foods. In 2025, its ambient category generated THB 64.2 billion, accounting for 48.4% of group revenue, while branded products represented around 55.7% of ambient sales. Total company revenue reached THB 133.60 billion in 2025, with net profit of THB 4.61 billion. Its portfolio includes tuna, sardines, mackerel, salmon, and frozen shrimp.
Nissui Corporation: Nissui operates across fisheries, aquaculture, seafood processing, chilled foods, and international marine-product trading. In FY2025, announced in May 2026, the company recorded its highest-ever net sales and profits, while operating profit exceeded JPY 40.0 billion for the first time. Its Food Products processing operation generated about JPY 121.6 billion in net sales, while chilled products contributed approximately JPY 66.1 billion. Growth was supported by domestic fisheries, aquaculture, South American operations, and overseas seafood processing and trading.
Top Key Players Outlook
- Maruha Nichiro Corporation
- Thai Union Group PCL
- Nissui Corporation (Nippon Suisan Kaisha, Ltd.)
- Mowi ASA
- Charoen Pokphand Foods PCL
- Trident Seafoods Corporation
- Pacific Seafood Group
- Lerøy Seafood Group ASA
- Austevoll Seafood ASA
- Royal Greenland A/S
- Nueva Pescanova Group
- Cooke Inc. / Cooke Aquaculture
- High Liner Foods Incorporated
- Dongwon Industries Co., Ltd.
- Bolton Group S.r.l.
Recent Developments
- February 2026, Mowi reported 2025 revenue of about EUR 5.73 billion and harvest volume of 559,000 tonnes, up 11.4%, while branded product volumes increased by 30%. In August 2026, second-quarter revenue reached a record EUR 1.6 billion, with harvest volume of 150,000 tonnes.
- In February 2026, CPF reported total 2025 sales of THB 571.135 billion and net profit of THB 25.197 billion, up 29% year over year, while 62% of sales came from overseas operations.
Report Scope
| Report Features | Description |
|---|---|
| Market Value (2025) | USD 330.6 Bn |
| Forecast Revenue (2035) | USD 596.9 Bn |
| CAGR (2026-2035) | 6.1% |
| Base Year for Estimation | 2025 |
| Historic Period | 2020-2024 |
| Forecast Period | 2026-2035 |
| Report Coverage | Revenue Forecast, Market Dynamics, Competitive Landscape, Recent Developments |
| Segments Covered | By Processing Category (Frozen, Preserved/ Canned, Fresh/Chilled, Dried/ Curved, Others), By Processing Technique (Slaughtering, Gutting, Filleting, Deboning, Skinning, Others), By Species (Fish, Crustaceans, Mollusks, Others, By Application, Food, Animal Feed, Biomedical, Pharmaceuticals, Others, By Distribution Channel, Supermarkets and Hypermarkets, Convenience Stores, Online Retail, Foodservice / HoReCa, Others) |
| Regional Analysis | North America – US, Canada; Europe – Germany, France, The UK, Spain, Italy, Rest of Europe; Asia Pacific – China, Japan, South Korea, India, Australia, Singapore, Rest of APAC; Latin America – Brazil, Mexico, Rest of Latin America; Middle East & Africa – GCC, South Africa, Rest of MEA |
| Competitive Landscape | Maruha Nichiro Corporation, Thai Union Group PCL, Nissui Corporation (Nippon Suisan Kaisha, Ltd.), Mowi ASA, Charoen Pokphand Foods PCL, Trident Seafoods Corporation, Pacific Seafood Group, Lerøy Seafood Group ASA, Austevoll Seafood ASA, Royal Greenland A/S, Nueva Pescanova Group, Cooke Inc. / Cooke Aquaculture, High Liner Foods Incorporated, Dongwon Industries Co., Ltd., Bolton Group S.r.l. |
| Customization Scope | Customization for segments, region/country-level will be provided. Moreover, additional customization can be done based on the requirements. |
| Purchase Options | We have three licenses to opt for: Single User License, Multi-User License (Up to 5 Users), Corporate Use License (Unlimited User and Printable PDF) |





































