


Report Overview
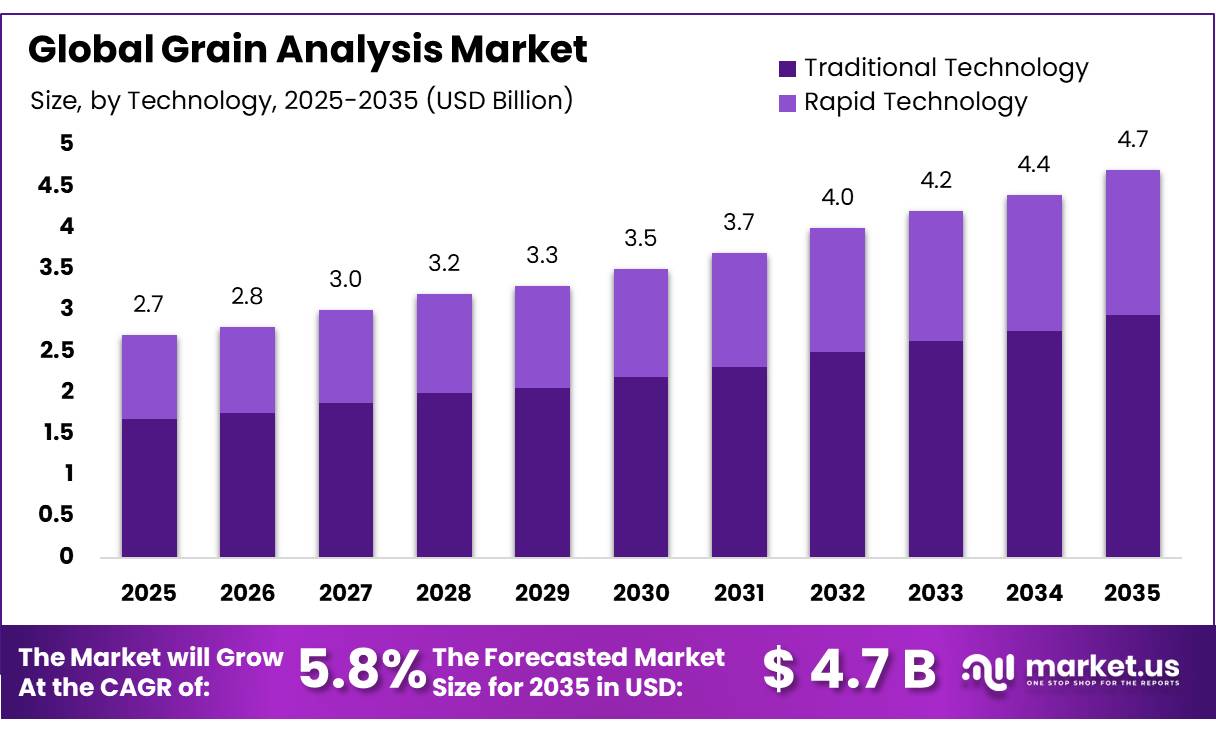
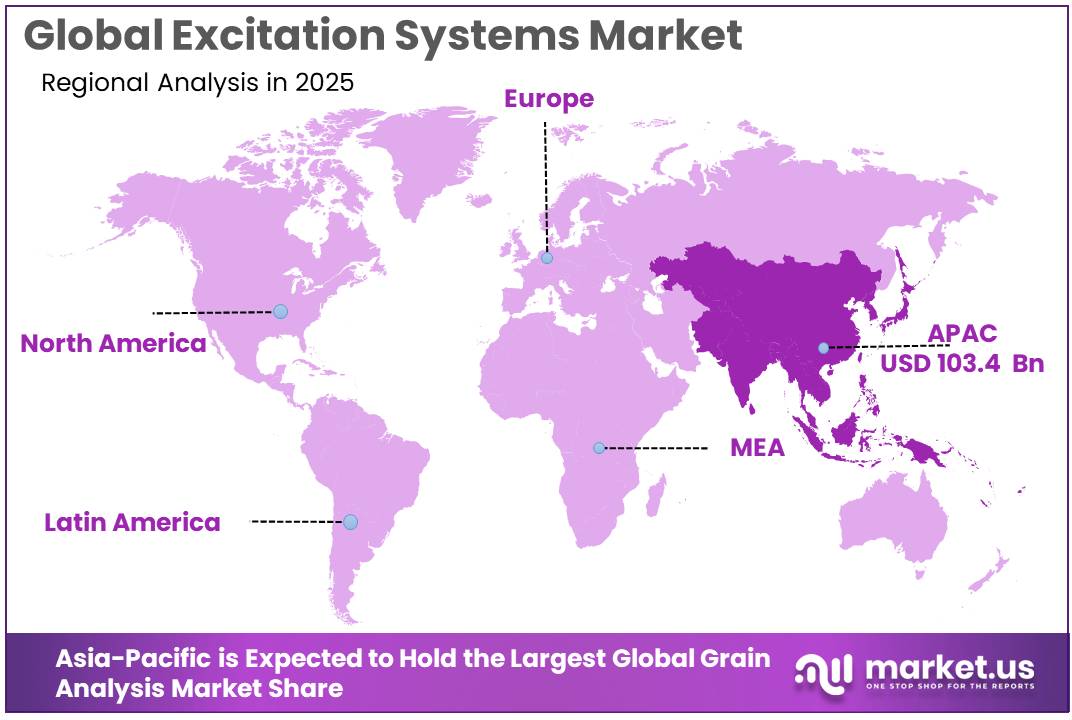
The Global Grain Analysis Market size is expected to be worth around USD 4.7 Billion by 2035, from USD 2.7 Billion in 2025, growing at a CAGR of 5.8% during the forecast period from 2026 to 2035. In 2025, Asia-Pacific held a dominant market position, capturing more than a 38.32% share, holding USD 103.4 Billion revenue.
Grain analysis plays an important role in modern agriculture, food processing, trading, storage, and feed production because buyers and regulators require clear information about grain quality, safety, composition, and commercial grade. Testing commonly covers moisture, protein, oil, starch, test weight, foreign material, pesticide residues, mycotoxins, microorganisms, and physical defects.
- The present industrial scenario provides a large testing base. FAO estimated global cereal production at about 3.043 billion tonnes in 2025, representing an increase of 6.1% from the previous year. Global cereal utilization for 2025/26 was estimated at around 2.965 billion tonnes, while ending stocks were approximately 947 million tonnes. Large production and inventory volumes increase the number of grain lots requiring inspection during procurement, storage, milling, export, and feed manufacturing.
International trade also supports laboratory and rapid-testing demand. FAO’s 2025 outlook placed global cereal trade at roughly 500.6 million tonnes, up 3.3% year over year. In the United States, the Federal Grain Inspection Service previously conducted about 2.7 million official grain inspections, covering approximately 268.7 million metric tonnes under federal grain standards. This illustrates the operating scale behind standardized testing for export and domestic grain transactions.
- Food-safety regulation is another major driver. WHO states that Codex maximum levels for aflatoxins in grains and other foods can range from 0.5 to 15 µg/kg, reflecting the need for sensitive analytical methods. Such limits support the use of chromatography, immunoassays, spectroscopy, PCR-based methods, and rapid field-testing systems for contamination screening and confirmation.
Future opportunities remain strong because global cereal supply is expected to expand further. The OECD-FAO Agricultural Outlook projects global cereal production to reach about 3.22 billion tonnes by 2035, while international trade is expected to increase from around 17% to 18% of production. Average cereal yields are projected to reach 4.2 tonnes per hectare. These trends should support continued investment in rapid grain testing, mycotoxin monitoring, automated grading, digital quality records, and high-throughput laboratory analysis.
Key Takeaways
- Grain Analysis Market size is expected to be worth around USD 4.7 Billion by 2035, from USD 2.7 Billion in 2025, growing at a CAGR of 5.8%.
- Traditional Technology held a dominant market position, capturing more than a 62.56% share.
- Cereals held a dominant market position, capturing more than a 41.45% share in the Grain Analysis Market.
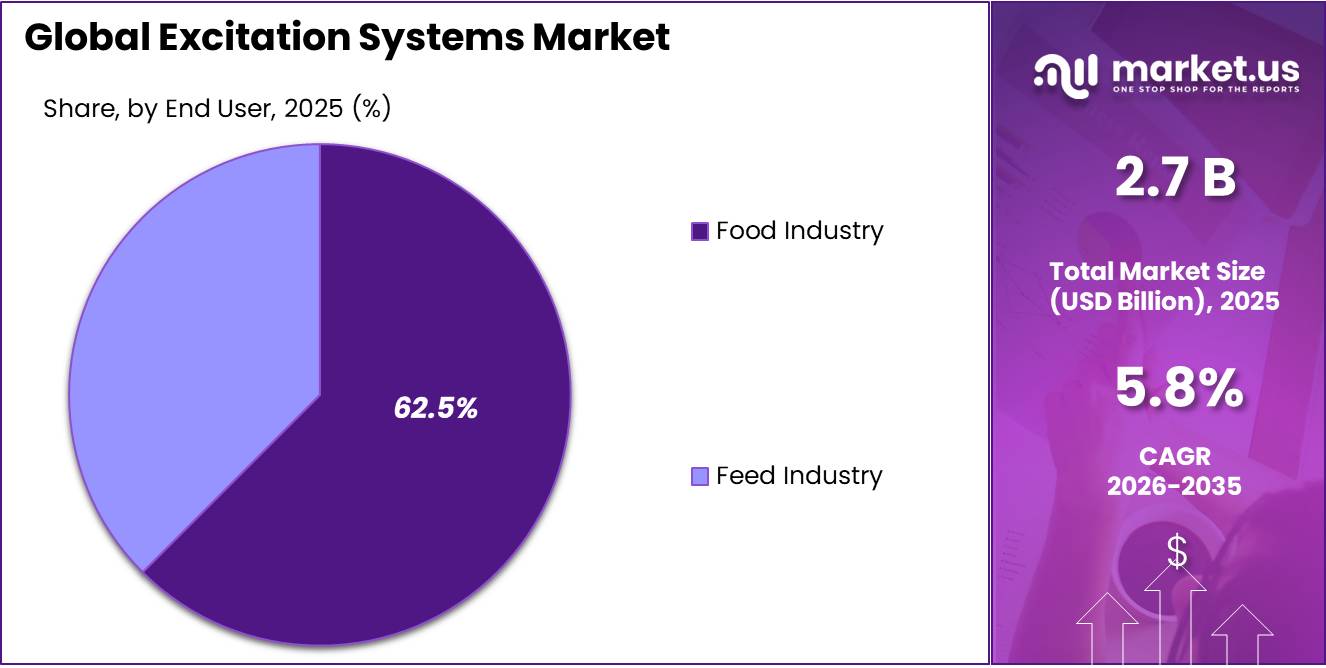
- Food Industry held a dominant market position, capturing more than a 62.56% share.
- Asia-Pacific held a dominant position in the Grain Analysis Market, accounting for 38.32% of the market and reaching about USD 103.4 billion.
By Technology Analysis
Traditional Technology Leads with 62.56% Share as Standardized Grain Inspection Remains Essential
In 2025, “Traditional Technology” held a dominant market position, capturing more than a 62.56% share in the Grain Analysis Market by technology. Traditional methods remain widely used for visual grading, sieving, test weight, moisture determination, dockage measurement, foreign-material identification, and laboratory confirmation because they are embedded in official inspection procedures and commercial grain contracts.
USDA’s Federal Grain Inspection Service reported 73,288 original official inspections during FY2025, together with 2,397 reinspections and 755 grain appeals. (USDA) The same agency inspected about 146.3 million metric tons of grain exports in FY2025, up 16.3% from the previous year. (USDA) FGIS also check-tested more than 1,420 pieces of inspection equipment, showing the continuing importance of standardized physical and laboratory-based grain analysis.
Rapid Technology continued to gain importance in 2025 as grain handlers, exporters, mills, and food processors sought faster decisions on safety and quality. Near-infrared systems, rapid mycotoxin kits, digital imaging, and automated moisture instruments can reduce turnaround times while supporting high-volume grain movement. USDA FGIS evaluated 16 rapid mycotoxin test kits in FY2025, of which 12 met official performance requirements, including 5 kits for aflatoxins and 4 for deoxynivalenol.
FGIS also operated approximately 185 near-infrared transmittance instruments and analyzed 11,745 grain samples to monitor field performance. In addition, around 1,020 moisture meters were checked through the official moisture program, supported by 2,040 check-test samples. These developments show how rapid technology is becoming more important for protein, oil, starch, moisture, and contaminant testing while maintaining traceability to official reference methods.
By Grain Type Analysis
Cereals Lead with 41.45% Share as Large Global Volumes Require Continuous Quality Testing
In 2025, “Cereals” held a dominant market position, capturing more than a 41.45% share in the Grain Analysis Market by grain type. Cereals such as wheat, maize, rice, barley, and other coarse grains require regular testing for moisture, protein, mycotoxins, foreign material, test weight, and physical defects before storage, processing, and international trade.
FAO estimated global cereal production at a record 3.043 billion tonnes in 2025, representing a 6.1% increase from the previous year. By October 2026, FAO forecast world cereal production at 2.979 billion tonnes, including 813.9 million tonnes of wheat and 1.612 billion tonnes of coarse grains. These large volumes create a broad testing base for laboratories, grain elevators, exporters, millers, and inspection agencies.
Oilseeds remained an important grain-analysis segment in 2025, supported by strong demand for soybean, canola, sunflower, peanut, and other oil-bearing crops. These commodities require testing for oil content, protein, moisture, foreign material, pesticide residues, and contamination because quality directly affects crushing efficiency and end-product value. FAO projected global soybean production at a record 432.3 million tonnes in 2025/26, reflecting continued growth in major producing countries.
USDA also reported in 2026 that soybeans account for more than 90% of U.S. oilseed production, showing the crop’s importance within commercial oilseed testing. As oilseed processing becomes more specification-driven, demand is expected to rise for near-infrared analysis, moisture measurement, compositional testing, and rapid screening before crushing, storage, and export.
By End User Analysis
Food Industry Leads with 62.56% Share as Grain Quality and Safety Testing Remain Essential
In 2025, “Food Industry” held a dominant market position, capturing more than a 62.56% share in the Grain Analysis Market by end user. Food manufacturers, millers, bakeries, cereal processors, and ingredient companies depend on grain analysis to confirm moisture, protein, starch, foreign material, mycotoxins, and overall processing quality before raw materials enter production. FAO estimated world cereal utilization at around 2.929 billion tonnes in 2025/26, while global cereal stocks were forecast to reach 916.3 million tonnes.
In addition, FAO expected international cereal trade to reach about 499.5 million tonnes during the same season, increasing the need for consistent quality checks across food supply chains. USDA’s National Agricultural Statistics Service also continues to publish annual and quarterly flour-milling statistics covering wheat and rye consumption, flour output, and milling capacity, highlighting the scale of grain testing required by food processors.
Feed Industry remained an important end-user segment in 2025 as feed manufacturers required accurate grain testing to manage nutrient content, moisture, mycotoxins, and formulation consistency. FAO projected global cereal utilization at 2.943 billion tonnes in 2025/26, with greater use across wheat, coarse grains, and rice. Earlier 2025 estimates also showed global cereal food consumption rising by 0.9%, while feed use was expected to increase by 0.5%.
FAO continued to point to strong feed demand, particularly for barley and maize, while large wheat supplies from the 2025 harvest also encouraged greater use in animal feed. USDA’s Feed Grains Database tracks corn, sorghum, barley, oats, oilseed meals, and other feed ingredients, including utilization for feed and residual use, helping support formulation and quality-control decisions across commercial feed operations.
Key Market Segments
By Technology
- Traditional Technology
- Rapid Technology
By Grain Type
- Cereals
- Oilseeds
- Pulses
By End User
- Food Industry
- Feed Industry
Driver Analysis
Export-Grade Quality Verification
USDA’s Federal Grain Inspection Service supports marketing by establishing quality standards, regulating handling practices, and operating through a network of federal, state, and private laboratories that provide impartial inspection and weighing; in FY2025, the system inspected 146.3 million metric tons of grain exports, up 16.3% year on year, and performed 73,288 original official inspections. This trade intensity creates a large recurring testing requirement: a 5-million-tonne export terminal handling 50,000 truck, rail, barge, and vessel lots annually may conduct 100,000–300,000 moisture, protein, grade, and contamination measurements per year, with an analyst-modelled USD 2–8 cost per rapid test and USD 80–400 cost per confirmatory laboratory panel.
A 0.5 percentage-point error in moisture measurement on a 60,000-tonne vessel can misstate 300 tonnes of saleable dry matter, worth roughly USD 60,000–120,000 at USD 200–400 per tonne, making analyzer accuracy economically material rather than an administrative requirement. The business model increasingly shifts from periodic laboratory testing toward continuous, point-of-receipt analysis: exporters and elevators deploy automated sampling, NIR screening, integrated weighbridge data, cloud certificates, and exception-based confirmatory testing to reduce loading disputes, accelerate vessel turnaround, and preserve premium-grade inventory.
Equipment vendors capture higher value by combining USD 15,000–80,000 NIR systems with annual calibration, remote diagnostics, reference-sample programs, and LIMS integration that can generate 8–15% of equipment value in recurring revenue each year. This export-verification driver is estimated to add +2.1 percentage points to grain-analysis CAGR across North America, Brazil, Argentina, Ukraine-adjacent trade corridors, Australia, and major importing hubs in the Middle East, North Africa, and Asia through 2028.
Drivers Impact Analysis
| Driver | (~) % Impact on CAGR Forecast | Geographic Relevance | Impact Timeline |
|---|---|---|---|
| Export-grade quality verification | +2.1 pp | North America, Brazil, Argentina, Black Sea, Australia | Short term (≤ 2 years) |
| Mycotoxin compliance testing | +1.9 pp | EU, North America, China, India, Africa | Short term (≤ 2 years) |
| Precision grain segregation | +1.6 pp | North America, EU, Australia, Brazil | Medium term (2–4 years) |
| Feed-milling quality optimization | +1.4 pp | China, ASEAN, India, LATAM, Middle East | Medium term (2–4 years) |
| On-site NIR digitization | +1.2 pp | Global elevators, mills, processors | Short term (≤ 2 years) |
| Traceable low-carbon trading | +0.9 pp | EU, North America, Brazil, Australia | Long term (≥ 4 years) |
Restraint Analysis
High Instrument Ownership Cost
A basic portable moisture meter may cost USD 500–3,000, but a robust bench NIR instrument typically requires USD 15,000–60,000, an automated sampling-and-analysis line USD 75,000–300,000, and a confirmatory HPLC or LC-MS workflow USD 100,000–600,000 before extraction equipment, reference materials, climate-controlled laboratory space, software, calibration, and trained staff are included; for a facility handling 20,000–50,000 tonnes annually, this can equal USD 0.50–8.00 of capital burden per tonne in the first year.
Annual ownership costs can add 8–20% of purchase value through calibration transfer, service, lamp or detector replacement, software, proficiency testing, and technician time, while low utilization—such as operating a USD 40,000 analyzer for only 50–100 days per year—pushes test cost above USD 5–15 per sample compared with USD 1–4 at a high-volume terminal. Official inspection also imposes an accuracy bar: USDA’s Equipment Capability Testing programme verifies the accuracy of equipment used in official grain-quality testing, including moisture meters, mycotoxin kits, NIRT equipment, scales, samplers, and falling-number apparatus, making informal or low-cost equipment substitutions commercially difficult in regulated trade flows.
The result is delayed CapEx, use of manual visual grading, dependence on third-party laboratories, or purchase of lower-specification devices that cannot support premium segregation or food-safety decisions; vendors face slower volume growth and must absorb greater financing risk. Leasing at USD 300–2,000 per month, pay-per-test pricing, shared-lab networks, refurbished certified equipment, and distributor-led calibration services can reduce the hurdle, but thin rural service coverage and high borrowing costs still suppress adoption. This restraint is estimated to deduct -1.7 percentage points from attainable grain-analysis CAGR across India, Africa, Southeast Asia, Latin America, Central Asia, and smaller grain-handling operations through 2028.
Restraint Impact Analysis
| Restraint | (~) % Impact on CAGR Forecast | Geographic Relevance | Impact Timeline |
|---|---|---|---|
| High instrument ownership cost | -1.7 pp | India, Africa, ASEAN, LATAM | Short term (≤ 2 years) |
| Sampling-error liability | -1.5 pp | Global grain supply chains | Medium term (2–4 years) |
| Calibration reference scarcity | -1.3 pp | Emerging markets, niche crops | Medium term (2–4 years) |
| Fragmented testing standards | -1.1 pp | Export corridors, EU–APAC trade | Medium term (2–4 years) |
| Low-margin elevator economics | -1.0 pp | North America, LATAM, Black Sea, Africa | Short term (≤ 2 years) |
| Confirmatory-lab bottlenecks | -0.8 pp | Africa, Asia, LATAM, rural regions | Long term (≥ 4 years) |
Opportunity Analysis
Analyzer-as-a-Service
Analyzer-as-a-service is a future monetization opportunity rather than a current adoption driver because grain-analysis vendors still predominantly sell instruments upfront, leaving smaller elevators, cooperatives, feed mills, traders, and processors unable to justify USD 15,000–60,000 for bench NIR equipment, USD 75,000–300,000 for automated sampling and analysis lines, or USD 100,000–600,000 for confirmatory HPLC/LC-MS workflows.
A subscription structure priced at USD 500–3,000 per month for NIR, moisture, protein, oil, starch, and mycotoxin-screening capability can convert 70–100% of customer CapEx into operating expense, include calibration, repairs, reference materials, cloud reporting, and equipment replacement, and reduce payback concern for sites handling only 20,000–100,000 tonnes annually; at 1,000 subscribed instruments with USD 1,250 average monthly revenue, a supplier can create USD 15 million in annual recurring revenue versus intermittent one-time sales.
The commercial upside lies in combining hardware financing with consumption-based charges of USD 0.50–4.00 per test, enabling a vendor to capture USD 10,000–50,000 of lifetime revenue per site over five years while increasing service attachment from 10–20% of initial equipment value to 35–55%. USDA’s official grain-inspection system provides a quality-control benchmark for this model: approximately 185 NIRT instruments are used across federal, state, and private inspection offices, supported by annual calibration review, 11,745 monitored grain samples, 3,315 standard reference samples, and 754 calibration samples supplied to reference laboratories in FY2025.
The white space is therefore not demand for routine testing itself, but the underdeveloped financial and calibration infrastructure that makes validated analytics accessible to lower-throughput customers; it requires captive leasing, third-party asset finance, remotely monitored uptime, automated billing, and strict credit discipline to avoid weak collection rates. This model could add approximately +2.0 percentage points to grain-analysis CAGR across India, Southeast Asia, Africa, Latin America, Central Asia, and fragmented rural grain markets within two years.
Opportunity Impact Analysis
| Opportunity | (~) % Potential CAGR Upside | Geographic Relevance | Execution Window |
|---|---|---|---|
| Analyzer-as-a-service | +2.0 pp | India, ASEAN, Africa, LATAM | Short term (≤ 2 years) |
| Digital grain passports | +1.8 pp | North America, EU, Brazil, Australia | Medium term (2–4 years) |
| Mobile contaminant labs | +1.6 pp | Africa, India, ASEAN, LATAM | Short term (≤ 2 years) |
| Feed-formulation analytics | +1.4 pp | China, India, ASEAN, LATAM, MENA | Medium term (2–4 years) |
| Carbon-premium verification | +1.1 pp | EU, North America, Brazil, Australia | Long term (≥ 4 years) |
| Testing-network roll-ups | +0.9 pp | North America, EU, India, Brazil | Long term (≥ 4 years) |
Challenges Analysis
Representative Sampling Variability
A 1,000-tonne storage cell or shipment can contain moisture gradients of 1–3 percentage points, protein variation of 0.5–1.5 percentage points, and localized fungal or mycotoxin “hot spots” across less than 1–5% of the mass; moving from one grab sample to a defensible composite often requires 10–100 increments, 5–20 kg of aggregate material, controlled grinding, sub-sampling, and complete chain-of-custody documentation.
The economic downside is asymmetric: a false-negative result on a 5,000-tonne lot valued at USD 1–2 million can trigger rejection, recall exposure, rehandling, and contract claims, while false-positive classification can downgrade the same lot by USD 10–60 per tonne and destroy USD 50,000–300,000 of margin. EU Regulation 2023/915 requires identifiable cereal consignments and bars food above applicable contaminant limits from sale, increasing the evidentiary burden on testing results and sampling procedures.
A high-throughput facility processing 300–1,000 truckloads daily may need USD 50,000–300,000 for automated cross-belt samplers, probes, dividers, grinders, barcode systems, and audit software before its USD 20,000–100,000 analyzer can produce defensible results; manual sampling can add 2–8 minutes per load and create harvest-season queue delays of 10–60 minutes.
Suppliers and operators must standardize sampling plans by commodity and hazard, automate increments, train operators, conduct blind audits, and link every sample to the physical lot, but changing grain flows, silo segregation, and inconsistent on-site discipline mean the issue requires continuous management. This structural friction is estimated to reduce attainable grain-analysis CAGR by -1.5 percentage points globally over four or more years.
Challenges Impact Analysis
| Challenge | (\~) % CAGR Friction Drag | Geographic Relevance | Mitigation Horizon |
|---|---|---|---|
| Multi-fuel engineering complexity | -1.5 pp | Europe, Asia maritime hubs, Gulf, global OEMs | Long term (≥ 4 years) |
| Precision-component supply volatility | -1.3 pp | North America, EU, China, Japan, India, ASEAN | Medium term (2–4 years) |
| Skilled-service technician deficit | -1.1 pp | North America, EU, Japan, Korea, remote regions | Long term (≥ 4 years) |
| In-use emissions validation | -1.0 pp | EU core, UK, Türkiye, export OEMs | Medium term (2–4 years) |
| Hybrid-system integration burden | -0.9 pp | Europe, China, Japan, Korea, North America | Medium term (2–4 years) |
| Certification evidence cycles | -0.8 pp | Aviation, marine, defence, EU, U.S. | Long term (≥ 4 years) |
Geopolitical Impact Analysis
Ongoing Wars Increase Grain Testing Needs as Trade Routes and Storage Conditions Become More Uncertain
The Russia–Ukraine war and continuing conflict around the Middle East are influencing the Grain Analysis Market through disrupted grain movement, higher freight costs, storage pressure, and greater need for quality testing before export and processing. Ukraine remains an important grain supplier, but FAO reported in March 2026 that its 2025/26 cereal exports were forecast at about 40 million tonnes, around 20% below the previous year, as war continued to restrict transport and storage capacity. Wheat exports were expected at 14 million tonnes, maize at 23 million tonnes, and barley at 2.5 million tonnes.
These disruptions increase the importance of moisture, mycotoxin, protein, contamination, and grading tests because grain may remain in storage longer or move through alternative logistics routes. Middle East tensions have added further pressure. UNCTAD reported in March 2026 that shipping through the Strait of Hormuz had fallen by more than 95%, disrupting energy and fertilizer flows and raising transport and agricultural input costs. Higher fertilizer and fuel costs can affect grain quality, production economics, and sourcing patterns. As trade routes change and storage periods lengthen, exporters, millers, feed producers, and inspection agencies are expected to rely more heavily on rapid testing, traceability, and standardized grain analysis.
Regional Insights
Asia-Pacific Leads the Grain Analysis Market with 38.32% Share and USD 103.4 Billion Value
In 2025, Asia-Pacific held a dominant position in the Grain Analysis Market, accounting for 38.32% of the market and reaching about USD 103.4 billion in value. Regional leadership is supported by large cereal production, expanding food processing, active grain trade, and stronger quality-control requirements across storage, milling, feed, and export channels.
Asia-Pacific also shows the strongest growth opportunity for grain analysis as governments and agribusinesses increase spending on food safety, traceability, laboratory capacity, and modern agricultural supply chains. In March 2026, ADB reported that it had already delivered more than USD 14 billion for food-security programs during 2022–2025, reaching 62 million farmers and creating over 500,000 jobs.
ADB’s 2026 work on SPS measures highlighted the need for stronger regional cooperation and closer alignment with international standards to support agricultural trade. For grain handlers and processors, these changes increase the importance of fast, reliable testing for contaminants, moisture, composition, and physical quality. Rising use of near-infrared systems, rapid mycotoxin kits, digital imaging, and automated sampling should therefore strengthen Asia-Pacific’s role in future grain-analysis adoption.
Key Regions and Countries Insights
- North America
- US
- Canada
- Europe
- Germany
- France
- The UK
- Spain
- Italy
- Rest of Europe
- Asia Pacific
- China
- Japan
- South Korea
- India
- Australia
- Rest of APAC
- Latin America
- Brazil
- Mexico
- Rest of Latin America
- Middle East & Africa
- GCC
- South Africa
- Rest of MEA
Key Players Analysis
Bureau Veritas holds a strong position in agricultural commodities, food inspection, certification, and laboratory testing, supporting grain quality and trade assurance. In 2025, the company generated €6.47 billion in total revenue, while its Agri-Food & Commodities business contributed €1.16 billion. This division recorded 3.7% organic growth and €175.6 million in adjusted operating profit, with a 15.1% margin. Bureau Veritas employed 82,049 people globally, supporting inspection and analytical services across major agricultural supply chains.
Eurofins Scientific SE is a major laboratory-testing provider serving food, feed, agricultural commodities, contaminants, and grain-quality applications. In 2025, Eurofins generated €7.30 billion in revenue, representing 5.0% reported growth and 3.7% organic growth. Acquisitions contributed €174 million to annual revenue. Its European Food and Feed Testing operations recorded solid volume and pricing growth, while the wider Life segment generated €3.04 billion, equal to 42% of group revenue. These capabilities strengthen Eurofins’ role in grain safety testing.
ALS Limited maintains a strong presence in food, agricultural, environmental, and analytical laboratory services relevant to grain testing. In FY2026, its Life Sciences division generated A$2.03 billion in revenue, increasing 6.0% year over year, while underlying EBITDA reached A$448.9 million, up 9.6%. Underlying EBIT increased 10.2% to A$296.5 million, with a 14.6% margin. ALS stated that growth was led by strong performance in its Food business, supporting expanding demand for quality, composition, contaminant, and safety analysis.
Top Key Players Outlook
- Bureau Veritas
- Eurofins Scientific SE
- ALS Limited
- Intertek Group PLC
- SGS Société Générale de Surveillance SA.
- Thermo Fisher Scientific, Inc.
- Neogen Corporation
- Romer Labs Division Holding GmbH
- Sciex
- Waters Corporation
- Other Key Players
Recent Developments
- By 2026, Intertek continued expanding its testing footprint and digital assurance capabilities, supported by 2025 group revenue of £3.43 billion, adjusted operating profit of £620 million and an operating margin of 18.1%.
- By July 2026, SGS formally added Agroknow to its portfolio, strengthening risk monitoring and supplier assurance across agricultural supply chains. These developments were supported by CHF 6.945 billion in 2025 sales, 5.6% organic growth, and a global network of more than 2,500 laboratories and business facilities across 115 countries, giving SGS strong capacity to serve grain exporters, processors and food manufacturers with quality, contaminant and compliance testing.
Report Scope
| Report Features | Description |
|---|---|
| Market Value (2025) | USD 2.7 Bn |
| Forecast Revenue (2035) | USD 4.7 Bn |
| CAGR (2026-2035) | 5.8% |
| Base Year for Estimation | 2025 |
| Historic Period | 2020-2024 |
| Forecast Period | 2026-2035 |
| Report Coverage | Revenue Forecast, Market Dynamics, Competitive Landscape, Recent Developments |
| Segments Covered | By Technology (Traditional Technology, Rapid Technology), By Grain Type (Cereals, Oilseeds, Pulses), By End User (Food Industry, Feed Industry) |
| Regional Analysis | North America – US, Canada; Europe – Germany, France, The UK, Spain, Italy, Rest of Europe; Asia Pacific – China, Japan, South Korea, India, Australia, Singapore, Rest of APAC; Latin America – Brazil, Mexico, Rest of Latin America; Middle East & Africa – GCC, South Africa, Rest of MEA |
| Competitive Landscape | Bureau Veritas, Eurofins Scientific SE, ALS Limited, Intertek Group PLC, SGS Société Générale de Surveillance SA., Thermo Fisher Scientific, Inc., Neogen Corporation, Romer Labs Division Holding GmbH, Sciex, Waters Corporation, Other Key Players |
| Customization Scope | Customization for segments, region/country-level will be provided. Moreover, additional customization can be done based on the requirements. |
| Purchase Options | We have three licenses to opt for: Single User License, Multi-User License (Up to 5 Users), Corporate Use License (Unlimited User and Printable PDF) |





































