Report Overview
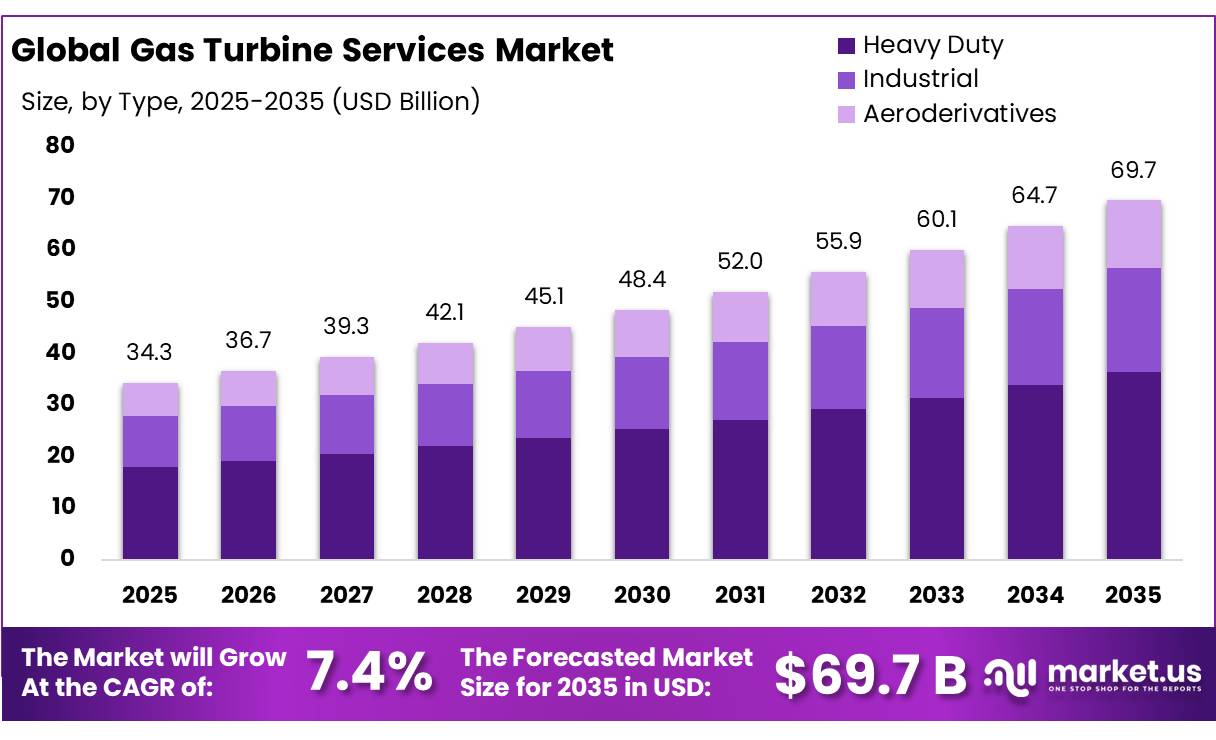
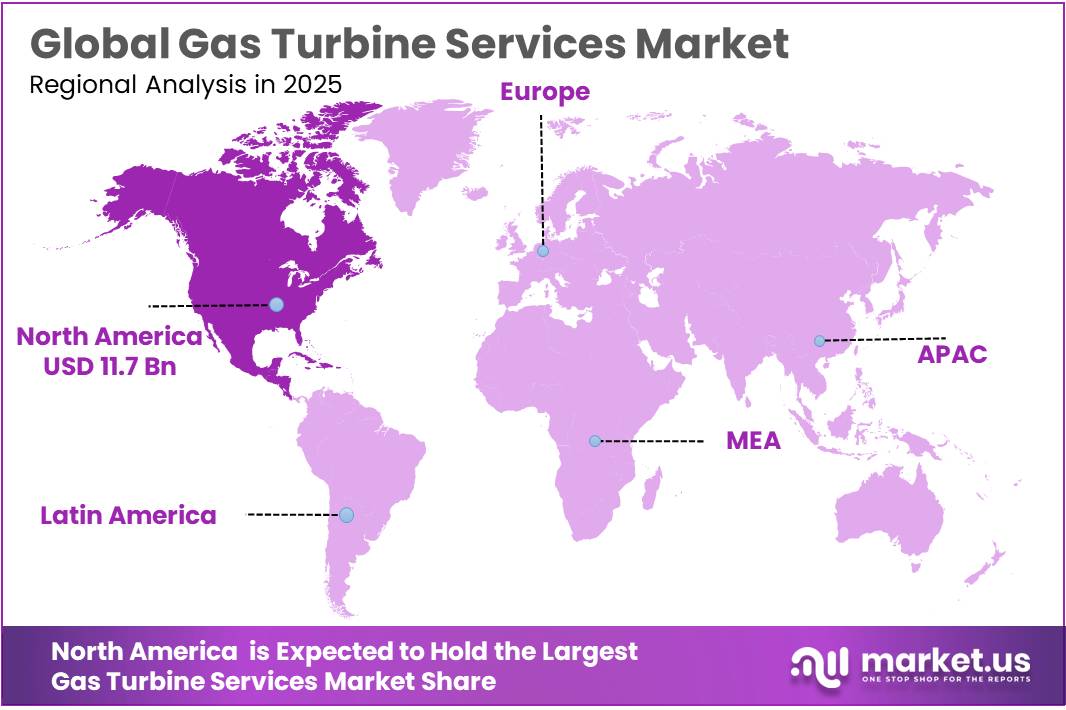
The Global Gas Turbine Services Market size is expected to be worth around USD 69.7 Billion by 2035, from USD 34.3 Billion in 2025, growing at a CAGR of 7.4% during the forecast period from 2026 to 2035. In 2025, North America held a dominant market position, capturing more than a 38.60% share, holding USD 11.7 Billion revenue.
Gas turbine services play a vital role in the energy and industrial sectors by ensuring the reliable, efficient, and safe operation of gas turbines. These services include maintenance, repair, overhaul, spare parts replacement, performance monitoring, technical inspection, and equipment upgrades. Gas turbines are widely used in power generation, oil and gas, petrochemicals, chemical processing, aviation, and other energy-intensive industries.
- The industrial scenario of gas turbine services is changing as electricity demand increases and industries focus on operational efficiency. Gas turbines support reliable power generation and help maintain grid stability during fluctuations in renewable energy production. In 2025, global gas turbine orders exceeded 100 gigawatts (GW), reflecting rising demand for power infrastructure, industrial development, and electricity-intensive facilities. Oak Ridge National Laboratory reported in April 2026 that delivery timelines for critical gas turbines had extended to 5–7 years in certain cases because of manufacturing constraints, skilled labor shortages, and material availability.
One of the major driving factors is the aging installed base of gas turbines across power plants and industrial facilities. Continuous exposure to high temperatures, pressure, and mechanical stress increases the need for regular inspection and component replacement. According to the American Society of Heating, Refrigerating and Air-Conditioning Engineers (ASHRAE), industrial gas turbines may require overhauls after approximately 12,000–40,000 operating hours, depending on the design and operating conditions.
Another important growth driver is the rising adoption of digital technologies and predictive maintenance. Advanced sensors, remote diagnostics, artificial intelligence, and real-time performance monitoring allow service providers to identify potential equipment failures before they disrupt operations. The ISO 3977-9:2024 standard provides a framework for evaluating gas turbine reliability, availability, maintainability, component life expectancy, and overhaul intervals. These practices encourage industrial operators to adopt structured maintenance strategies and improve equipment performance.
Key Takeaways
- Gas Turbine Services Market size is expected to be worth around USD 69.7 Billion by 2035, from USD 34.3 Billion in 2025, growing at a CAGR of 7.4%.
- Heavy Duty held a dominant market position, capturing more than a 52.34% share.
- 100 to 200 MW held a dominant market position, capturing more than a 41.00% share.
- Spare parts supply held a dominant market position, capturing more than a 64.34% share.
- Non-OEM service providers are gaining attention by offering cost-effective maintenance.
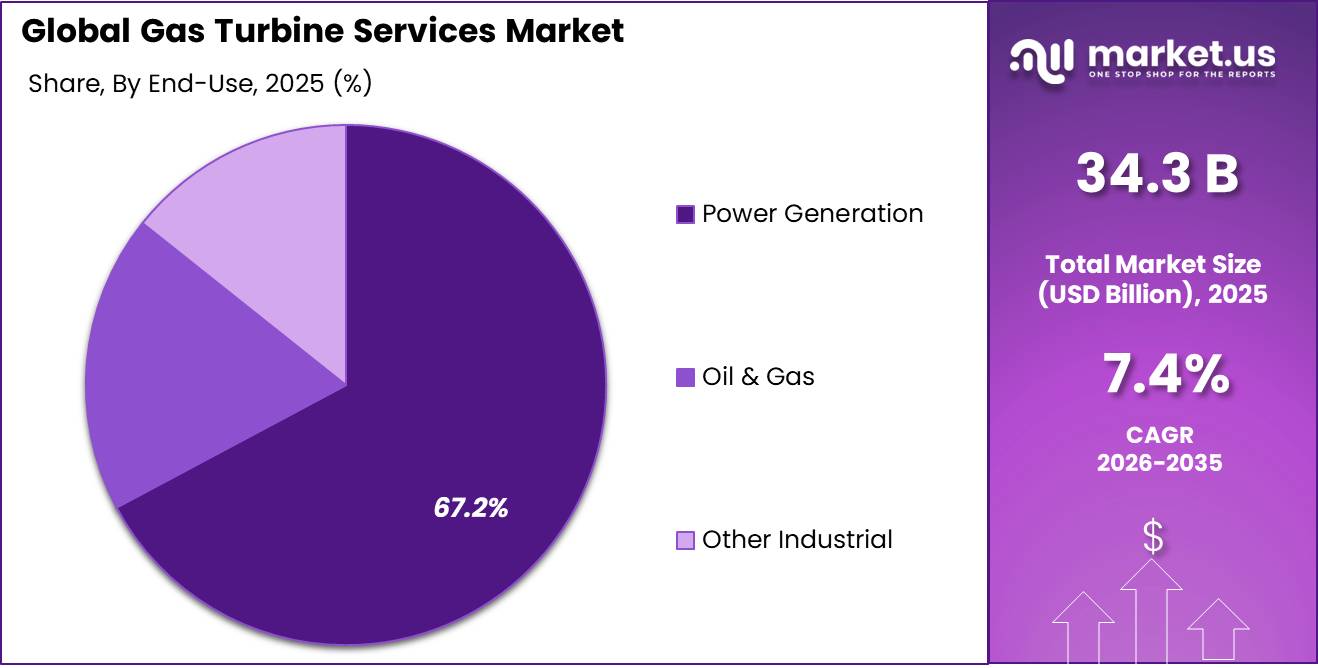
- Power Generation held a dominant market position, capturing more than a 67.24% share.
- North America held a dominant position in the Gas Turbine Services Market in 2025, accounting for 34.23% of the market, valued at USD 11.7 billion.
By Type Analysis
Heavy Duty Turbines Maintain a Leading Position Through High-Capacity Power Generation
In 2025, “Heavy Duty” held a dominant market position, capturing more than a 52.34% share. Heavy-duty gas turbines dominate the market due to their high power output, operational reliability, and suitability for large-scale electricity generation. These turbines are widely used in utility power plants, refineries, and energy-intensive industrial facilities. Their ability to operate continuously under demanding conditions increases the need for regular inspection, maintenance, repair, and overhaul services.
Industrial gas turbine services support manufacturing facilities, chemical processing plants, refineries, and other energy-intensive operations. Industrial applications require dependable power supply, operational efficiency, and reduced equipment downtime. In 2025, industrial gas turbines remained important for combined heat and power generation, supporting electricity production alongside useful process heat.
According to the U.S. Energy Information Administration (EIA), the industrial sector accounted for approximately 26% of total U.S. energy consumption in 2023, highlighting the significant energy requirements of industrial operations.
By Capacity Analysis
100 to 200 MW Turbines Lead Demand Through Efficient Large-Scale Power Generation
In 2025, “100 to 200 MW” held a dominant market position, capturing more than a 41.00% share. Gas turbines within this capacity range maintain a strong position due to their ability to deliver reliable power for utility-scale electricity generation and large industrial facilities. These turbines offer a practical balance between power output, operational flexibility, and efficiency, making them suitable for combined-cycle power plants and energy-intensive operations.
In 2025, growing electricity requirements and modernization of existing power infrastructure supported demand for maintenance, inspection, component replacement, and performance enhancement services. Their extensive industrial applications continue to create opportunities for long-term service agreements and scheduled overhauls.
By Service Type Analysis
Spare Parts Supply Dominates Through Timely Component Replacement and Operational Reliability
In 2025, “Spare parts supply” held a dominant market position, capturing more than a 64.34% share. Spare parts supply dominates the market due to its essential role in maintaining gas turbine performance and ensuring uninterrupted industrial operations. Gas turbine components are exposed to high temperatures, pressure, and mechanical stress, creating continuous demand for replacement parts and specialized components. In 2025, power generation facilities and industrial operators increasingly focused on maintaining equipment reliability and reducing unexpected shutdowns.
According to the U.S. Energy Information Administration (EIA), natural gas accounted for approximately 43% of U.S. utility-scale electricity generation in 2023, demonstrating the significant role of gas-fired power plants in the electricity supply system. Continuous utilization of these facilities increases the importance of turbine component availability, scheduled replacement, and maintenance services.
By Service Providers Analysis
Non-OEM Providers Expand Through Cost-Effective Maintenance and Flexible Services
Non-OEM service providers are gaining attention by offering cost-effective maintenance, component refurbishment, engineering support, and repair solutions. These companies support industrial operators seeking alternatives to manufacturer-based services while maintaining operational efficiency. In 2025, demand for affordable turbine maintenance and shorter equipment downtime supported the growth of independent service providers.
Their flexibility in sourcing components, providing customized maintenance programs, and offering specialized repair capabilities makes them attractive to power generation and oil and gas operators. Increasing competition and the need to manage maintenance expenses continue to create opportunities for non-OEM providers across the gas turbine services industry.
According to the U.S. Energy Information Administration (EIA), natural gas accounted for approximately 43% of U.S. utility-scale electricity generation in 2023, highlighting the significant role of gas-fired power plants in the national electricity supply. The continued operation of these facilities supports demand for reliable turbine servicing, original spare parts, maintenance, and technical support.
By End-use Analysis
Power Generation Leads Demand Through Reliable Electricity Supply and Plant Efficiency
In 2025, “Power Generation” held a dominant market position, capturing more than a 67.24% share. Power generation dominates the gas turbine services market due to the growing need for reliable electricity supply, operational efficiency, and uninterrupted plant performance. Gas turbines are widely used in electricity generation facilities because of their flexible operation and ability to support grid stability. In 2025, power plant operators increasingly focused on regular turbine inspections, spare parts replacement, maintenance, and performance upgrades to maintain efficient operations.
Oil & Gas applications rely on gas turbines for mechanical drive operations, electricity generation, and compression activities across upstream, midstream, and downstream facilities. These installations require consistent performance under demanding operating conditions, increasing the need for preventive maintenance, equipment inspection, and component replacement. In 2025, oil and gas operators continued to prioritize operational reliability, energy efficiency, and reduced equipment downtime. Gas turbine services support refinery operations, pipeline transportation, gas processing, and offshore production facilities.
According to the U.S. Energy Information Administration (EIA), natural gas accounted for approximately 43% of U.S. utility-scale electricity generation in 2023, making it the largest source of electricity generation in the country. This substantial contribution highlights the importance of gas-fired power generation facilities and supports the continued need for gas turbine maintenance, repair, and performance optimization services.
Key Market Segments
By Type
- Heavy Duty
- Industrial
- Aeroderivatives
By Capacity
- <100 MW
- 100 to 200 MW
- >200 MW
By Service Type
- Maintenance & Repair
- Overhaul
- Spare parts supply
- Others
By Service Providers
- OEM
- Non-OEM
By End-use
- Power Generation
- Oil & Gas
- Other Industrial
Driver Analysis
Operating-Fleet Maintenance Accumulation — +0.8 Percentage Points
The installed operating fleet generates recurring service requirements as fired hours, starts and component-life consumption accumulate, supporting inspections, hot-gas-path repairs, coatings, replacement hardware and rotor assessment without requiring new turbine installations. GE Vernova reports approximately 7,000 installed gas turbines, illustrating the scale of one supplier’s serviceable fleet rather than the entire global market.
EIA’s finalized US data show combined-cycle capacity factors of 60.5% in 2024 and 58.4% in 2025, while simple-cycle gas-turbine capacity factors increased from 13.9% to 14.1%; consequently, an across-the-board increase in utilization should not be assumed.
In a constructed 100-unit cohort operating 6,000 fired hours annually, a nominal 24,000-hour intervention interval implies approximately twenty-five interventions per year in steady state; an assumed USD 2 million eligible service scope produces USD 50 million of annual activity. These figures illustrate maintenance throughput, not guaranteed outage timing, because factored hours, starts and component condition can advance or defer work.
The +0.8-point sensitivity assumes 35% of terminal counterfactual revenue is exposed to maintenance accumulation and achieves approximately 11.3% cumulative outperformance, adding 3.9% terminal market revenue. Suppliers capture value through overhaul-slot planning, exchange hardware and repair logistics, while longer-life replacement parts must offset the forecast where they reduce subsequent intervention frequency.
Drivers Impact Analysis
| Driver | (~) % Impact on CAGR Forecast | Geographic Relevance | Impact Timeline |
|---|---|---|---|
| Operating-fleet maintenance accumulation | +0.8 pp | US, EU, Gulf states, Japan | Short term (≤ 2 years) |
| New-fleet service attachment | +0.7 pp | US, Gulf states, China, ASEAN | Long term (≥ 4 years) |
| Efficiency and output upgrades | +0.7 pp | US, EU, Japan, South Korea | Medium term (2–4 years) |
| Cycling-related component consumption | +0.6 pp | US, EU, Australia, India | Medium term (2–4 years) |
| Long-term service contract conversion | +0.5 pp | US, EU, Gulf states, ASEAN | Medium term (2–4 years) |
| Industrial turbine modernization | +0.5 pp | Gulf states, US, ASEAN, Latin America | Medium term (2–4 years) |
Restraint Analysis
Fuel-Cost Dispatch Suppression — −0.6 Percentage Points
Higher delivered gas costs can push turbines down the dispatch order, reducing fired-hour accumulation and weakening demand for discretionary maintenance and performance upgrades, particularly where electricity-market revenues do not compensate for the fuel increase. IEA’s Q3-2025 review reported that European hub prices and Asian LNG spot prices averaged approximately 40% and 28% above first-half 2024 levels, respectively, with higher prices weighing on gas demand in price-sensitive Asian markets; these are historical observations, not assumed November 2026 price levels.
EIA’s March 2026 outlook similarly projected lower gas-fired generation in most US regions as delivered fuel costs increased, although total US gas generation was forecast to rise 0.5%, demonstrating that regional demand can offset this restraint.
In a constructed plant with a 7 MMBtu/MWh heat rate, gas rising from USD 4 to USD 7/MMBtu increases fuel cost from USD 28 to USD 49/MWh. At USD 55/MWh electricity and USD 4/MWh nonfuel variable cost, the contribution before carbon costs and fixed charges falls from USD 23 to USD 2/MWh. If annual fired hours decline from 6,000 to 4,000, a nominal 24,000-hour intervention moves from four to six years, provided starts or other limits do not trigger it sooner.
The −0.6-point sensitivity assumes 25% terminal revenue exposure and an 11.2% realization shortfall, yielding approximately 2.8% aggregate terminal erosion. Suppliers face slower hours-based service conversion, but starts-related wear, capacity payments, mandatory inspections and fuel-price recovery limit the loss.
Restraint Impact Analysis
| Restraint | (~) % Impact on CAGR Forecast | Geographic Relevance | Impact Timeline |
|---|---|---|---|
| Fuel-cost dispatch suppression | −0.6 pp | EU, Japan, South Korea, South Asia | Short term (≤ 2 years) |
| Extended maintenance intervals | −0.5 pp | US, EU, Gulf states, Japan | Medium term (2–4 years) |
| Upgrade investment hurdles | −0.4 pp | EU, India, ASEAN, Latin America | Medium term (2–4 years) |
| Outage-related revenue sacrifice | −0.4 pp | US, EU, Japan, Gulf states | Short term (≤ 2 years) |
| Legacy turbine retirement | −0.3 pp | US, EU, Japan | Long term (≥ 4 years) |
| Sanctions-restricted service access | −0.3 pp | Russia; EU-linked export channels | Short term (≤ 2 years) |
Opportunity Analysis
Data-Center Availability Packages
The opportunity is to develop turbine-specific availability packages for newly qualified data-center applications, rather than count ordinary service attachment to every new gas turbine as additional upside. GE Vernova’s September 2026 application guidance identifies prime, standby, islanded and grid-connected configurations using aeroderivative and heavy-duty turbines, while its technical white paper describes temporary bridge-power and hybrid configurations with batteries and microgrid controls.
The future monetization lies in incremental turbine controls, readiness testing, reserved repair capacity and response obligations tailored to mission-critical customers not already covered by equivalent contracts. In a constructed 200 MW installation operating 7,500 equivalent full-load hours, turbine generation totals 1.5 million MWh; an assumed USD 6/kW-year premium for genuinely additional eligible scope produces USD 1.2 million of annual supplier revenue. If dedicated inventory carrying costs, monitoring and response readiness cost USD 700,000 annually, contribution before central overhead and performance claims is USD 500,000, or approximately 42% of premium revenue.
A single USD 1 million contractual claim could consume two years of that contribution, making liability limits and redundancy assumptions central to pricing. The +0.5-point sensitivity requires approximately 2.4% additional terminal market revenue from newly captured scope, not from baseline turbine maintenance or electricity sales. Suppliers must separate turbine availability from whole-campus uptime: fuel interruptions, electrical distribution and IT resilience cannot safely be guaranteed through a turbine-only service contract.
Opportunity Impact Analysis
| Opportunity | (~) % Potential CAGR Upside | Geographic Relevance | Execution Window |
|---|---|---|---|
| Data-center availability packages | +0.5 pp | US, Gulf states, India, ASEAN | Medium term (2–4 years) |
| Staged hydrogen-conversion services | +0.4 pp | EU, UK, Japan, Gulf states | Long term (≥ 4 years) |
| Qualified circular-parts programs | +0.4 pp | US, EU, India, ASEAN | Medium term (2–4 years) |
| Cross-fleet performance subscriptions | +0.4 pp | US, EU, Japan, South Korea | Short term (≤ 2 years) |
| Regional engine-exchange networks | +0.4 pp | Gulf states, ASEAN, Latin America | Medium term (2–4 years) |
| Capability-led acquisition platforms | +0.4 pp | US, UK, Germany, India | Short term (≤ 2 years) |
Challenges Analysis
Specialist Service Workforce Gaps
Gas-turbine services depend on experienced field engineers, controls specialists, nondestructive-testing personnel and repair-process technicians whose competence cannot be expanded as quickly as workshop space or equipment. DOE’s 2026 US Energy & Employment Report states that 79% of utilities employers experienced at least some hiring difficulty in 2025; this is a broad utility-sector indicator, not a measured gas-turbine-service vacancy rate.
More specifically, GE Vernova’s January 2025 Singapore expansion announcement included plans to hire more than one hundred technical personnel over five years, illustrating the extended workforce-development commitment accompanying advanced repair growth.
In a constructed service business with fifty field specialists, 1,600 productive hours per person provides 80,000 annual hours. A 10% shortfall leaves 8,000 hours uncovered, equivalent to four interventions requiring 2,000 specialist-hours each. Recovering that gap through qualified overtime at an assumed USD 40/hour premium adds USD 320,000; if only half can be recovered, two interventions remain exposed to rescheduling.
The −0.4-point sensitivity assumes 25% terminal revenue exposure and a 7.5% delivery shortfall, producing approximately 1.9% terminal erosion. Suppliers must develop supervised training pathways, retain senior diagnosticians and transfer repeatable tasks to validated tooling without substituting inexperienced staff for safety-critical judgment. This is persistent capacity friction rather than a complete sales barrier: orders remain viable, but scarce expertise limits the rate of reliable execution.
Challenges Impact Analysis
| Challenge | (~) % CAGR Friction Drag | Geographic Relevance | Mitigation Horizon |
|---|---|---|---|
| Specialist service workforce gaps | −0.4 pp | US, EU, Gulf states, ASEAN | Long term (≥ 4 years) |
| Advanced repair capacity synchronization | −0.4 pp | US, EU, Singapore, Gulf states | Medium term (2–4 years) |
| Component life assessment uncertainty | −0.3 pp | US, EU, Japan, India | Long term (≥ 4 years) |
| Global outage resource coordination | −0.3 pp | US, EU, Gulf states, ASEAN | Medium term (2–4 years) |
| Fleet configuration data fragmentation | −0.3 pp | US, EU, India, Latin America | Medium term (2–4 years) |
| Remote service cybersecurity exposure | −0.3 pp | US, EU, Japan, Gulf states | Long term (≥ 4 years) |
Geopolitical Impact Analysis
Geopolitical Impact of the Ongoing Middle East War on the Gas Turbine Services Market
The ongoing war in the Middle East is creating significant challenges for the Gas Turbine Services Market by disrupting natural gas supplies, increasing energy prices, and affecting international supply chains. The closure and disruption of shipping through the Strait of Hormuz have increased uncertainty for power generation and industrial operators. According to the International Energy Agency (IEA), approximately 20% of global liquefied natural gas (LNG) supply was affected by the disruption in 2026, creating pressure on fuel availability and electricity generation costs.
Higher fuel prices and transportation costs are increasing operating expenses for gas turbine operators. Disruptions in shipping routes are also affecting the timely delivery of critical spare parts, turbine blades, combustion components, and maintenance equipment. These challenges are increasing service costs and delaying scheduled maintenance and repair activities. In addition, uncertainty in energy markets is encouraging some industrial operators to postpone non-essential investments and maintenance activities.
- According to the IEA Global Gas Security Review 2026, global LNG supply is expected to decline by approximately 3%, equivalent to nearly 20 billion cubic metres (bcm), in 2026. This supply shortage is increasing competition for available fuel and creating operational pressure on gas-fired power plants.
Despite these challenges, the conflict is creating opportunities for gas turbine service providers. Countries are strengthening energy security, improving power generation reliability, and investing in domestic infrastructure. Consequently, demand for preventive maintenance, spare parts supply, equipment refurbishment, performance optimization, and long-term service agreements is expected to remain important as operators focus on uninterrupted power generation and operational efficiency.
Regional Insights
North America – Dominating Region (34.23%, USD 11.7 Billion)
North America held a dominant position in the Gas Turbine Services Market in 2025, accounting for 34.23% of the market, valued at USD 11.7 billion. The region benefits from a well-established gas turbine fleet, strong electricity demand, and extensive power generation infrastructure. The United States remains a major contributor due to the increasing demand for reliable electricity, modernization of existing power plants, and expansion of energy-intensive industries.
According to the U.S. Energy Information Administration (EIA), natural gas accounted for 43% of U.S. electricity generation in 2023, supporting the importance of gas-fired power infrastructure. In 2025, growing electricity consumption from data centers, industrial facilities, and grid infrastructure strengthened demand for turbine maintenance, spare parts, and performance upgrades. The region’s established service networks, advanced technologies, and focus on operational reliability continue to support its leading market position.
Asia-Pacific is expected to witness strong growth in gas turbine services due to rising electricity consumption, industrial expansion, and increasing investments in power generation infrastructure. China, Japan, South Korea, and Southeast Asian economies are supporting regional demand through power plant development and modernization.
According to Mitsubishi Heavy Industries, global gas turbine market volume reached 57.4 GW in 2024, while orders reached 41.7 GW in the first half of 2025. North America recorded 18.6 GW and the Middle East and North Africa recorded 12.0 GW during the same period, demonstrating the increasing global demand for turbine installations. The expanding installed base across Asia-Pacific is creating opportunities for maintenance, repair, overhaul, spare parts supply, and long-term service agreements. Increasing industrialization and the need for reliable electricity are expected to support the region’s growth in the coming years.
Key Regions and Countries Insights
- North America
- US
- Canada
- Europe
- Germany
- France
- The UK
- Spain
- Italy
- Rest of Europe
- Asia Pacific
- China
- Japan
- South Korea
- India
- Australia
- Rest of APAC
- Latin America
- Brazil
- Mexico
- Rest of Latin America
- Middle East & Africa
- GCC
- South Africa
- Rest of MEA
Key Players Analysis
General Electric, through GE Vernova, provides comprehensive gas turbine services, including maintenance, repair, spare parts supply, and performance upgrades. In 2025, the company continued to strengthen its service capabilities through long-term service agreements and digital monitoring solutions. GE Vernova supports an installed capacity exceeding 1,000,000 MW across more than 120 countries, reflecting its extensive global service network. Its offerings focus on improving turbine efficiency, reducing downtime, and extending equipment life.
Siemens Energy is a major provider of gas turbine maintenance, overhaul, repair, and digital service solutions. In November 2025, the company reported a secured gas turbine service fleet of approximately 78 GW, covering more than 500 gas turbines across different applications and regions. The company also outlined plans for approximately 180 GW of fleet additions by 2030. Its service portfolio includes predictive maintenance, remote monitoring, performance optimization, and long-term service agreements to improve reliability and operational efficiency.
Mitsubishi Power provides gas turbine services covering spare parts, component repair, field outage support, remote monitoring, and long-term maintenance agreements. In 2026, the company strengthened its service portfolio through lifecycle management and digital monitoring solutions designed to improve equipment performance and reliability. Its TOMONI digital platform supports operational optimization and predictive diagnostics, helping power plant operators identify potential equipment issues and reduce unexpected downtime. The company also provides specialized technical support and customized maintenance programs to extend turbine life and improve power generation efficiency.
Top Key Players Outlook
- General Electric
- Siemens Energy
- Mitsubishi Power
- Rolls-Royce Holdings plc
- Ansaldo Energia
- Solar Turbines
- Doosan Enerbility
- Alstom Power
- Baker Hughes
- Hitachi Energy
- Power Machines
- Safran Power Units
- Shanghai Electric
- Cummins Inc.
- Other Key Players
Recent Developments
- In April 2026, Ansaldo Energia reported €2.3 billion in orders, a 24% annual increase, and €1.2 billion in revenue, representing 10% growth. In May 2026, the company announced approximately €80 million in investments and 200 planned new hires to strengthen manufacturing capacity.
- In February 2026, Doosan signed a contract with Korea Southern Power to supply 3 units of 380 MW gas turbines for power plants in Hadong and Goyang-Changneung. In May 2026, it secured long-term service agreements worth approximately KRW 480 billion for 3 gas turbine units, covering hot gas path parts, overhaul, consumables, and technical support.
Report Scope
| Report Features | Description |
|---|---|
| Market Value (2025) | USD 34.3 Bn |
| Forecast Revenue (2035) | USD 69.7 Bn |
| CAGR (2026-2035) | 7.4% |
| Base Year for Estimation | 2025 |
| Historic Period | 2020-2024 |
| Forecast Period | 2026-2035 |
| Report Coverage | Revenue Forecast, Market Dynamics, Competitive Landscape, Recent Developments |
| Segments Covered | By Type (Heavy Duty, Industrial, Aeroderivatives), By Capacity (<100 MW, 100 to 200 MW, >200 MW), By Service Type (Maintenance & Repair, Overhaul, Spare parts supply, Others), By Service Providers (OEM, Non-OEM), By End-use (Power Generation, Oil & Gas, Other Industrial) |
| Regional Analysis | North America – US, Canada; Europe – Germany, France, The UK, Spain, Italy, Rest of Europe; Asia Pacific – China, Japan, South Korea, India, Australia, Singapore, Rest of APAC; Latin America – Brazil, Mexico, Rest of Latin America; Middle East & Africa – GCC, South Africa, Rest of MEA |
| Competitive Landscape | General Electric, Siemens Energy, Mitsubishi Power, Rolls-Royce Holdings plc, Ansaldo Energia, Solar Turbines, Doosan Enerbility, Alstom Power, Baker Hughes, Hitachi Energy, Power Machines, Safran Power Units, Shanghai Electric, Cummins Inc., Other Key Players |
| Customization Scope | Customization for segments, region/country-level will be provided. Moreover, additional customization can be done based on the requirements. |
| Purchase Options | We have three licenses to opt for: Single User License, Multi-User License (Up to 5 Users), Corporate Use License (Unlimited User and Printable PDF) |